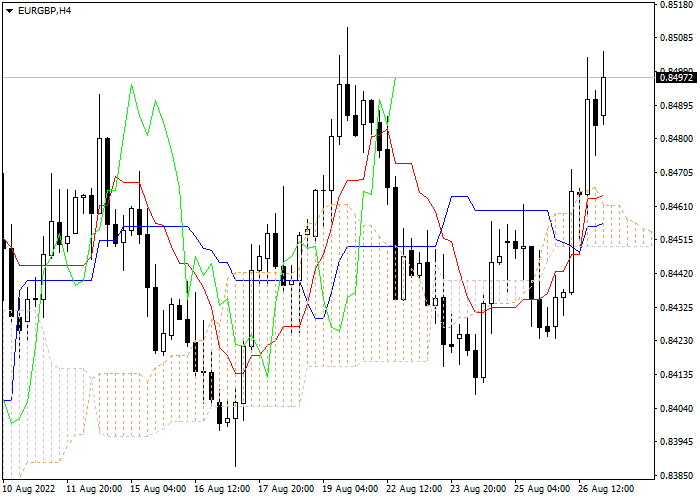
Let's look at the four-hour chart. Tenkan-sen line is above Kijun-sen, the lines are horizontal . Confirmative line Chikou Span is above the price chart, current cloud is ascending. The instrument is trading above Tenkan-sen and Kijun-sen lines; the Bullish trend is still strong. The closest support level is the upper border of the cloud (0.8448). One of the previous maximums of Chikou Span line is expected to be a resistance level (0.8690).
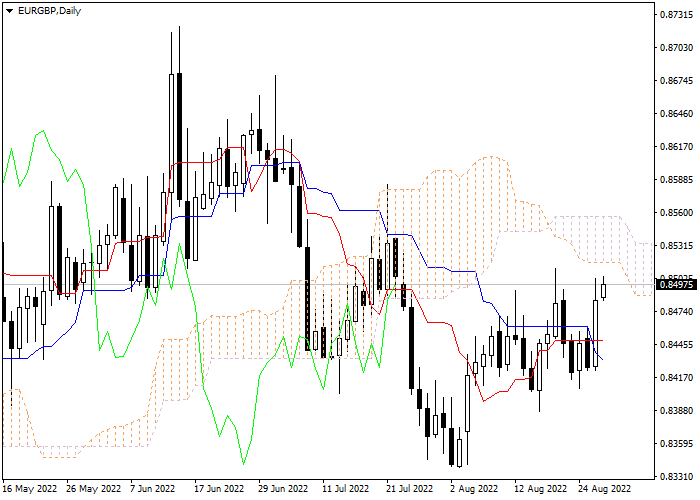
On the daily chart Tenkan-sen line is above Kijun-sen, the blue line is directed downwards, while the red one remains horizontal. Confirmative line Chikou Span is below the price chart, current cloud is descending. The instrument is trading around lower border of the cloud. The closest support level is Kijun-sen line (0.8409). The closest resistance level is the upper border of the cloud (0.8545).
On the four-hour chart the instrument is still rising. On the daily chart the Bearish trend is still strong. It is recommended to open long positions at current price with the target at the level of previous maximum of Chikou Span line (0.8690) and Stop Loss at the upper border of the cloud (0.8448).
Euro vs British Pound
| Buy | Sell | Spread |
| 0.85454 | 0.85435 | 19 |
Scenario
| Time frame | Day's Range |
| Recommendations | BUY |
| Entry Point | 0.8498 |
| Take Profit | 0.8690 |
| Stop Loss | 0.8448 |
| Support levels | 0.8409, 0.8448, 0.8545, 0.8690 |
Alternative scenario
| Recommendations | |
| Entry Point | |
| Take Profit | |
| Stop Loss | |
| Support levels |
The material published on this page is produced by the Claws&Horns Company jointly with LiteFinance and should not be considered as the provision of investment advice for the purposes of Directive 2014/65/EU; furthermore it has not been prepared in accordance with legal requirements designed to promote the independence of investment research and is not subject to any prohibition on dealing prior to the dissemination of such research.