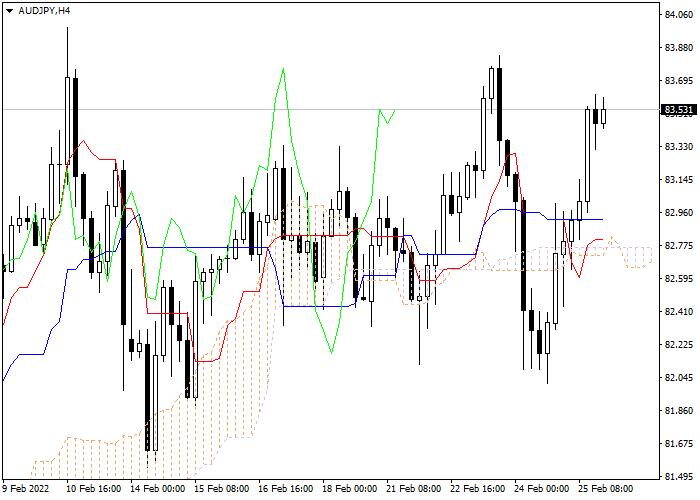
Let's look at the four-hour chart. Tenkan-sen line is below Kijun-sen, the lines are horizontal . Confirmative line Chikou Span is above the price chart, current cloud is ascending. The instrument is trading above Tenkan-sen and Kijun-sen lines; the Bullish trend is still strong. The closest support level is Kijun-sen line (82.91). One of the previous maximums of Chikou Span line is expected to be a resistance level (87.61).
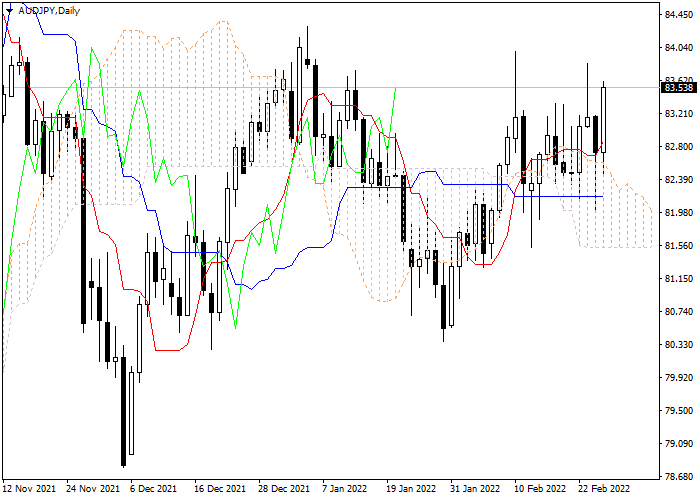
On the daily chart Tenkan-sen line is above Kijun-sen, the red line is directed upwards, while the blue one remains horizontal. Confirmative line Chikou Span is above the price chart, current cloud is ascending. The instrument has broken through the cloud and is still rising. The closest support level is the lower border of the cloud (81.51). The closest resistance level is Tenkan-sen line (85.23).
It is recommended to open long positions at current price with Take Profit at the level of previous maximum of Chikou Span (87.61) line and Stop Loss at the level of Kijun-sen line (82.91).
Australian Dollar vs Japanese Yen
| Comprar | Venta | Spread |
| 113.167 | 113.104 | 63 |
Escenario
| Timeframes | Rango diario |
| Recomendaciones | BUY |
| Punto de entrada | 83.55 |
| Take Profit | 87.61 |
| Stop Loss | 82.91 |
| Niveles clave | 81.51, 82.91, 85.23, 87.61 |
Escenario alternativo
| Recomendaciones | |
| Punto de entrada | |
| Take Profit | |
| Stop Loss | |
| Niveles clave |
Los materiales publicados en esta página son proporcionados por la compañía Claws&Horns en colaboración con LiteFinance exclusivamente con fines informativos y no debe interpretarse como consejo de inversión o asesoramiento a efectos de la Directiva 2014/65/EU. Además, estos materiales no se han preparado conforme a los requisitos legales destinados a promover la independencia de las investigaciones de inversiones y no están sujetos a ninguna prohibición de negociación previa a la difusión de dichas investigaciones.