At first glance, the yuan's appreciation and the S&P 500's rally to record highs should have supported the AUD/USD pair. However, gains in the technology sector have encouraged capital repatriation, while the renminbi's apparent strength may be masking underlying weakness. Let's examine these trends and develop a trading plan.
The article covers the following subjects:
Major Takeaways
- The odds of an RBA rate hike are falling.
- The yield spread is favoring the US dollar.
- China is going against the global trend.
- Short positions on the AUDUSD pair can be opened with a target of 0.6800.
Weekly Fundamental Forecast for Australian Dollar
The Australian dollar has gone from a beautiful swan to an ugly duckling—and this is the second time that transformation has occurred in 2026. The AUD/USD pair started the year strongly, supported by three consecutive RBA rate hikes. The mood then shifted as markets began to speculate that the tightening cycle was nearing its end. When the cycle resumed, the ussie embarked on another roller-coaster ride. Now, renewed expectations of an imminent end to monetary tightening are putting downward pressure on the currency, with the pair moving toward its July lows.
A slowdown in monthly consumer-price growth in August, from 0.5% to 0.2%, coupled with inflation holding steady at 3.6% YoY, has prompted derivatives markets to scale back expectations for further RBA tightening. The implied probability of a rate hike from the current 4.6% in November stands at 26%. For December, the figure is 54%. For the Fed, the corresponding probability in December is 86%. This divergence is allowing US Treasury yields to move closer to their Australian counterparts. This narrowing yield differential appears to be a key driver of the AUD/USD pair's recent decline.
Australia-US Bond Yield Spread
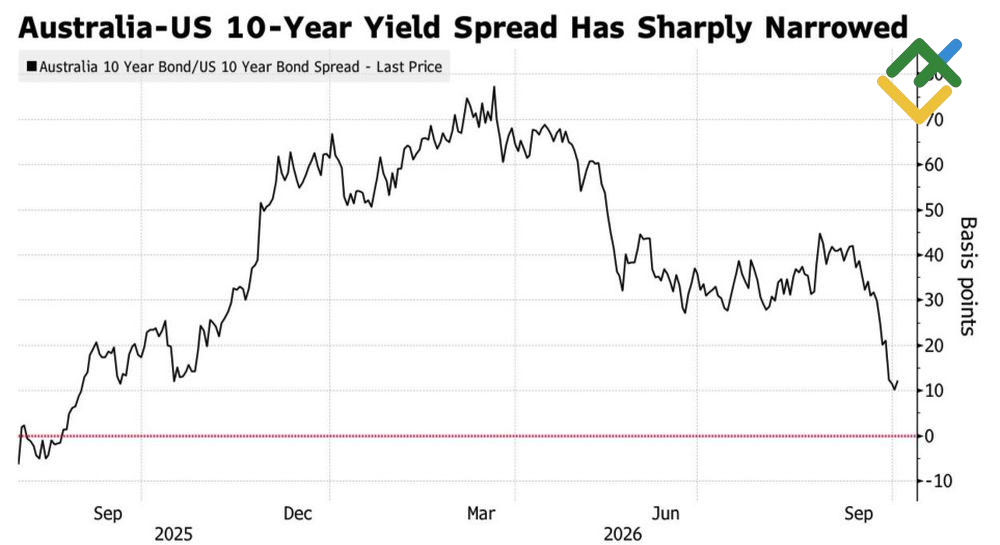
Source: Bloomberg.
The AUD/USD pair has traditionally been supported by rallies in US stock indices and strength in the Chinese yuan. This time, the usual tailwinds are providing little support: despite the S&P 500 reaching record highs and the renminbi continuing to appreciate, the Australian dollar remains under pressure.
In fact, both of these seemingly bullish drivers conceal significant headwinds. One factor behind the AUD/USD rally in the third quarter was capital flowing from the US to Australia, driven in part by concerns about returns on artificial intelligence investments. As the AI boom regained momentum in US equity markets, however, those flows reversed, with capital moving back toward the United States.
The yuan’s strength is also less supportive than it may appear. China's economic weakness—apart from the relative resilience of exports—along with the PBoC's asset-purchase programs and commercial banks’ substantial holdings of government bonds, sets the country apart from the global trend. Chinese bond yields continue to decline, while the yield spread relative to US Treasuries has widened to more than 370 basis points.
Government Bond Yields
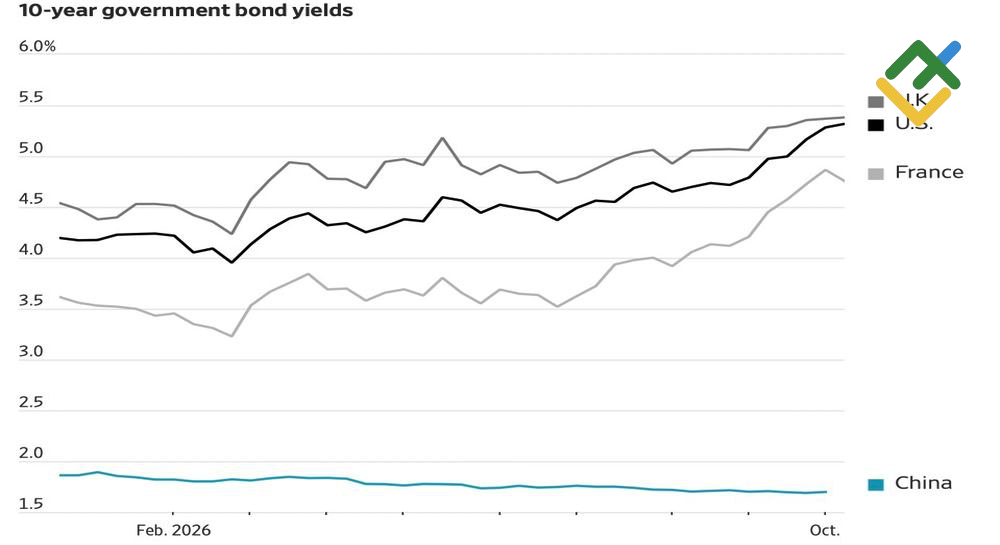
Source: Wall Street Journal.
This divergence in bond-market yields makes the renminbi a colossus with feet of clay. Investors recognize that Chinese authorities support its exchange rate, in part to limit the risk of capital outflows. AUD/USD bulls recognize this dynamic as well. The Australian dollar often trades as a proxy for the yuan, while China remains Australia’s largest export market.
As a result, the aussie's traditional sources of support are failing to deliver. At the same time, the divergence in monetary policy between Australia and the United States—and the resulting narrowing of the yield differential—is putting additional downward pressure on the Australian dollar.
Weekly Trading Plan for AUD/USD
Under these conditions, short positions in the AUD/USD opened earlier appear to have been well timed. The first of the two targets, at 0.6900 and 0.6800, has already been reached. The current pullback could provide an opportunity to open new short positions or add to existing ones, targeting the second level at 0.6800.
This forecast is based on the analysis of fundamental factors, including official statements from financial institutions and regulators, various geopolitical and economic developments, and statistical data. Historical market data are also considered.
Price chart of AUDUSD in real time mode

The content of this article reflects the author’s opinion and does not necessarily reflect the official position of LiteFinance broker. The material published on this page is provided for informational purposes only and should not be considered as the provision of investment advice for the purposes of Directive 2014/65/EU.
According to copyright law, this article is considered intellectual property, which includes a prohibition on copying and distributing it without consent.