Dear readers,
I've prepared a short-term forecast for Bitcoin, Ripple, and Ethereum based on Elliott Wave analysis.
The article covers the following subjects:
Major Takeaways
- BTCUSD: A bearish impulse wave is forming. Consider short positions with a Take Profit at 56,635.30.
- XRPUSD: The second half of a bearish impulse wave is unfolding. Consider short positions with a Take Profit at 0.731.
- ETHUSD: the price is declining within a downward wave that appears to be an impulse. Short positions can be considered with a Take Profit at 1,448.41.
Elliott Wave Analysis for Bitcoin
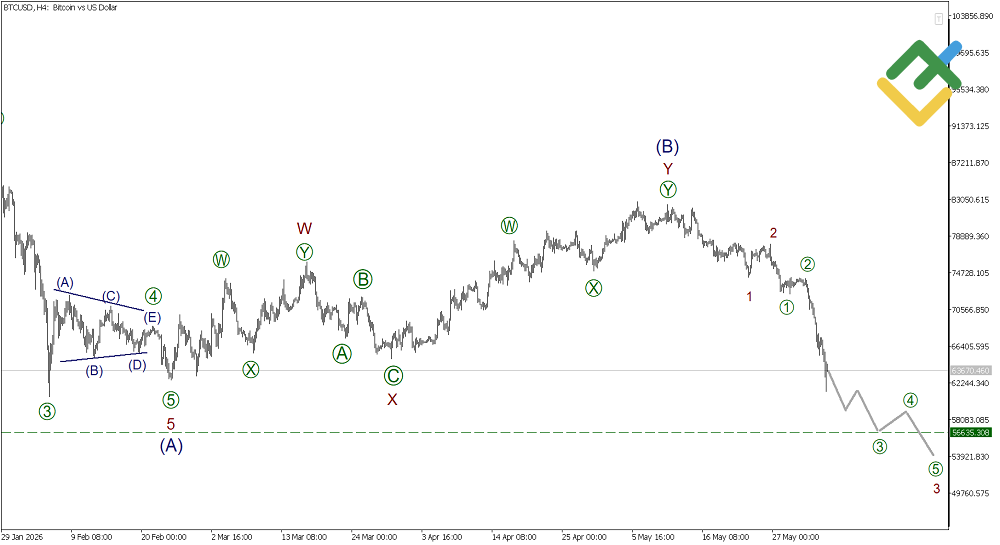
In the long term, Bitcoin is forming a large zigzag (A)-(B)-(C). Its first impulse wave (A) has formed. Correction (B) also appears to be complete. Wave (B) has taken the form of a double zigzag W-X-Y. Most likely, the latest section of the chart shows a decline within a bearish impulse wave. Its first two sub-waves, 1 and 2, have already formed. Sub-wave 3 is now unfolding. If this scenario is correct, the price may decline to 56,635.30 in the near term, after which a minor correction could develop in sub-wave [4].
Trading Plan for BTCUSD for Today:
Sell at 63,670.46, Take Profit: 56,635.30
Elliott Wave Analysis for Ripple
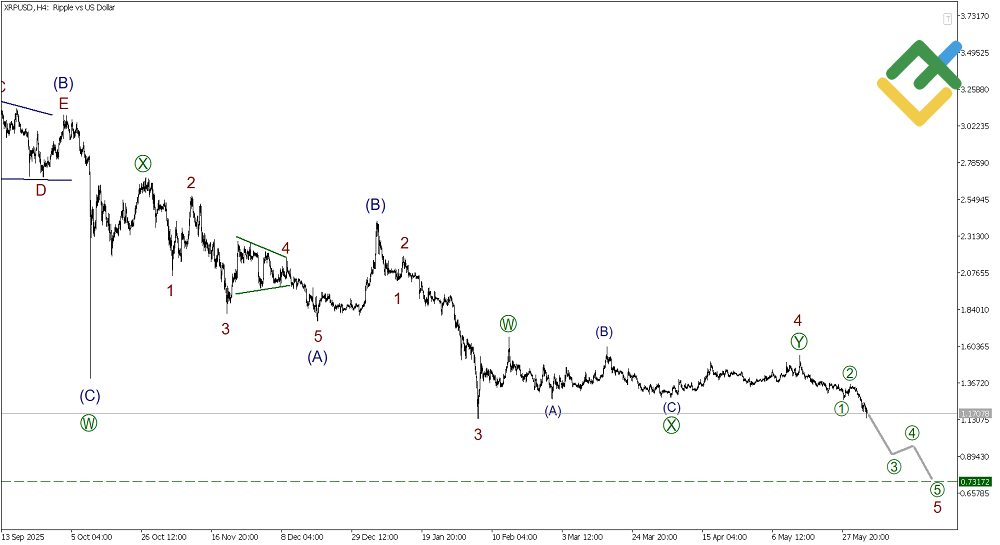
In the long term, XRPUSD is forming a large bullish impulse, within which correction (4) is unfolding as a double zigzag W-X-Y. The final wave Y is forming as a double zigzag [W]-[X]-[Y]. Within wave [Y], bearish impulse (C) is developing. Within impulse (C), correction 4 appears to have recently been completed in the form of a double zigzag. The price is currently declining within a bearish wave that appears to be an impulse. The downward movement in sub-waves [3]-[4]-[5] may continue to the 0.731 level.
Trading Plan for XRPUSD for Today:
Sell at 1.170, Take Profit: 0.731
Elliott Wave Analysis for Ethereum
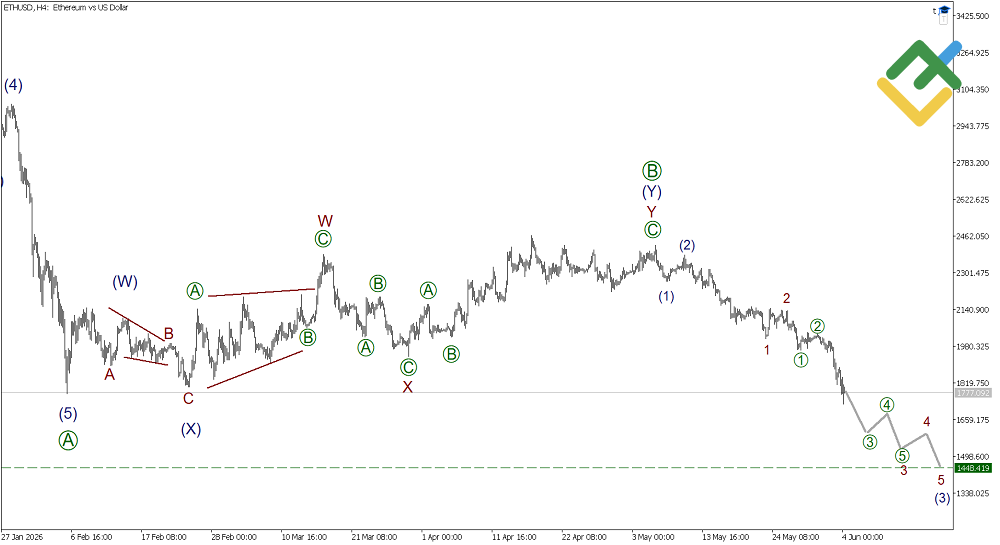
In the long term, ETHUSD is forming a large zigzag (A)-(B)-(C). Apparently, impulse (A) has been completed, and a complex correction (B) is currently forming as a triple zigzag W-X-Y-XX-Z. The final actionary wave Z of (B) may end as a zigzag [A]-[B]-[C]. Correction [B] may have been completed recently, likely as a double zigzag. The latest section of the chart suggests that a bearish impulse wave is developing. Its first two segments, sub-waves (1) and (2), have already been completed. Sub-wave (3) is currently unfolding. The price may decline to the 1,448.41 level.
Trading Plan for ETHUSD for Today:
Sell at 1,777.09, Take Profit: 1,448.41
If you want to learn more about classic wave analysis, check out our in-depth article on the Elliott Wave Theory.
P.S. Did you like my article? Share it in social networks: it will be the best "thank you" :)
Useful links:
- I recommend trying to trade with a reliable broker here. The system allows you to trade by yourself or copy successful traders from all across the globe.
- Use my promo code BLOG to get a 50% deposit bonus on the LiteFinance platform. Simply enter this code in the appropriate field when funding your trading account.
- Telegram chat for traders: https://t.me/litefinancebrokerchat. We are sharing the signals and trading experience.
- Telegram channel with high-quality analytics, Forex reviews, training articles, and other useful things for traders https://t.me/litefinance

The content of this article reflects the author’s opinion and does not necessarily reflect the official position of LiteFinance broker. The material published on this page is provided for informational purposes only and should not be considered as the provision of investment advice for the purposes of Directive 2014/65/EU.
According to copyright law, this article is considered intellectual property, which includes a prohibition on copying and distributing it without consent.