The USDCAD pair is a major currency pair in the Forex market, reflecting the economic health of the United States and Canada, the two largest trading partners. The pair's fluctuations reflect not only the difference in interest rates and economic indicators of the respective countries, but also the state of the world commodity markets, especially oil, as Canada is a major exporter of energy commodities.
This article assesses the key forecasts for the coming years, provides fundamental and technical analysis, and evaluates the impact of global factors on the USDCAD exchange rate.
The article covers the following subjects:
- Major Takeaways
- USDCAD Real-Time Market Status
- USDCAD Price Forecast for 2026 Based on Technical Analysis
- Analysts' USDCAD Price Projections for 2027
- Analysts' USDCAD Price Projections for 2028
- Analysts' USDCAD Price Projections for 2029
- Analysts' USDCAD Price Projections for 2030
- Analysts' USDCAD Price Projections up to 2050
- USDCAD Market Sentiment on Social Media
- USDCAD Price History
- USDCAD Price Fundamental Analysis
- More Facts About USDCAD
- How We Make Forecasts
- Conclusion: Is USDCAD a Good Investment?
- USDCAD Price Prediction FAQs
Major Takeaways
The current price of the USDCAD pair is CA$1.42196 as of 24.06.2026.
The USDCAD pair reached its all-time high of CA$1.5848 on 27.08.1998. The pair's all-time low of CA$1.1191 was recorded on 04.11.1991.
The USDCAD rate may fluctuate due to changes in the US–Canada trade balance.
The USDCAD rate will depend on global economic growth, central bank policies, and energy prices.
Historically, the Canadian dollar has strengthened during periods of increased demand for Canadian exports.
Most analysts believe that the USD/CAD pair will trade within a moderate range of CA$1.35–1.44 in 2026.
Forecasts for 2027 indicate a wide range from CA$1.29 to CA$1.44.
Estimates for 2028–2030 vary significantly. Some analysts predict a decline to CA$1.18–1.22, while others believe the pair could rise to CA$1.46 in 2028 and CA$1.45 in 2030. The most optimistic forecasts point to a surge to CA$1.49.
Forecasts through 2050 are approximate. Due to the fact that the asset is influenced by many unpredictable factors over the long term—such as decisions by the Federal Reserve and the Bank of Canada, inflation, commodity prices, US-Canada trade relations, and geopolitical risk—accurate forecasting is impossible.
USDCAD Real-Time Market Status
The USDCAD currency pair is trading at CA$1.42196 as of 24.06.2026.
When analyzing the USDCAD pair, it is essential to consider the impact of macroeconomic indicators. Key factors include the monetary policies of the Bank of Canada and the US Federal Reserve. Inflation indicators, particularly the core consumer price index (CPI), are also crucial to monitor. In addition, historical levels of support and resistance, along with the past year's price performance, should be taken into account for a comprehensive analysis.
Metric | Value |
Bank of Canada's overnight interest rate | 2.25% |
Core inflation, YoY | 2.1% |
All-time low | CA$1.1191 |
All-time high | CA$1.5848 |
Rate change over 12 months | +0.46% |
USDCAD Price Forecast for 2026 Based on Technical Analysis
The USD/CAD pair is trading in a broad consolidation range following a pullback from the 1.44–1.45 zone. The price is trading around 1.38 near the EMA21, EMA50, EMA100, and VWAP, meaning that neither buyers nor sellers have a distinct advantage in the market.
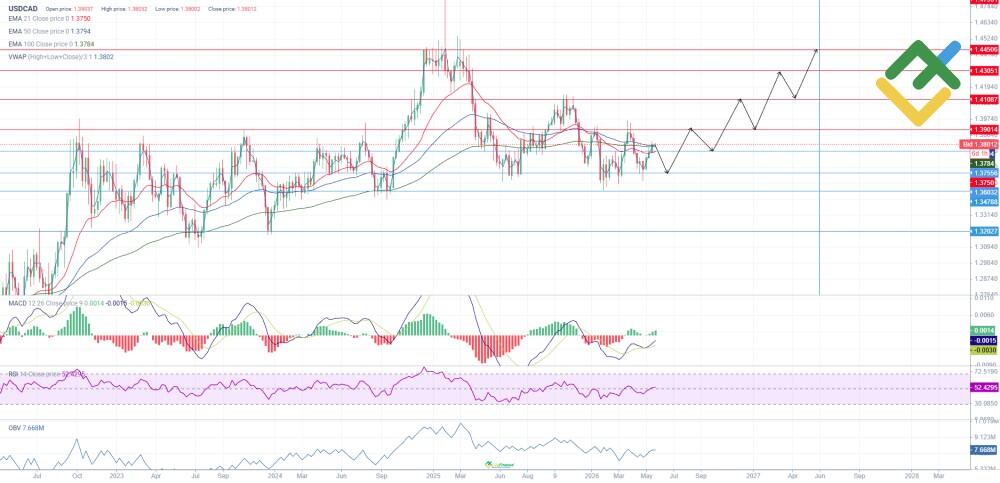
The nearest support level is at 1.37. Below that, key levels are at 1.36 and 1.34. Resistance levels are located at 1.39, 1.41, 1.43, and 1.44.
The moving averages have converged, confirming the consolidation phase. MACD is attempting to recover: the histogram remains slightly positive, though momentum is still weak. The RSI is near 52, reflecting a balanced market. The OBV has stabilized after a decline, which may signal weakening selling pressure.
A break above the 1.39 level would reinforce the recovery scenario, while a drop below 1.36 would bring bearish sentiment back.
Below is USDCAD's 12-month price forecast.
Month | Minimum, CA$ | Maximum, CA$ |
June 2026 | 1.37 | 1.38 |
July 2026 | 1.37 | 1.39 |
August 2026 | 1.38 | 1.39 |
September 2026 | 1.38 | 1.41 |
October 2026 | 1.39 | 1.40 |
November 2026 | 1.39 | 1.41 |
December 2026 | 1.41 | 1.42 |
January 2027 | 1.40 | 1.43 |
February 2027 | 1.41 | 1.43 |
March 2027 | 1.41 | 1.43 |
April 2027 | 1.42 | 1.43 |
May 2027 | 1.43 | 1.44 |
Long-Term Trading Plan for USDCAD for 2026
The market outlook for the USD/CAD pair remains neutral with a moderately bullish bias. The strategy for the coming months is to avoid opening positions in the middle of the range and instead wait for price movements at key levels.
The first entry point could appear on a rebound from the 1.36–1.37 zone, with the price returning above the VWAP and EMA21. A stronger signal will emerge after the price breaks through 1.39. In this case, the targets will be the 1.41 and 1.43 levels.
Profits can be taken partially at these resistance levels, while holding the rest of your positions open if the MACD strengthens and the OBV turns upward. In this scenario, the price will likely climb to the targets of 1.44–1.47.
If the price consolidates below 1.36, it is better to refrain from opening long positions, as the pair may then slide toward 1.34 and 1.32.
If the price pierces the 1.39 level and holds above the VWAP, the uptrend will be confirmed.
Analysts' USDCAD Price Projections for 2026
According to analysts, the USD/CAD pair will trade within a stable range in 2026, without any sharp swings. Forecasts suggest that periods of strengthening, pullbacks, and increased volatility are possible toward the end of the year.
LongForecast
Price range (CAD): 1.33–1.42.
LongForecast predicts that USD/CAD quotes will trade within the range of 1.33–1.42 in 2026. A correction is possible following the summer rally, and the exchange rate is likely to fall to 1.35 by December.
Month | Open, CA$ | Min–Max, CA$ | Close, CA$ |
June | 1.38 | 1.37–1.42 | 1.39 |
July | 1.39 | 1.34–1.39 | 1.36 |
August | 1.36 | 1.36–1.40 | 1.38 |
September | 1.38 | 1.37–1.41 | 1.39 |
October | 1.39 | 1.35–1.40 | 1.38 |
November | 1.38 | 1.33–1.38 | 1.35 |
December | 1.35 | 1.33–1.37 | 1.35 |
CoinCodex
Price range (CAD): 1.38–1.44.
According to CoinCodex, the USD/CAD is expected to strengthen by mid-2026. The average price in June is projected to be 1.40. Following an uptrend in the third quarter, a slight pullback is likely.
Month | Open, CA$ | Average, CA$ | Close, CA$ |
June | 1.38 | 1.40 | 1.42 |
July | 1.39 | 1.41 | 1.43 |
August | 1.39 | 1.40 | 1.42 |
September | 1.40 | 1.42 | 1.44 |
October | 1.40 | 1.42 | 1.44 |
November | 1.40 | 1.42 | 1.43 |
December | 1.38 | 1.39 | 1.42 |
WalletInvestor
Price range (CAD): 1.33–1.43.
WalletInvestor anticipates that the USD/CAD pair will move sideways in 2026. A slight decline is expected, with volatility remaining high. Short-term pullbacks and rebounds to the 1.38 level are possible throughout the year.
Month | Open, CA$ | Close, CA$ | Minimum, CA$ | Maximum, CA$ |
June | 1.38 | 1.38 | 1.33 | 1.43 |
July | 1.38 | 1.38 | 1.34 | 1.42 |
August | 1.38 | 1.38 | 1.34 | 1.42 |
September | 1.38 | 1.38 | 1.35 | 1.41 |
October | 1.38 | 1.38 | 1.33 | 1.43 |
November | 1.38 | 1.38 | 1.35 | 1.41 |
December | 1.38 | 1.38 | 1.34 | 1.42 |
Analysts' USDCAD Price Projections for 2027
According to analysts, following a moderate trend in 2026, the USD/CAD rate may shift to a more volatile trajectory. Forecasts suggest a weakening of the exchange rate in the summer and a recovery closer to December. The base-case scenario anticipates fluctuations without a clear trend, but with significant intraday volatility.
Note: The price ranges reflect the asset's expected volatility throughout the year. Lows and highs may not be shown in the summary tables.
WalletInvestor
Price range (CAD): 1.32–1.43.
WalletInvestor projects a sustainable trend with moderate volatility. A gradual decline is possible in the first half of the year, while the exchange rate may stabilize in the second half. The highest level is projected to be around 1.43, suggesting a temporary recovery in the US dollar.
Quarter | Minimum, CA$ | Average, CA$ | Maximum, CA$ |
Q1 | 1.33 | 1.38 | 1.43 |
Q2 | 1.32 | 1.38 | 1.43 |
Q3 | 1.32 | 1.37 | 1.42 |
Q4 | 1.32 | 1.37 | 1.43 |
CoinCodex
Price range (CAD): 1.35–1.44.
CoinCodex assumes moderate growth for USD/CAD quotes by the end of 2027. Following weak performance in the summer, the pair may strengthen in the fall. Volatility is likely to increase in the fourth quarter, when the average price is expected to reach 1.42.
Quarter | Minimum, CA$ | Average, CA$ | Maximum, CA$ |
Q1 | 1.37 | 1.38 | 1.41 |
Q2 | 1.35 | 1.38 | 1.41 |
Q3 | 1.36 | 1.38 | 1.41 |
Q4 | 1.39 | 1.42 | 1.44 |
LongForecast
Price range (CAD): 1.29–1.41.
LongForecast suggests that the USD/CAD pair will decline in the third quarter of 2027. After weakening in the summer, the pair may recover toward the end of the year. Volatility will likely remain high.
Quarter | Minimum, CA$ | Average, CA$ | Maximum, CA$ |
Q1 | 1.34 | 1.36 | 1.40 |
Q2 | 1.35 | 1.38 | 1.41 |
Q3 | 1.29 | 1.32 | 1.37 |
Q4 | 1.31 | 1.35 | 1.39 |
Analysts' USDCAD Price Projections for 2028
The USD/CAD is expected to trade within a wide range in 2028. Analysts anticipate a strengthening of the exchange rate in the spring, a noticeable decline in the summer, and a return of bullish sentiment toward the end of the year.
WalletInvestor
Price range (CAD): 1.25–1.38.
WalletInvestor suggests a moderate decline in the USD/CAD rate in 2028. After reaching higher levels in the first quarter, the currency pair is likely to weaken in the second and third quarters. By the end of the year, it is likely to stabilize somewhat, though volatility is expected to persist.
Quarter | Minimum, CA$ | Average, CA$ | Maximum, CA$ |
Q1 | 1.27 | 1.32 | 1.38 |
Q2 | 1.25 | 1.30 | 1.36 |
Q3 | 1.25 | 1.29 | 1.36 |
Q4 | 1.26 | 1.31 | 1.37 |
CoinCodex
Price range (CAD): 1.28–1.46.
CoinCodex expects the USD/CAD pair to rise in the first half of the year. It may peak in the second quarter, after which the price may drop sharply. A recovery is likely in the fourth quarter, but the price is not expected to return to its May highs.
Quarter | Minimum, CA$ | Average, CA$ | Maximum, CA$ |
Q1 | 1.38 | 1.40 | 1.44 |
Q2 | 1.38 | 1.42 | 1.46 |
Q3 | 1.28 | 1.33 | 1.38 |
Q4 | 1.32 | 1.34 | 1.37 |
LongForecast
Price range (CAD): 1.35–1.46.
LongForecast estimates that the USD/CAD will follow a more stable trend in 2028. The range remains wide, but average quarterly values are expected to stay above 1.39. By the fourth quarter, the peak price might hit 1.46, though volatility is expected to persist.
Quarter | Minimum, CA$ | Average, CA$ | Maximum, CA$ |
Q1 | 1.36 | 1.40 | 1.43 |
Q2 | 1.36 | 1.39 | 1.42 |
Q3 | 1.38 | 1.41 | 1.44 |
Q4 | 1.35 | 1.41 | 1.46 |
Analysts' USDCAD Price Projections for 2029
Demand for the USD/CAD may pick up in 2029. Forecasts suggest the pair will weaken at the start of the year, followed by a possible gradual recovery. The most significant price movements are likely to occur toward the fourth quarter, with market volatility remaining high.
WalletInvestor
Price range (CAD): 1.18–1.34.
WalletInvestor anticipates weak performance for the USDCAD pair in the first half of 2029. The price is expected to bottom out in the spring, after which a gradual recovery is likely. By the end of the year, the exchange rate could strengthen to 1.30 amid moderate volatility.
Quarter | Minimum, CA$ | Average, CA$ | Maximum, CA$ |
Q1 | 1.21 | 1.27 | 1.33 |
Q2 | 1.18 | 1.22 | 1.28 |
Q3 | 1.17 | 1.22 | 1.27 |
Q4 | 1.18 | 1.24 | 1.34 |
CoinCodex
Price range (CAD): 1.30 – 1.45.
CoinCodex predicts a recovery for the USD/CAD following a sluggish start to the year. Average values are expected to rise gradually in the second half of the year, with the price peaking at 1.45 in December. Increased volatility is also possible toward the end of the year.
Quarter | Minimum, CA$ | Average, CA$ | Maximum, CA$ |
Q1 | 1.30 | 1.34 | 1.39 |
Q2 | 1.33 | 1.37 | 1.42 |
Q3 | 1.36 | 1.38 | 1.41 |
Q4 | 1.36 | 1.40 | 1.45 |
LongForecast
Price range (CAD): 1.37–1.47.
LongForecast indicates that the USD/CAD pair may move more steadily than in previous years. After some volatility in the first half of the year, the exchange rate may strengthen by the fall. Peak values are projected for the first and third quarters, with trading likely to remain within a wide range.
Quarter | Minimum, CA$ | Average, CA$ | Maximum, CA$ |
Q1 | 1.37 | 1.42 | 1.47 |
Q2 | 1.38 | 1.42 | 1.46 |
Q3 | 1.38 | 1.41 | 1.46 |
Q4 | 1.38 | 1.41 | 1.44 |
Analysts' USDCAD Price Projections for 2030
As the new decade begins, forecasts for USD/CAD are becoming more cautious: some predict a gradual decline, while others suggest the pair will remain stable above 1.40. The focus remains on quarterly fluctuations, a possible strengthening of the US dollar in the spring, and a weakening of the pair toward the end of the year.
WalletInvestor
Price range (CAD): 1.18–1.38.
WalletInvestor anticipates a decline in the USD/CAD pair throughout 2030. After reaching higher levels in the first quarter, the price may gradually slide. Elevated volatility will likely persist, but quarterly highs are expected to decrease.
Quarter | Minimum, CA$ | Average, CA$ | Maximum, CA$ |
Q1 | 1.26 | 1.31 | 1.38 |
Q2 | 1.22 | 1.29 | 1.36 |
Q3 | 1.20 | 1.25 | 1.32 |
Q4 | 1.18 | 1.23 | 1.28 |
CoinCodex
Price range (CAD): 1.38–1.45.
CoinCodex expects a more stable outlook for the USD/CAD pair. In the first half of the year, the price will likely hover around 1.41–1.42 before declining slightly. Volatility will remain moderate, with no sharp movement outside the range.
Quarter | Minimum, CA$ | Average, CA$ | Maximum, CA$ |
Q1 | 1.39 | 1.41 | 1.45 |
Q2 | 1.39 | 1.42 | 1.44 |
Q3 | 1.38 | 1.40 | 1.42 |
Q4 | 1.38 | 1.40 | 1.42 |
Analysts' USDCAD Price Projections up to 2050
Long-term forecasts for USDCAD should be viewed more as a reference point than as a precise scenario. The pair's performance can be driven by decisions from the Federal Reserve and the Bank of Canada, inflation rates, the state of the US and Canadian economies, conditions in commodity markets, and demand for the US dollar.
The longer the forecast horizon, the greater the impact of external risks. The foreign exchange market can respond sharply to political crises, trade restrictions, changes in global supply chains, and international conflicts. Technological changes and the transformation of financial infrastructure may also have further impacts.
Between 2040 and 2050, more profound structural changes cannot be ruled out: the growing role of digital currencies, a restructuring of global reserves, and the emergence of new international trade rules.
For this reason, the long-term forecast for the USD/CAD pair is best viewed as a general market development scenario rather than a solid benchmark for trading decisions.
USDCAD Market Sentiment on Social Media
Media sentiment can help provide insight into how market participants view the USD/CAD pair beyond technical charts. Traders' comments and posts reinforce market expectations, especially when they align with key levels and the pair's current price action.
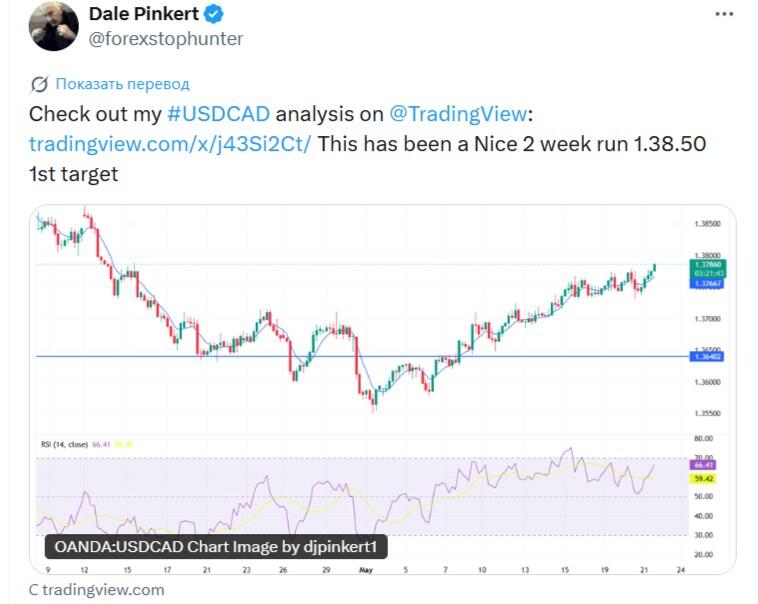
For example, on the social media platform X, Dale Pinkert notes a strong two-week rally in USD/CAD quotes and sets a target of 1.38. This assessment appears moderately bullish: the price has already demonstrated an upward momentum, which could sustain bullish demand.
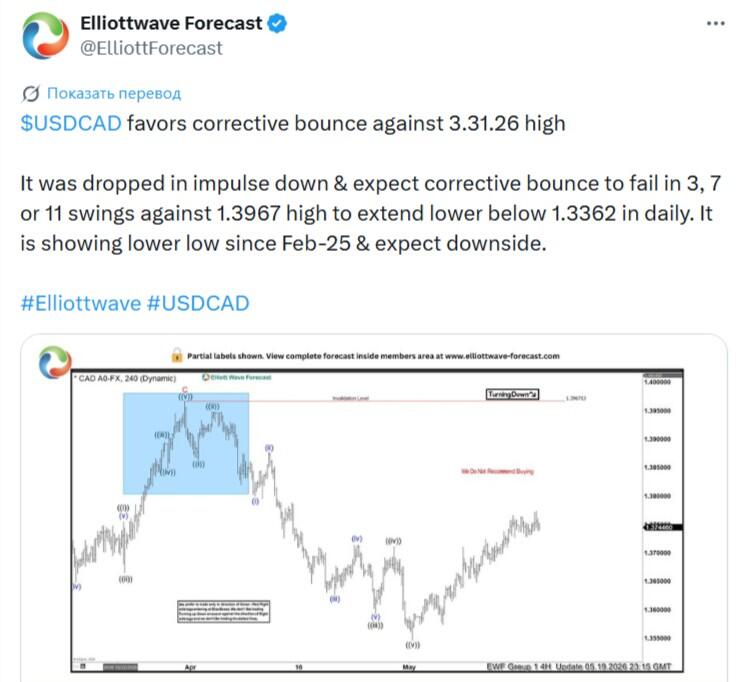
The Elliott Wave Forecast views the current rally as a corrective rebound and expects it to end below the 1.39 resistance level. Sentiment remains cautiously bearish, as the main focus is on the risk of a decline below 1.33.
Overall, sentiment surrounding the USD/CAD pair remains mixed: short-term optimism is tempered by expectations of a deeper correction, heightening investor caution in the coming weeks.
USDCAD Price History
The USDCAD pair reached its all-time high of CA$1.5848 on 27.08.1998.
The lowest price of the USDCAD pair was recorded on 04.11.1991 and reached CA$1.1191.
Below is a chart showing the USDCAD pair's performance over the last ten years. In this connection, it is important to evaluate historical data to make predictions as accurate as possible.
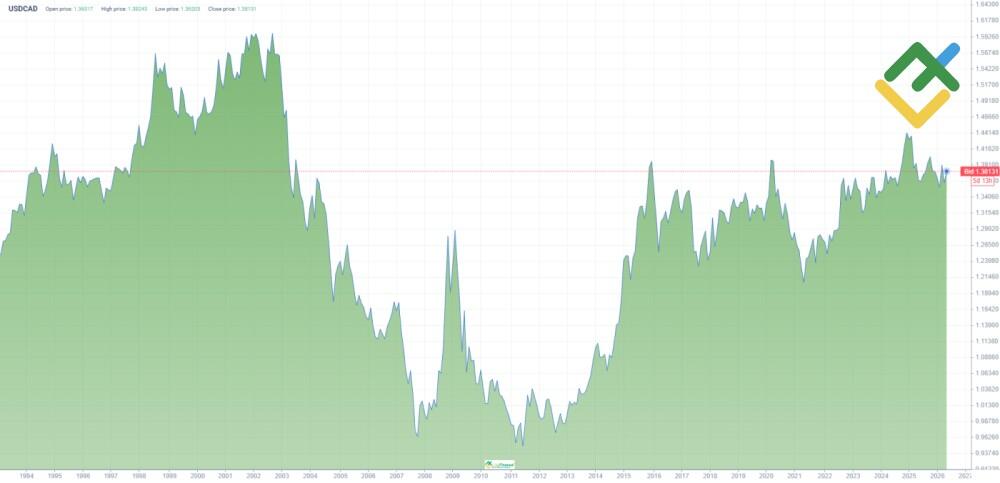
As you can see on the chart, the USDCAD currency pair has experienced significant fluctuations, reflecting changes in the US and Canadian economies. In the early 1990s, the pair traded between CA$1.15 and CA$1.40, but the Canadian dollar strengthened in 2002. The USDCAD has since declined to CA$1.10, driven by rising oil prices and a robust Canadian economy.
The global financial crisis of 2008 led to a significant shift in the investment landscape, with investors seeking out safe-haven assets. As a result, the Canadian dollar weakened significantly, and the USDCAD rate surged above CA$1.30. In the following years, the price of the pair fluctuated between CA$0.95 and CA$1.10, responding to shifts in commodity markets.
Between 2015 and 2020, USDCAD quotes rose steadily, reaching CA$1.45 amid the pandemic and falling oil prices. Between 2022 and 2023, the pair traded within the range of CA$1.32–1.40.
Between January and October 2024, the USDCAD pair fluctuated between CA$1.3287 and CA$1.3946. In November 2024, the rate began to rise, reaching CA$1.4467 by the end of the year.
In 2025, USD/CAD was highly volatile, reacting to changes in monetary policy in both countries and fluctuations in oil prices. During the first half of the year, the pair declined to CA$1.3539 as the Canadian dollar was strengthening. Bulls later attempted to regain control, pushing the price up to CA$1.4140 in November, but by the end of December, USD/CAD had fallen again to CA$1.3642.
Between January and May 2026, the USD/CAD pair fluctuated, trading within a wide range. In January, the price fell to CA$1.3481, but by the end of March, it had recovered to CA$1.3966. In April, the price corrected to CA$1.3660, and by May 25, it had risen to CA$1.3804, indicating that demand for the US dollar has recovered.
USDCAD Price Fundamental Analysis
A fundamental analysis of the USDCAD rate involves analyzing the macroeconomic factors that drive the currency pair's quotes. The primary factors influencing the rate's fluctuations include the monetary policy of the US Federal Reserve and the Bank of Canada, the economic conditions of both countries, and oil prices.
What Factors Affect the USDCAD Pair?
Fed and BoC monetary policy. Interest rate differentials affect the attractiveness of each currency.
Oil prices. Canada is a major exporter of oil, an increase in its value strengthens the CAD.
Economic data. GDP, unemployment rate, inflation, and trade balance data affect the exchange rate.
Recession risks and geopolitical factors. Economic crises and conflicts prompt investors to turn to safe-haven assets.
Bond yield spread. Investors prefer currencies with higher government bond yields.
Investor sentiment and capital flows. Investment inflows into the US or Canada have a positive effect on their currencies.
More Facts About USDCAD
USDCAD is a major currency pair in the Forex market, offering high liquidity due to the high volume of trade between the United States and Canada.
The Canadian dollar, often referred to as the "Loonie," has historically been correlated with oil prices. As Canada is one of the world's leading energy exporters, rising oil prices tend to strengthen the Canadian dollar, while falling prices often weaken it.
Investors, traders, and central banks use the USDCAD pair to assess macroeconomic trends and make monetary policy decisions. The pair is also in demand by exporters and importers of both countries and international investors seeking to hedge currency risks.
The fluctuations in the USDCAD rate are attributed to economic data, the policies of the Fed and the Bank of Canada, and global economic conditions. Due to its high volatility, this pair remains popular among traders and investors.
Advantages and Disadvantages of Investing in USDCAD
Investing in the USDCAD presents a range of opportunities for traders and investors. Its high liquidity and ease of forecasting make this pair attractive for trading. However, it is essential to remember that there are inherent risks.
Advantages
High liquidity. The USDCAD pair boasts high liquidity, making it a popular choice for traders and investors. The pair's trading volume is exceptionally high, and it is traded on one of the world's largest Forex markets, ensuring minimal spreads and fast order execution.
Predictability. The USDCAD rate is closely linked to oil prices, as well as to the monetary policy of the Fed and the BoC.
Hedging opportunities. The pair is popular among traders and investors who use it to protect against currency risks in international transactions and investments.
Accessibility. The currency pair is available on all major trading platforms, and trading costs remain low due to high liquidity.
Suitable for various strategies. The versatility of the USDCAD pair makes it suitable for a range of strategies, including day trading, scalping, and long-term investments.
Disadvantages
Dependence on oil prices. The Canadian dollar's value is closely tied to the global price of oil. Significant fluctuations in the price of oil can lead to high volatility.
Macroeconomic risks. Given that Canada has an export-oriented economy, the exchange rate is influenced by the global economy, trade agreements, and tariffs.
Volatility risk. Market news, central bank announcements, or sudden changes in oil prices may affect the exchange rate significantly.
Political factors. Trade disputes between Canada and the US, as well as geopolitical uncertainty, can also impact the major currency pair.
Interest rates. Changes in the monetary policy of the Bank of Canada and the Fed can cause sharp movements of USDCAD quotes, which can complicate long-term trading.
How We Make Forecasts
Forecasting the USDCAD rate requires a thorough analysis of short-, medium-, and long-term factors. Our approach integrates technical and fundamental analysis.
Short-term forecasts up to three months are based on technical analysis, including support and resistance levels, candlestick patterns, and indicators such as the RSI, MACD, and Bollinger Bands. In addition, we take into account news, macroeconomic statistics from the US and Canada, and oil market volatility.
Medium-term forecasts from 3 months to a year include an assessment of the monetary policy of the US Federal Reserve and the Bank of Canada, inflation rates, GDP growth, employment and trade balance data. The impact of oil prices and commodity markets is also analyzed.
Long-term forecasts extend over a period of one year or more and are based on estimates of economic growth, demographic trends, changes in trade agreements between the US and Canada, and global currency market trends.
Conclusion: Is USDCAD a Good Investment?
Whether USD/CAD is a good investment is a complex question, and the answer depends on an investor's individual goals, risk tolerance, and time horizon. For short-term speculation, the pair may be attractive due to its high volatility. However, long-term investors should carefully weigh all relevant factors before trading this instrument, including economic conditions in both countries, geopolitical risks, oil price forecasts, and central bank decisions.
Forecasts are not guarantees, and actual price movements can differ significantly. Portfolio diversification and prudent risk management are key elements of successful investing in any currency pair, including USD/CAD. Investing in USD/CAD may also form part of a hedging strategy against commodity market risks.
USDCAD Price Prediction FAQs
The current price of the USDCAD pair is CA$1.42196 as of 24.06.2026.
The USD/CAD pair is expected to trade within a moderate range in 2026. Estimates suggest a range of 1.38 to 1.44, with periods of US dollar strength and possible pullbacks toward the end of the year.
It depends on the macroeconomic situation. If the Fed continues to tighten monetary policy, the US dollar may strengthen, and one may consider USDCAD purchases. However, if oil prices rise, the Canadian dollar will strengthen, which makes the pair attractive for selling.
The Canadian dollar could strengthen if the Bank of Canada raises rates or oil prices rise, as the country's economy is highly dependent on its exports. However, if the Fed continues its aggressive monetary policy, the US dollar will remain strong, limiting the CAD's upside potential.
USDCAD quotes are influenced by several key factors, including the interest rate differential between the Fed and the BoC, oil prices, GDP, inflation, employment rates, geopolitical landscape, and global financial markets.
The pair may fluctuate following interest rate decisions by the Fed and the Bank of Canada, inflation, GDP, employment data releases, and oil price fluctuations. Additionally, the USDCAD rate is influenced by political events, such as elections or shifts in trade relations between Canada and the USA.
The USDCAD pair may drop due to rising oil prices, as the Canadian dollar strengthens when crude becomes more expensive. The decline may be caused by the Bank of Canada's tighter policy, improved economic indicators, or lower growth rates of the US economy.
Price chart of USDCAD in real time mode
The content of this article reflects the author’s opinion and does not necessarily reflect the official position of LiteFinance broker. The material published on this page is provided for informational purposes only and should not be considered as the provision of investment advice for the purposes of Directive 2014/65/EU.
According to copyright law, this article is considered intellectual property, which includes a prohibition on copying and distributing it without consent.