Arrow indicators for binary options are the tools for “the lazy”. In the Forex charts they indicate with arrows the potential points of the market entering. Green colour means the opportunity to open a long position, red colour - a short one. A trader’s task is to be close to the terminal and when the signal appears decide whether to follow it or not.
The article covers the following subjects:
Advantages of Forex arrow trend indicators
- Arrow Indicators are combined indicators being based on several tools. They are usually based on classical basic indicators such as MA, RSI, MACD, Bollinger bands, stochastic etc. A trader doesn’t need to put Forex charts several lines and adjust each indicator separately. Arrow Indicators are already conveniently combined and have simplified settings.
- They are visually convenient and reduce a trader’s psychological and eye strain.
Disadvantages of Forex arrow trend indicators
- Slippages and re-paintings. The indicators can hardly be implemented in scalping strategies. Problems with quotations supply, price noise, indicators lag; all these factors can cause an indicator to repaint signals and as a result, an opened position will be loss-making.
- The indicators are better to be used in medium and long-term trading in H1 time frames.
- The fundamental factors need to be observed when applying the indicators.
How to choose a good Forex arrow trend indicator
- It is better to choose the indicator according to a particular strategy. There are no versatile arrow indicators. One gives more precise signals in flat trading, another - in trend trading and the other one -in long-term trading.
- You should test it on demo account in at least 100 transactions (the number depends on the signal appearing frequency). And the efficiency shouldn’t be less than 70% of successful signals.
- The indicator should have an open-source software for a trader to understand its working principle and make any corrections if necessary.
Further I will give as an example two arrow indicators strategies which can be used even by novice traders. You can also download the indicators for MT4 following the links (or find them on your own on the Internet). To install the template, you need to go to “File” menu, choose the section “Data catalogue” and move the template to the “Templates” folder, move the indicators to "MQL4" - "Indicators" folder.
1. Sidus
Combined indicator Sidus 2v indicates the points of entering by arrows; the red one is for sell position, the green one is for buy. The indicator is based on two popular tools, classical RSI and EMA (exponential moving average). Sidus gives buy signals when fast EMA is above slow EMA, RSI is above level 50. And vice versa, the short position should be opened when RSI is below 50 and fast-moving is below slow one.
Do not trade using this strategy at the moment of the news release, choose the time frame not less than H1, H4 is better, apply the strategy to the EUR/USD currency pair. Best indicator settings are fast EMA period -14, slow EMA period -21, RSI period - 14. The template can be downloaded here.
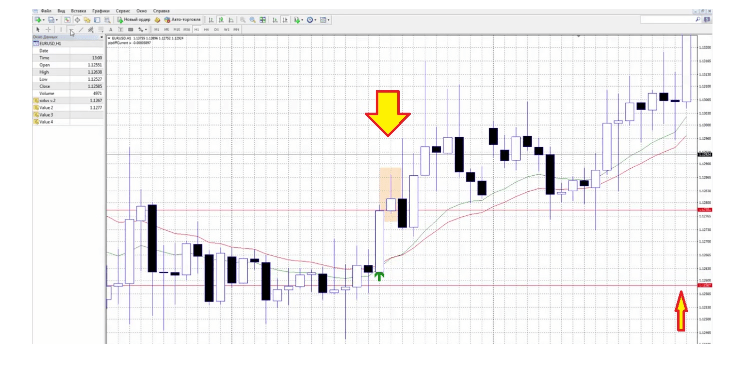
Opening a long position:
- When Sidus paints a green arrow we open a long position on the next candlestick.
- We set stop loss fixed at 20 points.
- When profit reaches 15 points we move to stop loss to the transaction opening point (breakeven) and close 50 % of the transaction. The remaining position should be insured by trailing stop at the distance of 15 points.
To use trailing stop you need to have VPS-server, as when the connection is lost the trailing stop doesn’t work.
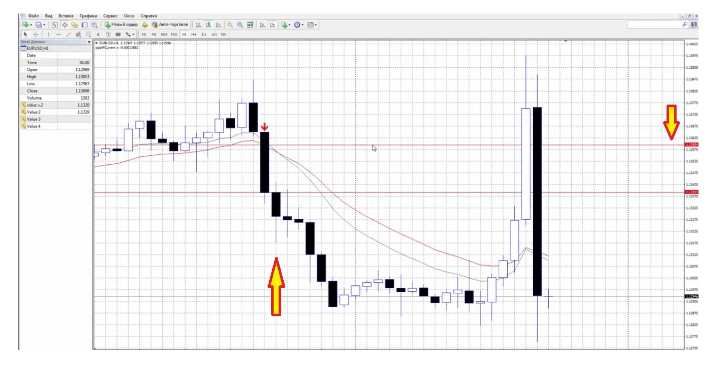
Sell position is opened under the same conditions when a red arrow appears.
2. Dot entering / Dots signals
Forex arrow trend indicator Dots signals a successful position to a trader not by arrows but by dots, but the essence is the same. Signals are formed on the base of price changing cosine. The tools advantage is extensive use; time frame from M15 (conditions flexible enough for strategies with different time frames), and currency pairs are all volatile pairs (from euro and dollar to Swiss franc).
Dots parameters:
- Length (indicator range) - 10;
- AppliedPrice (the price type for using in calculations) - 0;
- Filter - 0;
- Deviation (vertical shift of the indicator) - 0;
- Shift (horizontal shift of the indicator) - 0.
In different market conditions the indicator’s parameters can be changed providing that it has been tested on demo or cent account before. The template can be downloaded here.
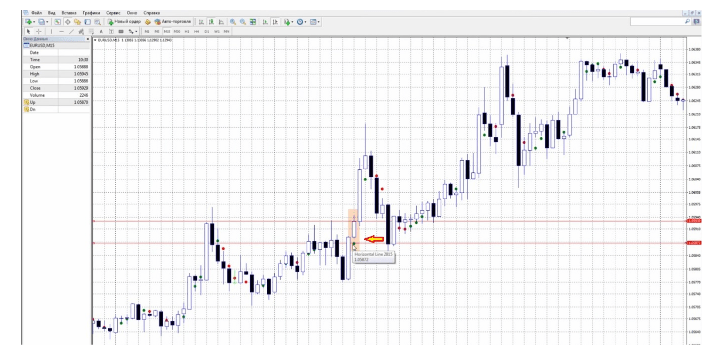
Opening a long position:
- The indicator paints a green dot which is above the rising candlestick’s minimum value. The distance between the minimum and the dot is estimated visually (the less the better). Open the position on the next candlestick.
- Stop-loss is set either at the minimum value of the previous candle or at the level of the green signal (up to 10 points).
- Set trailing stop at the distance of 5 points and leave the market at it.
Sell transaction is opened in the same way, but under the opposite conditions; the indicator paints a red dot above the falling candlestick’s maximum.
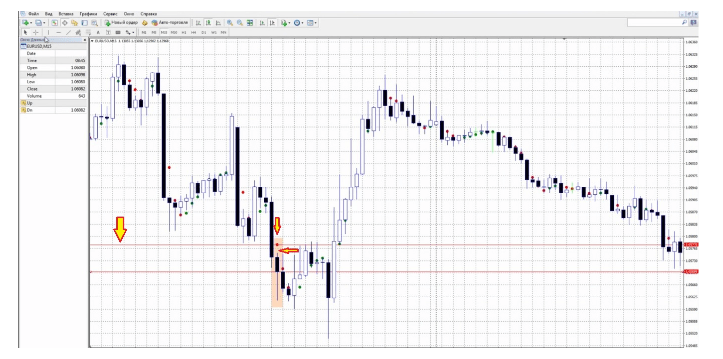
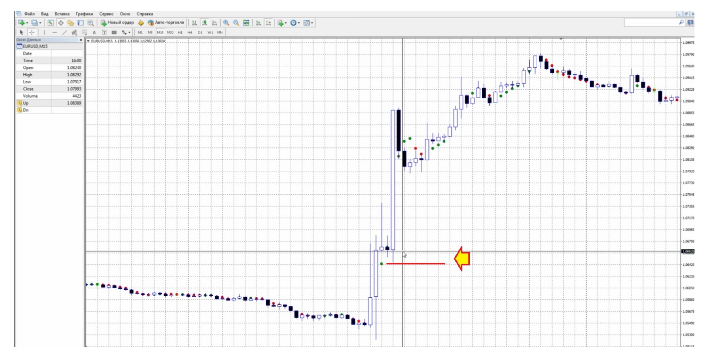
If in the Forex chart the distance between the candlestick’s maximum and the red dot visually seems too long in comparison to the previous periods, I don’t recommend to open the position. For instance, in the previous examples the distance was of about 2 points, but in the picture below the distance is of about 20 points.
The advantage of this indicator is that one can build numerous strategies in the markets with different volatility. But if the volatility is not a market’s feature or has a fundamental reason, the position can’t be opened. The indicator is versatile and proves to be 70% effective (that is, the number of closed at stop-loss transactions is insignificant).
Download templates and indicators, test them and express your opinion in comments.
P.S. Did you like my article? Share it in social networks: it will be the best "thank you" :)
Useful links:
- I recommend trying to trade with a reliable broker here. The system allows you to trade by yourself or copy successful traders from all across the globe.
- Use my promo code BLOG to get a 50% deposit bonus on the LiteFinance platform. Simply enter this code in the appropriate field when funding your trading account.
- Telegram chat for traders: https://t.me/litefinancebrokerchat. We are sharing the signals and trading experience.
- Telegram channel with high-quality analytics, Forex reviews, training articles, and other useful things for traders https://t.me/litefinance

The content of this article reflects the author’s opinion and does not necessarily reflect the official position of LiteFinance broker. The material published on this page is provided for informational purposes only and should not be considered as the provision of investment advice for the purposes of Directive 2014/65/EU.
According to copyright law, this article is considered intellectual property, which includes a prohibition on copying and distributing it without consent.