

For more than a decade, Bitcoin's halving-driven cycles have shaped the crypto market, reducing BTC supply and fueling periods of euphoria followed by sharp corrections. Today, however, the landscape is changing. Institutional investors, macroeconomic forces, and spot Bitcoin ETFs are transforming market dynamics, making historical patterns less reliable. Investors who continue to cling to old patterns risk missing the new reality.
Let's examine how the four-year pattern is evolving into a more complex, mature model and what to expect from the 2028 halving.
The article covers the following subjects:
- Major Takeaways
- Understanding Bitcoin Market Cycles and Four-Year Halving Pattern
- Technical Fundamentals of Bitcoin Halving
- Historical Bitcoin Halving Events and Price Impact
- Supply and Demand Dynamics Around Halving
- Bitcoin's Correlation with Traditional Markets
- Mainstream Adoption and Market Impact
- Conclusion
- Bitcoin Cycle FAQs
Major Takeaways
Historically, Bitcoin has followed four-year cycles linked to halvings—scheduled events that reduce the supply of new coins entering circulation.
By cutting miners' rewards in half, halvings create scarcity and have traditionally acted as catalysts for bull markets.
A typical crypto 4-year cycle consists of accumulation, expansion, euphoria, and correction. Today, these phases are becoming less distinct as market dynamics evolve.
Unlike previous cycles, the 2024 halving did not spark an immediate rally. Bitcoin reached a new all-time high before the event and then entered a correction.
Institutional inflows and Bitcoin's growing correlation with traditional financial markets now have a greater impact on price action than programmed scarcity alone.
The 2028 halving could still serve as a catalyst for the next bull run, but historical patterns are no longer as reliable as they once were.
Understanding how Bitcoin's cycles evolve can help avoid emotional decisions and adapt your Bitcoin investment strategy to current market conditions, for example, when developing your DCA strategy, taking into account your risk profile and capital size.
Understanding Bitcoin Market Cycles and Four-Year Halving Pattern
For over a decade, the crypto market has evolved alongside halving events. Every 210,000 blocks—or roughly once every four years—the reward for miners was halved, reducing the supply of new BTC and creating a controllable scarcity. As supply decreased while demand remained high, the price rose. This is how the classic Bitcoin cycle chart took shape: accumulation, rapid growth, euphoria, and a subsequent crash.
The first halving occurred in 2012. It reduced the reward per block from 50 to 25 BTC and heralded one of the most remarkable bull markets. Subsequent halvings in 2016 and 2020 also preceded new all-time highs.
However, this cycle has changed. Institutional investments via ETFs, Fed decisions, increased regulation, and global liquidity flows exert as much influence on the market as the mathematically limited supply. The 4-year crypto cycle is gradually shifting from a rigid pattern to just one of many factors determining market momentum.
While understanding the basic principles remains important, investors now need to consider new forces altering market behavior.
Technical Fundamentals of Bitcoin Halving
Halving is an algorithmic mechanism designed to limit inflation, built into the Bitcoin protocol by Satoshi Nakamoto. After the next halving in 2028, the block reward will decrease from 3.125 to 1.5625 BTC.
The difficulty adjustment mechanism maintains an average block time of approximately ten minutes. It ensures predictability of issuance through 2140 and caps the total supply at 21 million coins. This is why Bitcoin is often viewed as a scarce digital asset. Unlike fiat currencies, whose supply can fluctuate due to decisions by central banks and government bodies, Bitcoin's issuance is predetermined by the protocol's rules.
Network security deserves special attention. The higher the hash rate and the more stable the mining economy, the more difficult it is for the network to be attacked, reinforcing confidence in its resilience. However, even a high level of security does not shield Bitcoin from significant price volatility or broader market downturns.
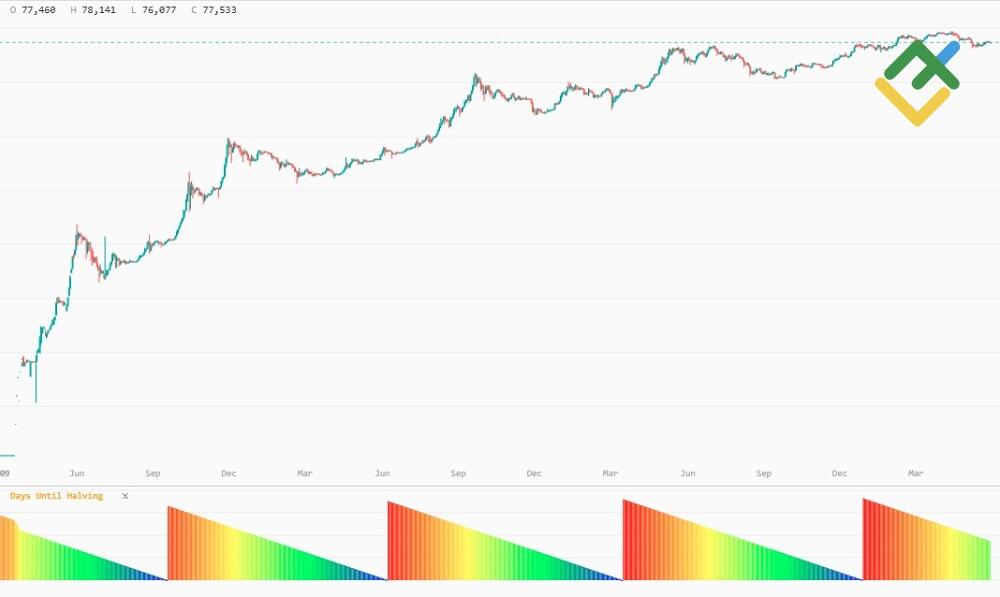
A graphical illustration of Bitcoin's cycles
Historical Bitcoin Halving Events and Price Impact
Each Bitcoin halving has historically been followed by a recognizable market cycle, often viewed as a classic illustration of how the asset responds to supply reductions. However, between 2024 and 2026, these phases have become less distinct, prompting analysts to reassess earlier cycle-based models.
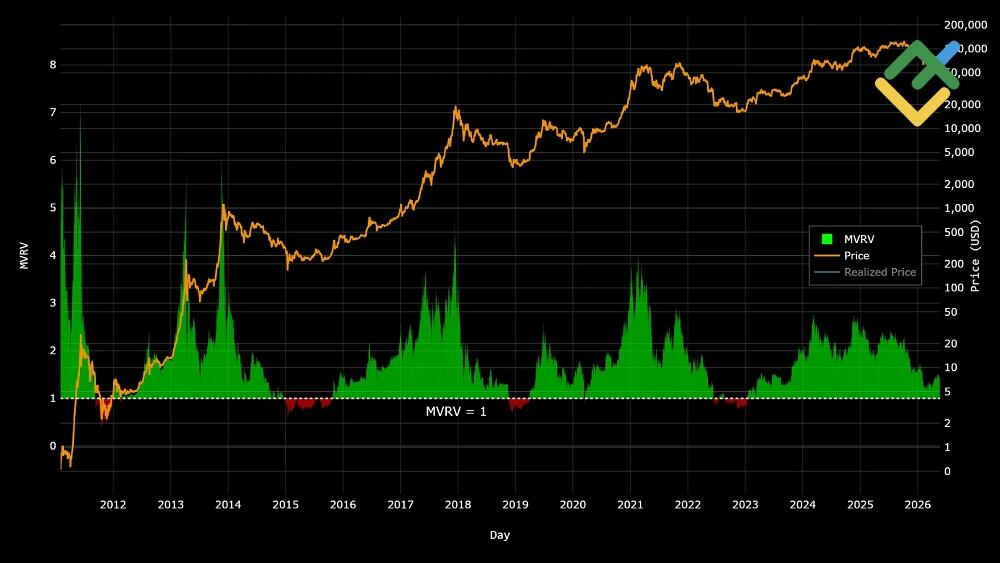
A range of metrics is used to assess the market's phase. One of the most widely referenced is the Market Value to Realized Value (MVRV) ratio, which helps assess whether Bitcoin is trading above or below its estimated fair value.
The indicator is particularly useful for identifying potential market peaks during periods of overvaluation and possible bottoms during periods of undervaluation relative to realized price levels. While the MVRV ratio is not a predictive tool, it has consistently proven valuable in analyzing cycle structure in previous market phases.
Historical price data helps investors understand the general patterns of past market cycles, but it does not provide clear trading signals. It should be viewed not as investment advice, but as a basis for analysis.
Such metrics can help an investor decide whether to buy or sell an asset. However, relying on a single metric or indicator can lead to flawed judgment and losses. Therefore, analyze metrics alongside other market factors and data.
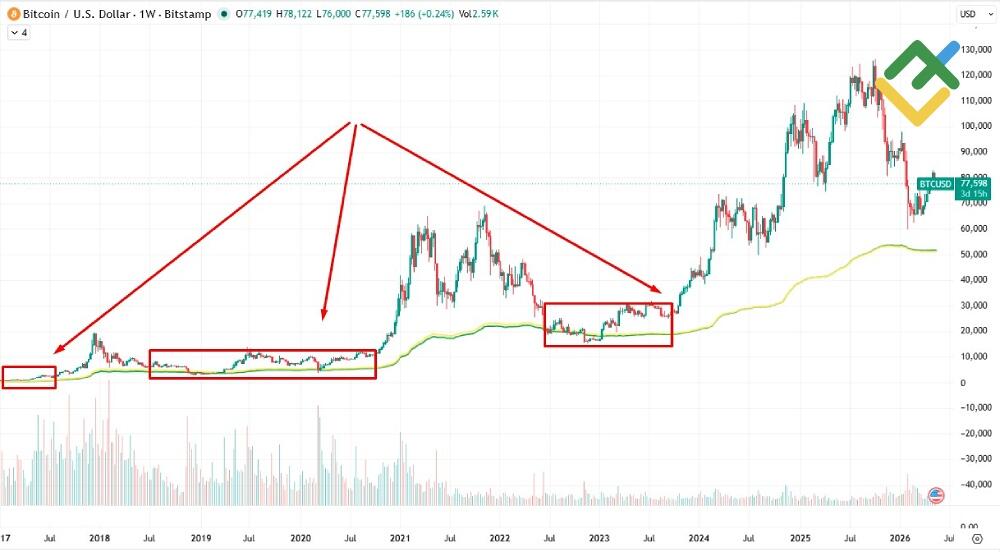
Phase 1. Accumulation Period
Following a market crash, BTC typically enters a consolidation phase, during which the Bitcoin price trades within a sideways range and volatility declines significantly. In this environment, long-term investors and larger market participants gradually accumulate positions, while broader sentiment remains dominated by fear and uncertainty.
The news flow is usually negative, with media narratives focused on pessimistic forecasts and claims that the market's growth phase has ended. However, on-chain indicators often suggest the opposite, including declining exchange balances and a rising share of coins held for more than one year.
In traditional cycle models, this phase can last for months. More recently, however, inflows through spot ETFs and other institutional channels have contributed to shorter consolidation periods.
Accumulation phase
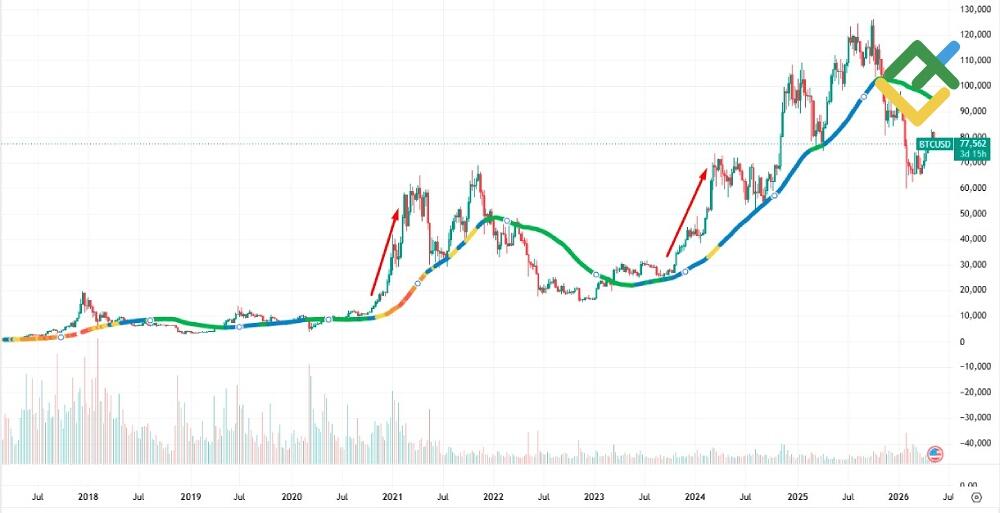
Phase 2. Growth and Price Recovery
At this stage, the price typically begins to show signs of sustained recovery: a sequence of green candlesticks emerges, and the price exceeds key moving averages. Market activity strengthens, trading volume increases, and both professional traders and retail investors gradually return to the market.
Bitcoin then climbs toward its previous highs. On-chain data often shows inflows of stablecoins to exchanges, suggesting investors are preparing to increase exposure to risk assets.
However, in the current cycle, this sequence has become less consistent. In 2024, a substantial portion of the rally occurred ahead of the halving, fueled by strong demand for spot Bitcoin ETFs. This was one of the earliest indications that the traditional four-year cycle model is losing some of its historical predictability.
Growth and recovery phase
Phase 3. Market Bubble Formation
At this stage, the market often enters a phase of euphoria. The media enthusiastically discuss the prospects for further growth, and attention to cryptocurrencies extends far beyond the professional community. Many investors begin to use leverage, fearing they might miss out on potential profits.
Trend indicators show extreme values, and the BTC price drifts further and further away from fundamental valuations. The Fear and Greed Index may remain in the extreme greed zone for an extended period. At the same time, major market participants and some institutional investors begin to gradually lock in profits, while retail investors continue to buy the asset amid high optimism.
However, in the current cycle, this phase has not been as pronounced as in previous years. Following the 2024 halving, the market did not demonstrate classic parabolic growth. In late 2025, the price dropped by approximately 30% from its swing high, rather than entering a prolonged, multi-month rally.
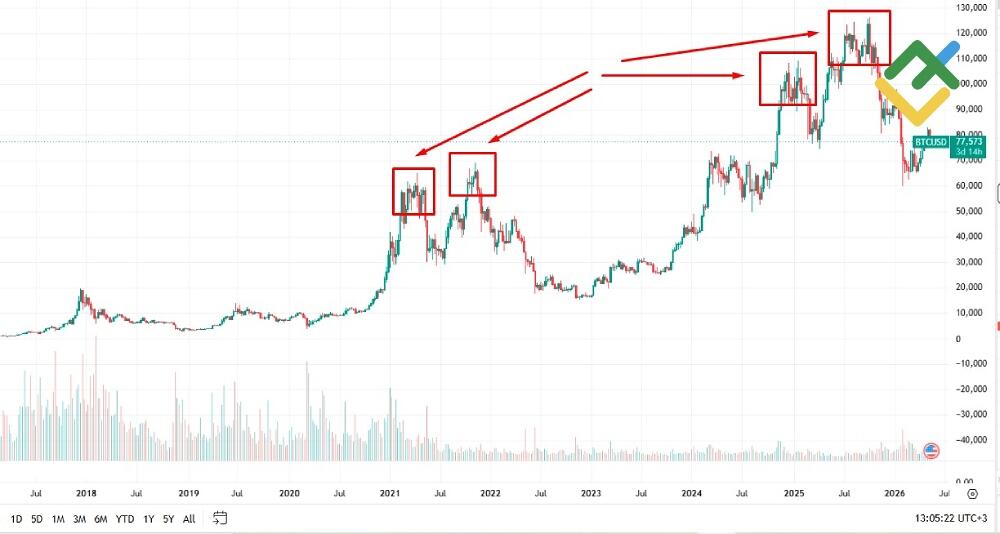
Distribution phase
Phase 4. Market Crash and Reset
In the final stage of the cycle, the bubble bursts, and a cascade of liquidations accelerates the price decline. A period often referred to as the crypto winter, when demand for Bitcoin drops sharply, liquidity shrinks, and weaker market participants lose money or flee the market.
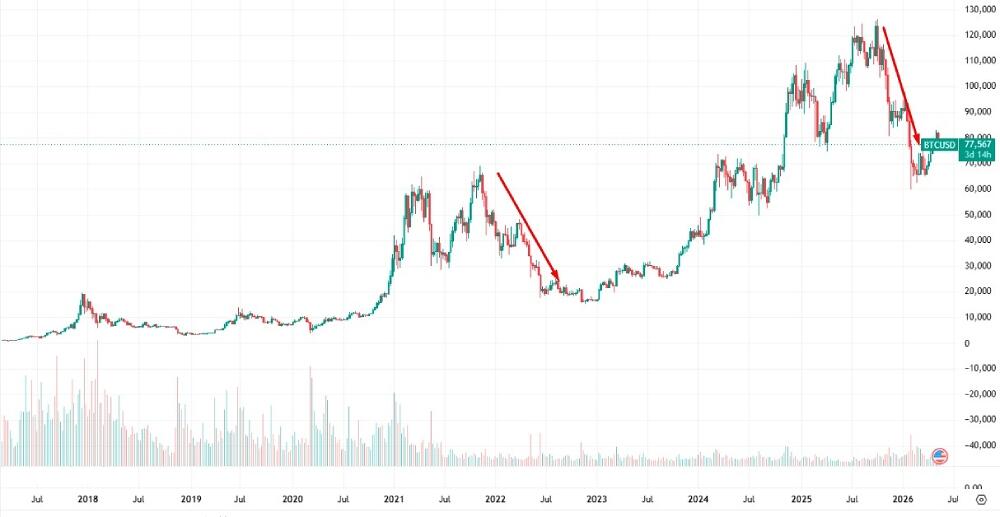
Early stages of a bear market
At the same time, long-term investors and major players are gradually building new positions in preparation for the next cycle. Similar trends were observed in 2014, 2018, and 2022.
However, in 2025, the market did not experience a classic crash, but rather a milder correction resembling a standard bear market in traditional financial markets. This once again confirms that past performance is no longer repeated with the same magnitude.
How to Track BTC Cycles
Investors track the following on-chain metrics, market indicators, and behavioral signals to determine the current phase of the BTC market:
Phase | What happens | What to track |
Accumulation | The price stabilizes after the crash | MVRV, trading volume, actions of long-term BTC holders |
Growth (or Markup) | The price moves out of the sideways range | Capital inflows, ETFs, liquidity, demand |
Market Bubble | Active buying | Overheating, Fear and Greed Index, historical performance |
Market Crash and Reset | Liquidation of weak positions | Drawdown depth, network security, future performance |
Supply and Demand Dynamics Around Halving
While Bitcoin's halving cycle continues to shape supply dynamics, demand is now influenced not only by retail investors but also by large institutional market participants. Moreover, several other factors are contributing to the market outlook:
Reduced supply. After the halving, miners receive half as many new coins, which reduces potential selling pressure.
Institutional demand. Spot ETFs, corporate treasuries, and other institutional investors create steady demand for Bitcoin—a factor that was virtually nonexistent in earlier cycles.
Hashrate and network security. The growth in hashrate and the stability of the mining industry strengthen network security. As the block reward decreases, miners become more sensitive to the asset's market price, which affects the economics of supply.
Macroeconomic factors. Fed decisions, interest rates, global liquidity, and overall investor risk appetite are increasingly influencing capital inflows into the crypto market. As a result, Bitcoin's performance depends not only on the halving but also on the state of the global economy.
Bitcoin's Correlation with Traditional Markets
Bitcoin has gradually evolved from an isolated asset into one that is increasingly integrated with the broader financial system. Today, its price movements show a growing correlation with traditional markets, including the S&P 500. As a result, BTC responds not only to developments within the cryptocurrency industry but also to Federal Reserve policy decisions, macroeconomic data releases, and geopolitical events.
The influx of institutional capital has made Bitcoin more sensitive to global financial conditions. A stronger US dollar, rising Treasury yields, and tighter monetary policy can constrain capital flows into risk assets, including cryptocurrencies, even in the aftermath of a halving event.
This does not diminish the importance of Bitcoin's limited supply. However, it does make the market increasingly dependent on broader macroeconomic cycles. As a result, BTC's price is now shaped by crypto-specific factors and global economic trends, whose influence can extend well beyond the traditional four-year halving cycle.
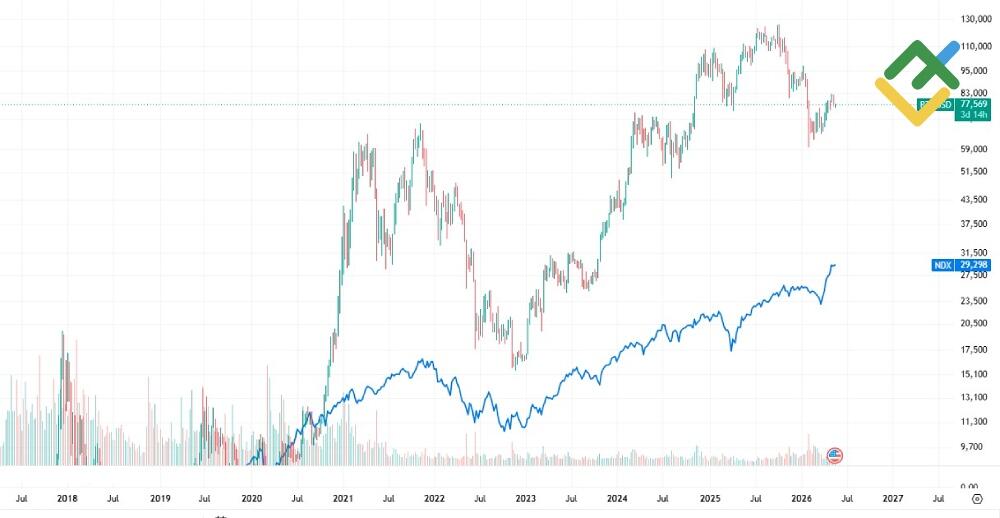
Correlation between Bitcoin and Nasdaq Index (blue line)
Mainstream Adoption and Market Impact
The growing adoption of cryptocurrencies has significantly altered the nature of Bitcoin's market cycles. While in 2014 BTC remained a niche asset for tech enthusiasts, today it has become part of the global financial system. Institutional funds, large corporations, and even countries are investing in Bitcoin. As the crypto market matures, the classic four-year cycle has become just one of the factors influencing its performance.
The expansion of the investor base is helping to reduce volatility. Compared to the early stages of the market's development, price swings have become less extreme, and returns in each new cycle are gradually declining. Instead of the rapid rallies characteristic of past years, the market increasingly exhibits the smoother momentum typical of mature asset classes.
The behavior of large investors also differs from that of retail participants. Institutional traders are generally focused on long-term strategies and are less prone to emotional decisions during corrections. This does not rule out the emergence of speculative phases, but it makes market cycles less pronounced and more difficult to interpret.
Many analysts and research firms note that the classic four-year cycle model is gradually becoming less predictive. Macroeconomic factors, global liquidity, and institutional capital flows are gaining increasing importance. Against this backdrop, halving remains an important event for the market, though its impact no longer appears as decisive as in previous years.
The next halving in 2028 will test this theory. It will reveal whether the reduction in issuance remains a key driver of the market cycle or whether the crypto market has definitively shifted to a new model in which broader economic factors play a decisive role.
Conclusion
In the past, Bitcoin cycles resembled a clockwork mechanism: halving reduced supply, demand pushed prices higher, and then the market entered a phase of overheating, followed by a correction. Today, this model is gradually evolving. Institutional capital, central bank policies, and the growing adoption of cryptocurrencies are exerting as much influence on the market as reduced issuance.
The 2028 halving could remain a powerful catalyst for Bitcoin, but investors should no longer assume that previous post-halving cycles will automatically repeat. Any Bitcoin price prediction should account for evolving market conditions by combining forecasts, macroeconomic trends, and individual risk tolerance, rather than relying solely on historical patterns.
Bitcoin's future trajectory will depend not only on its supply dynamics but also on global liquidity, institutional demand, ETF adoption, and the broader economic environment. As the asset becomes increasingly integrated into traditional financial markets, successful investing in BTC requires a clear strategy, a defined investment horizon, and disciplined risk management.
Bitcoin Cycle FAQs
Bitcoin's price movements have followed four-year cycles linked to halving events. However, in recent years, this pattern has become less pronounced. Institutional investment, macroeconomic factors, and the development of ETFs are changing the market's structure, making it more complex and less predictable.
Halving is a mechanism built into the Bitcoin protocol that halves the block reward for miners. It occurs every four years and slows the rate at which new coins are issued. The supply of new BTC on the market decreases, a dynamic that has historically supported the asset's price.
A lower rate of new Bitcoin issuance may support prices by tightening supply. However, future results will depend not only on the halving but also on global economic conditions, market liquidity, and institutional demand. As a result, past cycles should not be treated as a blueprint for future outcomes.
Price chart of BTCUSD in real time mode

The content of this article reflects the author’s opinion and does not necessarily reflect the official position of LiteFinance broker. The material published on this page is provided for informational purposes only and should not be considered as the provision of investment advice for the purposes of Directive 2014/65/EU.
According to copyright law, this article is considered intellectual property, which includes a prohibition on copying and distributing it without consent.