A trend reversal means a change in the direction of a long-term price movement. A trend-following trader aims to identify potential zones or levels where prices may reverse, and to enter or exit a trade at the right time.
There are many tools for finding optimal reversal points, including candlestick patterns, oscillators, and volume indicators. This review explains how to use them to spot trend reversal signals.
The article covers the following subjects:
Major Takeaways
Trend reversal indicators are technical analysis tools that help predict price reversal points or confirm a reversal that has already occurred. They help distinguish a genuine reversal from a correction.
Key trend reversal indicators are oscillators that indicate overbought/oversold zones and reversal patterns, as well as pivot points, support and resistance levels, trend lines, and trading volume.
Key trend reversal signals: 1) divergence—the price movement and the indicator move in opposite directions; 2) a drop in trading volume when key levels are approached or violated; 3) oscillators reverse in overbought and oversold zones; 4) reversal patterns.
Trend analysis is conducted across multiple time frames. If there is a clear trend on the H4 chart, price movement on the M30 chart may represent a correction.
No indicator works perfectly in every market condition. For each asset, time frame, and level of volatility, traders need to select a specific combination of indicators and fine-tune their parameters. For example, a primary trend indicator may provide an initial signal, while a reversal indicator and a chart pattern help confirm the trend reversal.
What Is a Reversal Indicator in Forex?
A trend is a clear, directional movement in price. If buyers dominate the market, the price rises. The more potential buyers there are, the faster the price rises; therefore, this is a sustained uptrend. If sellers prevail in the market, the price falls, and the trend is downward.
However, no trend lasts forever. Prices cannot rise or fall endlessly. At some point, buyers may decide they have earned enough and either sell the overvalued asset or buy it at a lower price. When this happens, a reversal occurs.
What you need to know about trend reversals:
You can find trend reversals on any time frame. Trends are never perfectly straight, and a reversal may turn out to be a short-lived correction. However, corrections can also be exploited to your advantage.
A trend can reverse suddenly due to the emergence of fundamental factors, such as news and reports, derailing your trading strategy.
One of the most effective tools for trend trading is a trailing stop. It follows the price at a fixed distance. Let's say you see a trend reversal signal and open a trade in that direction. If the reversal turns out to be a correction, the trailing stop will trigger automatically without any extra action on your part.
The best reversal indicators are technical analysis tools designed to identify when an existing trend is losing momentum, and prices are likely to move in the opposite direction. Unlike trend-following indicators, which typically lag behind price action, reversal indicators aim to provide early signals of a shift in the balance of power between buyers and sellers.
How to Find Reversal Points Using Technical Indicators
Let's take a look at technical analysis tools that help identify reversal zones and levels:
Oscillators. These indicate overbought and oversold zones. Primary signal: a reversal of the oscillator line within these zones and a move toward the middle horizontal line (or zero line). Another strong signal is divergence, i.e., a discrepancy between the price and the oscillator.
Support and resistance levels, trend lines. If the price has reversed several times at a single level, it may reverse there again when traders' pending orders are triggered.
Fibonacci levels. This tool is based on a mathematical sequence where the 38.2%, 50%, and 61.8% levels act as "hidden" support or resistance zones.
Candlestick patterns are a visual representation of the tug-of-war between buyers and sellers. They may consist of 2–3 candlesticks or have a more complex structure, such as the Gartley Butterfly.
Trading volume indicators. A gradual decline in trading volume, accompanied by smaller candlestick bodies, is a sign of a looming trend reversal.
Pivot Points. These reversal levels are calculated from the previous day's high, low, and close. The further the price moves away from the central level, the higher the probability of a reversal.
These Forex reversal indicators are best suited for identifying reversals and work well in conjunction with trend-following tools. For example, an early signal might be a change in the direction of moving averages, which can then be confirmed by chart patterns or oscillators.
Relative Strength Index (RSI)
The Relative Strength Index (RSI) is an oscillator that evaluates the speed and magnitude of recent price changes on a scale from 0 to 100. It is most commonly used to identify overbought (above 70) and oversold (below 30) market conditions. It helps pinpoint potential turning points or confirm the strength of the existing momentum.
Advantages:
Demonstrates high signal accuracy based on classic divergence.
Can be adapted to different levels of market volatility by adjusting the overbought and oversold zones.
Disadvantages:
False signals during strong trends. The indicator may remain in the overbought/oversold zone for an extended period, while the price continues to move against the signal.
Ineffective in flat markets because it generates many false signals.
Example:
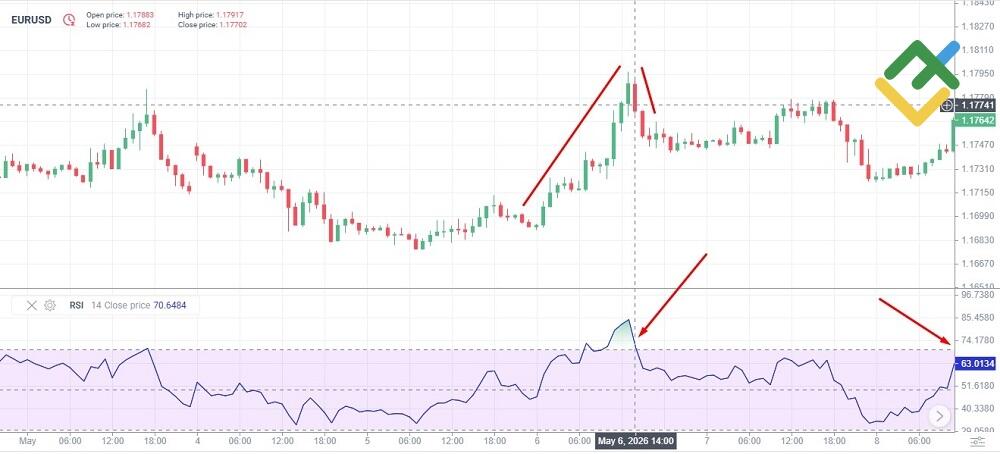
The RSI has reversed in the overbought zone above 70, confirming that the red candlestick during an uptrend is a reversal rather than a temporary correction.
Moving Average Convergence Divergence (MACD)
MACD is a trend-following oscillator that tracks the correlation between two exponential moving averages (EMAs). It consists of the MACD line, the signal line, and the histogram. It helps determine the trend direction, its strength, and moments of a potential market reversal when the moving averages intersect or the height of the histogram bars changes.
Advantages:
Combines features of a trend indicator and an oscillator.
Effective for identifying divergences.
Disadvantages:
Lagging due to moving averages. The indicator generates signals after the direction of price movement has already changed.
Does not show overbought/oversold zones. Unlike the RSI, MACD has no fixed boundaries, so it is difficult to tell when a trend has become extended.
Example:
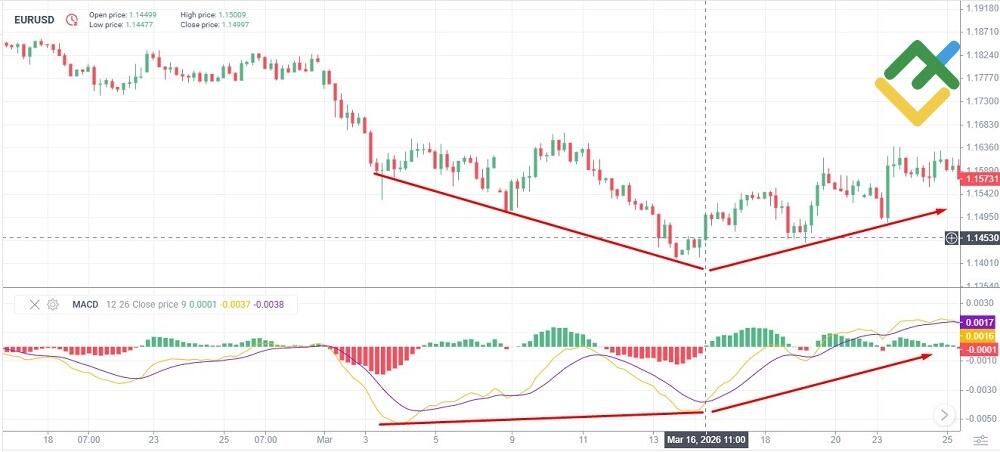
The price is hitting lower lows, while the oscillator is hitting higher lows—a classic bullish divergence. At some point, the price stops falling and reverses direction, following the oscillator. A final signal of a trend reversal comes when the histogram crosses the zero line and green bars appear. Divergence lines can be drawn based on both MACD lines and histogram lows.
Stochastic Oscillator
The Stochastic Oscillator is a momentum indicator that compares an asset's closing price to its price range over a period specified in the settings. It is based on the idea that, in an uptrend, closing prices tend toward the highs, and in a downtrend, toward the lows. It consists of two lines, %K and %D, and ranges from 0 to 100. Values above 80 signal overbought conditions, while values below 20 signal oversold conditions.
Advantages:
Signal clarity. When the fast %K line crosses the slow %D line upon exiting the overbought or oversold zones, it signals to open a trade.
Can be used as a leading momentum indicator.
Disadvantages:
Reacts to price changes more quickly than the RSI or MACD, but produces many false signals.
Should only be used as a supplementary tool.
Example:

This example illustrates several points:
The Stochastic indicator generates almost no signals. It lags behind the price action. However, reversals in overbought and oversold zones, as well as breakouts from these zones, confirm a bullish reversal or a bearish reversal.
Signals occur relatively frequently, but half of them indicate a minor price reversal or correction.
Bollinger Bands
Bollinger Bands are a channel-based indicator used to measure both trend and volatility. They consist of a moving average and two outer bands plotted at a set number of standard deviations from it. Together, they form a dynamic price channel that expands during periods of high volatility and contracts during quieter market conditions. A breakout beyond the channel boundaries, along with band expansion, signals strong momentum. However, the further the price moves away from the moving average, the higher the likelihood of a potential reversal.
Advantages:
Clearly displays changes in volatility.
The dynamic channel automatically adapts to market conditions.
Disadvantages:
Requires signal confirmation. A breakout alone is not a signal to open a position; it merely indicates an abnormal deviation from the average price.
May trail behind price action.
Example:
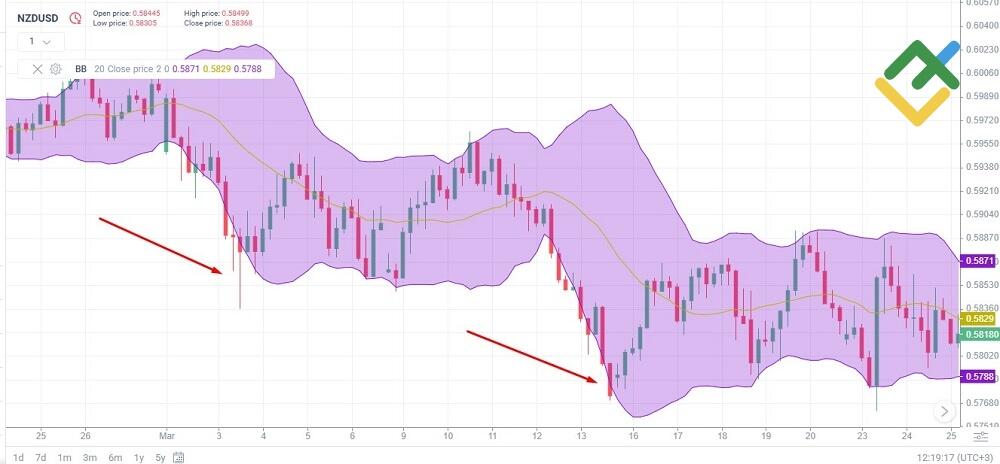
Bollinger Bands effectively illustrate changes in volatility—the widening and narrowing of the channel. However, because channel boundaries mirror price movement, it is difficult to identify a reversal point based solely on that movement. The primary signal to focus on is the distance between the price and the central moving average. The screenshot shows that the price moves far away from the moving average, followed by a reversal. Once the reversal is confirmed by other key indicators, you can open a trade with a take-profit level at the channel midpoint.
Trend Reversal Patterns That Confirm Reversal Points
Price Action patterns are candlestick formations made up of two, three, or more candles. They reflect the psychology of market participants and can help identify potential trend reversals or continuations. Many traders consider them more informative than indicator-based signals derived from mathematical formulas, as they are directly rooted in price behavior and market sentiment. Trades are typically opened only after the pattern has fully formed, and price action confirms the move.
Below are examples of popular reversal candlestick patterns with an accuracy rate of over 70%: a Shooting Star, Head and Shoulders, and a Double Bottom/Double Top.
Head and Shoulders
A popular reversal pattern that forms at the peak of an uptrend, signaling a potential shift to a bearish trend. It consists of three consecutive peaks: the middle peak (the head) is the highest, while the two surrounding peaks (the shoulders) are roughly equal in height and slightly lower. The line drawn through the lows of the pullbacks between the peaks is known as the neckline. A break below this level is considered a strong sell signal and confirmation that the uptrend has ended.
Advantages:
One of the most reliable technical analysis patterns. The formation of the second leg indicates that buyers are unable to push the price above the previous high. Consequently, sellers are in control, and the uptrend has ended.
It works on longer time frames. The pattern is particularly effective on daily and weekly price charts for identifying major reversals.
Disadvantages:
It is rare to encounter this pattern, and it is even rarer to find one with a perfect formation. More often, the shoulders have different heights, it is impossible to draw a precise neckline, and the head may consist of several peaks.
Subjectivity. Beginner traders often see this pattern when it is not there.
Example:
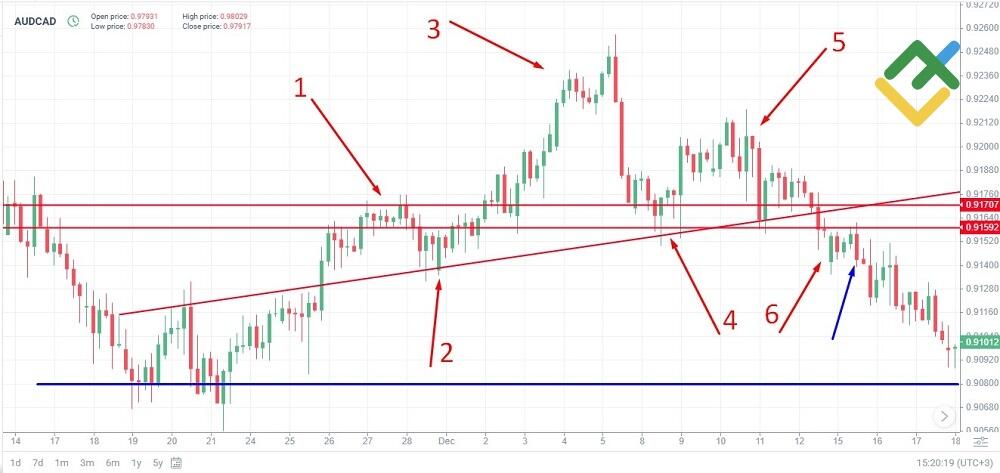
The price forms the left shoulder (1) and the neckline support (2) within an uptrend. Then the head (3) takes shape, and the price returns to the support level (4). The right shoulder (5) shows that buyers are losing strength. The price cannot rise above the peak (3). Short positions can be opened here, but the risk is still high.
After reaching the high (5), the price fluctuates for some time at the intersection of the three levels, then breaks through them and retests (6). The price cannot break through the lower horizontal level and continues to move downward, confirming the downtrend. A short position is opened at the blue arrow; the take-profit is the blue horizontal line. Although the trading strategy allows you to capture only 30–50% of the downtrend, the risk of error with a placed trailing stop is virtually nonexistent.
Double Top and Double Bottom
These trend reversal patterns visually resemble the letters M (Double Top) and W (Double Bottom). A Double Top forms at the peak of an uptrend when the price tests a resistance level twice but fails to break above it.
A double bottom forms during a downtrend when the price rebounds twice from the same support level. The pattern is considered complete only after the neckline — the swing high or low formed between the two peaks or troughs—is broken through.
Advantages:
Clearly indicates a double failed attempt to continue the trend; a reversal in prices is possible.
Easily recognizable on the chart due to its distinctive shape, especially when zoomed out.
Disadvantages:
False breakouts. The price crosses the neckline and immediately reverses—the pattern's structure is disrupted.
Price extremes are rarely perfectly even, which makes it difficult to determine exactly when a pattern is considered complete.
Example:

After the consolidation phase, buyers attempted to push the price higher, but selling pressure then intensified. The first low is below the second, indicating bearish weakness. A long position can be opened on the next candlestick after the neckline is pierced.
The pattern is not flawless. Sometimes, after it has fully formed, the price moves through several candlesticks, breaks the neckline, and then reverses.
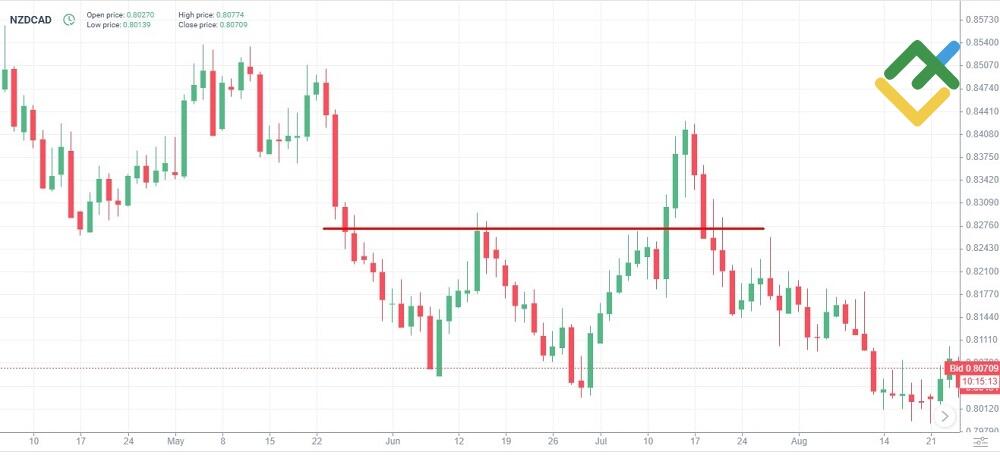
Here we can see that the price has formed two lows at virtually the same level—this is a Double Bottom pattern. However, the momentum ends almost immediately after the neckline is violated. Therefore, when trading this pattern, always place a stop-loss order near the neckline in case of a false breakout.
Reversal Candlestick Patterns
Other reversal candlestick patterns:
Hammer. A single candlestick with a small body and a long lower shadow, formed at the end of a downtrend. It signals that sellers were pushing the price down, but buyers managed to push it back to the opening level.

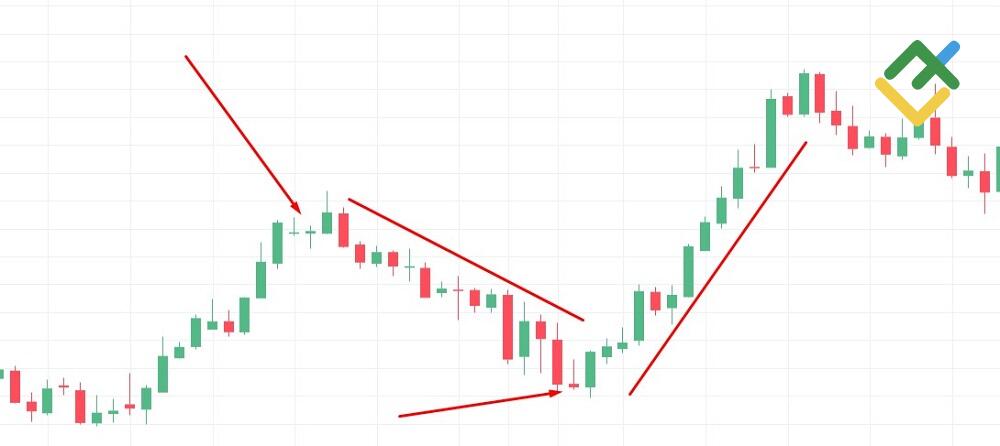
Bullish/Bearish Engulfing. The body of the second green candlestick completely covers the body of the preceding red candlestick—a signal of a shift to an uptrend. In a Bearish Engulfing pattern, the red candlestick, conversely, covers the green one. See the example below.

Doji. A candlestick with an opening price nearly identical to the closing price. Its appearance alone signals high market uncertainty. If a Doji appears after a prolonged trend, a reversal may be imminent.
How to Use Reversal Indicators in a Forex Trading Strategy
The whole idea behind trend reversal trading is to assess the strength of the existing trend and wait for a reversal. If the average daily price volatility is, for example, 80 points and the price has moved more than 50% of that range, then the probability of a reversal is quite high.
Here are some tips for beginner traders on trading reversals:
Do not open a trade immediately in line with an existing trend; wait for a reversal before making a trading decision.
Use several different indicators to confirm a reversal.
Analyze higher time frames, such as H4 or D1. Reversal signals on the 5-minute chart often turn out to be market noise. If a strong trend is visible on the daily chart, a reversal signal on the H1 chart is most likely just a minor correction.
Monitor volume; it reflects market sentiment. A genuine bullish or bearish trend reversal is usually accompanied by high trading activity. If a trend reversal indicator shows a change in market direction but volume is falling, this may be a false or very early signal. An increase in volume during a change in direction confirms that large traders have opened positions, and a trend reversal is possible.
Keep in mind that a trend reversal against your trade can occur at any moment under pressure from market makers or fundamental factors. Therefore, use stop-loss orders and follow risk management rules.
Focus on long-term trends so you can weather short-term corrections. The most stable trends are found on medium- and long-term time frames.
Conclusion
Trend reversal indicators should be viewed as complementary tools rather than standalone trading signals. Their primary role is to confirm signals generated by trend indicators. For better accuracy, traders should combine different types of reversal tools, such as oscillators, chart patterns, and volume indicators. In most cases, it is more effective to identify potential reversals on higher time frames and execute trades on lower ones.
There are no perfect indicators, as market conditions can change instantly in response to fundamental factors. To improve your chances of success, combine multiple indicators and experiment with their settings to find what works best for your trading style and market conditions. Before risking your money, always test your trading system on a demo account.
Get access to a demo account on an easy-to-use Forex platform without registration
Reversal Indicators on Forex FAQs
Use a comprehensive approach that combines chart patterns with technical indicators. Key reversal signals include oscillator divergences, reversal candlestick formations, failed breakouts at key levels, and declining trading volume.
Each indicator has its own algorithm and different approaches to generating signals, so there is no such thing as a perfect or "most accurate" indicator. Much depends on volatility and financial market conditions. Analyze signals from several reversal indicators simultaneously and look for confirmation.
A correction is usually a short-term pullback with low trading volume, while a reversal is broader, longer-lasting, and supported by high volume. Key reversal signals include a break in trend structure, a trendline breach, deeper pullbacks, and divergences between price action and indicators.

The content of this article reflects the author’s opinion and does not necessarily reflect the official position of LiteFinance broker. The material published on this page is provided for informational purposes only and should not be considered as the provision of investment advice for the purposes of Directive 2014/65/EU.
According to copyright law, this article is considered intellectual property, which includes a prohibition on copying and distributing it without consent.