One of the most famous sayings among the fans of technical analysis is “Trend is your friend”. And one of the trader skills is identification of the trend direction. When the trend in the stock markets is clear, a trader can trade more efficiently both with trend trading strategies and countertrend strategies.
The article covers the following subjects:

Bulls and Bears of Forex
Well, a trend is a directed price movement. If the price is rising, the trend is upward (it is also referred to as ‘bullish’), if the price is declining, the trend is downward (or ‘bearish’).
It should be borne in mind that identifying the trend always means analysis of the current market sentiment. Differently put, it would be a mistake to think that a trend should ALWAYS continue, irrespective of the time frame. Yes, it is rather likely to continue, but it will never be 100% so.
The second important matter about a trend is that its direction helps you filter off false signals when looking for right entry points, i.e. those that suggest a low probability of a winning trade. If a trader employs a forex trend trading strategy and receives a sell signal in an uptrend, such a signal is ignored. However, it doesn’t still guarantee that all buy trades in a bull market will be winning. Nonetheless, even despite a certain share of losing trades, the trader, trading only the signals in the trend direction and ignoring opposite signals, following a series of trades, will achieve better performance than all the other traders, applying some other trading strategy.
Bullish and Bearish trends: basics of construction and trading
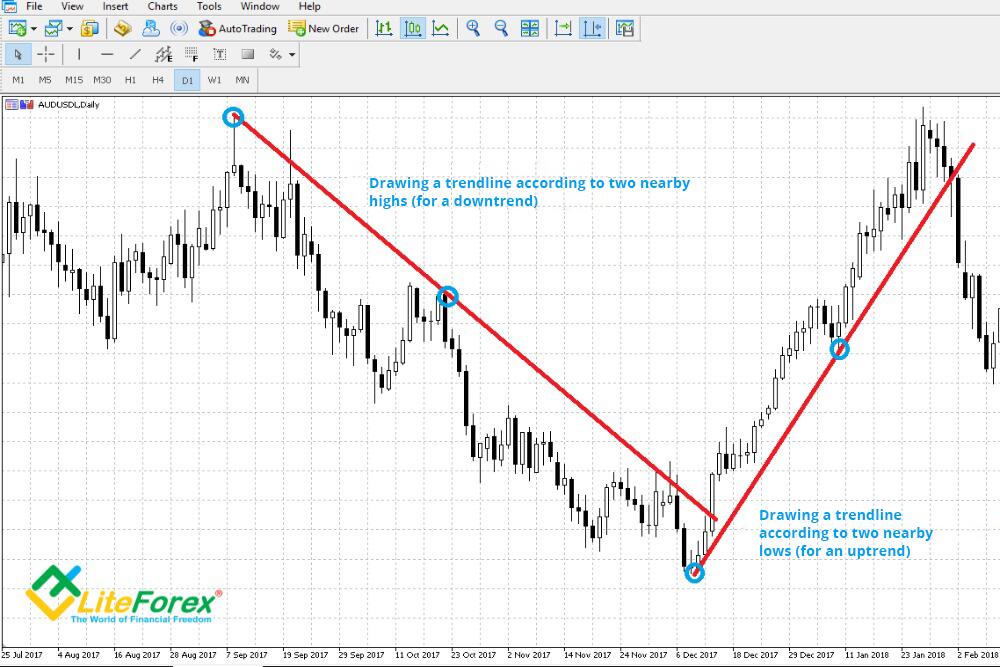
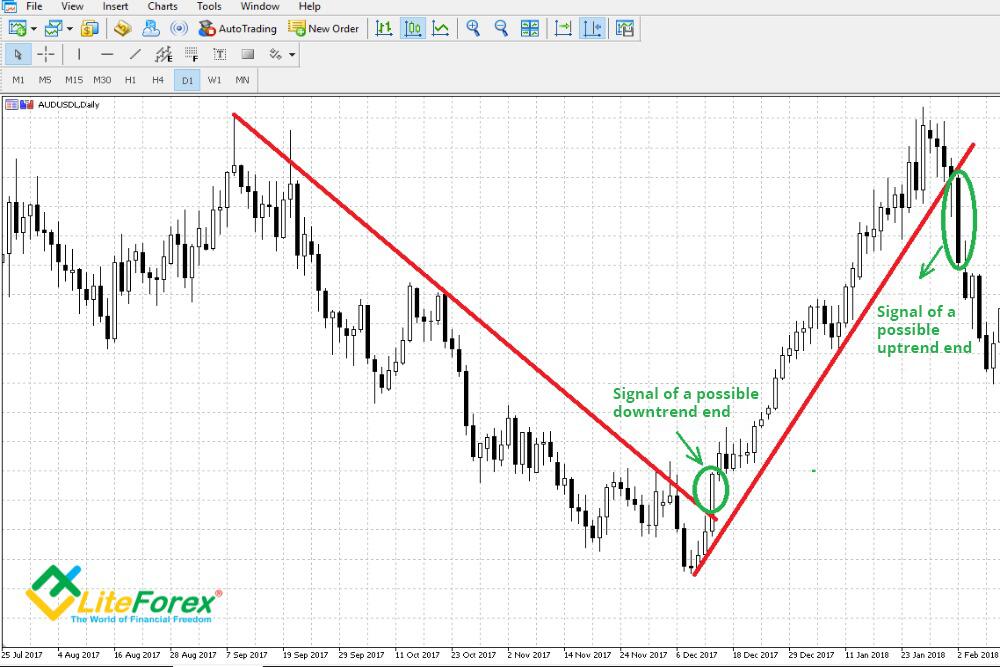
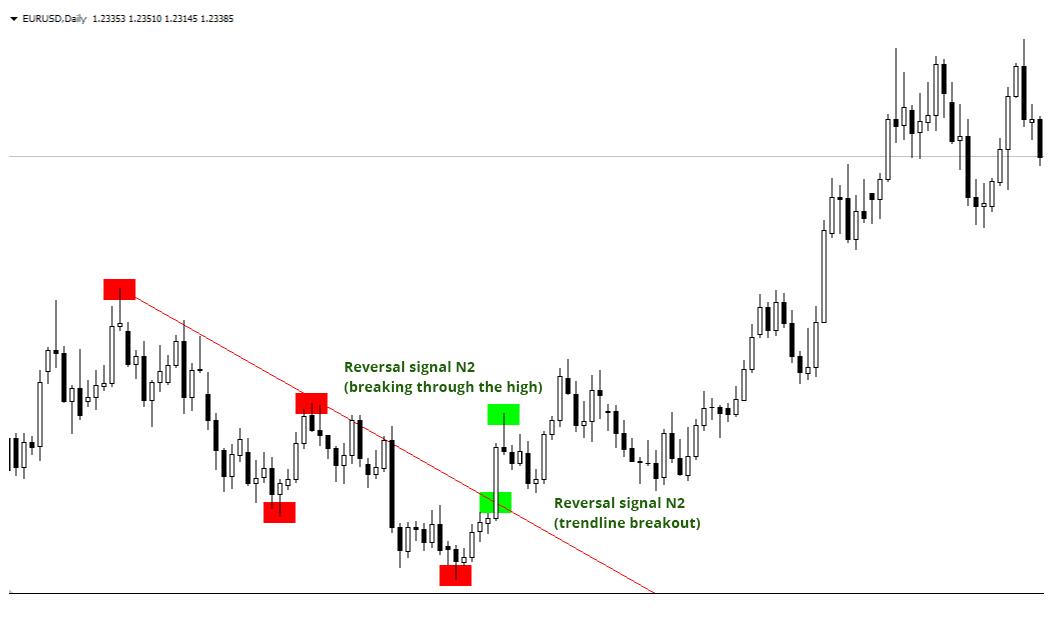
A common way to indicate a bullish (upward) trend is drawing a straight line through the two lows, next to each other. This line is called ‘trendline’. If the price breaks through this trendline, it is a signal that the trend may exhaust or even reverse.
A bearish (downward) trend is indicated in a similar way in a bear market; but the trend line is already drawn through the two nearby highs. The logic of a reversal signal is the same.
The clearer are the highs/lows, according to which the trendline is drawn, the more global is the trend, and so, the stronger will be the signal of the so called ‘trendline breakout’; there are also some special indicators that calculate the strength index.
At first, it can be difficult to identify the ‘significance’ of low/high showing the amount of buying and selling. Based on which, the trendlines are constructed. In this case, to find out the trading range and the trend strength, you can apply different timeframes of price action. It is commonly thought that the longer is the timeframe, the longer-term is the trend ongoing in the market. Therefore, the trendline, built in the longer timeframe, will always indicate the border of the long-term trend in the short term timeframes.
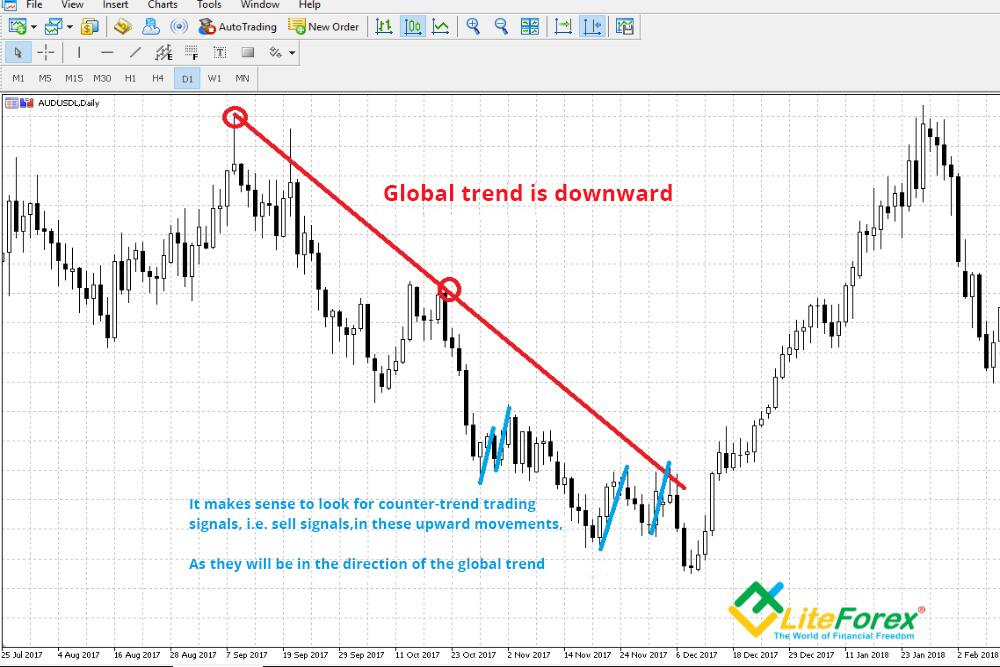
It should be borne in mind that a few trendlines can be built according to the same point. There are often situations when a shorter, local trend line is broken out, but the global trend, in a weekly chart, for example, continues in its former direction. If a trader is trading with the trend, the general recommendation in these cases will be still ignoring signals that are contrary to the global trend direction.
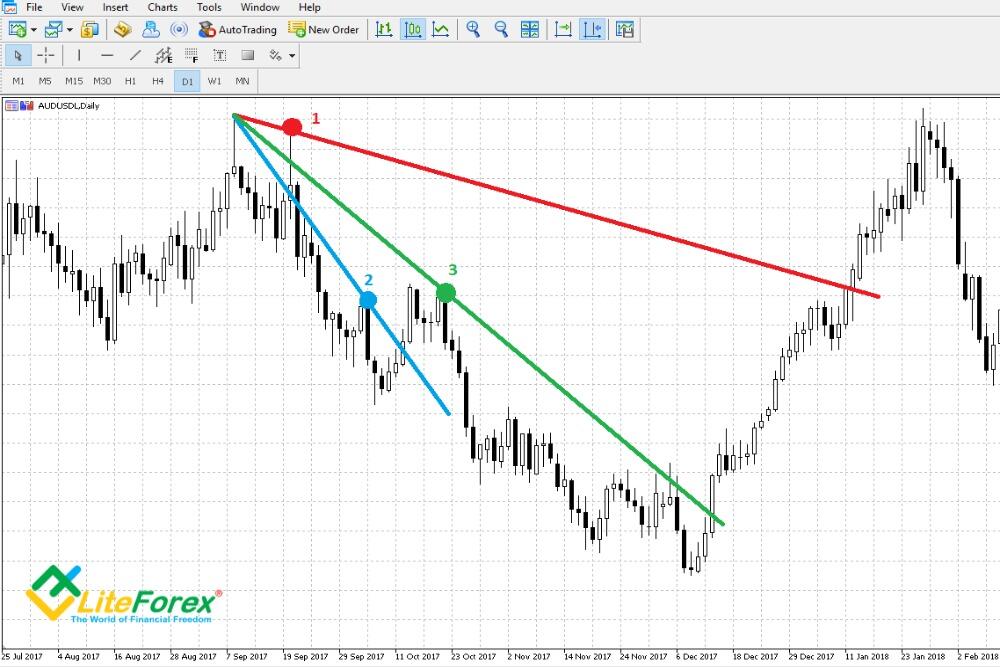
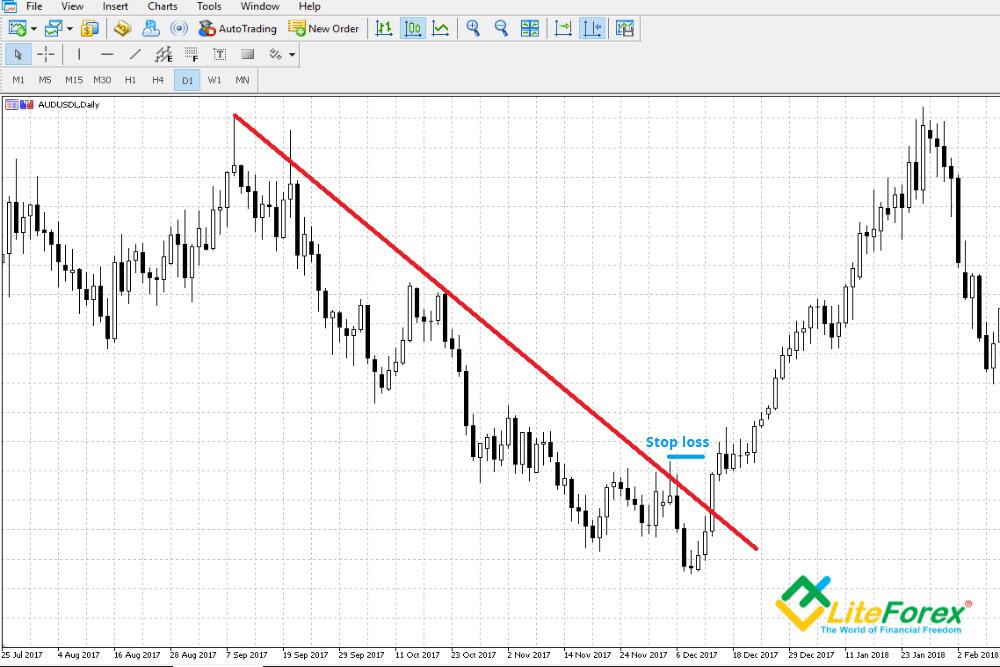
Such a situation is displayed in figure 4:
- At first, a downtrend formed in the chart, which could be depicted with trendline N1 after the second high of September 20, 2017 had been formed.
- Afterwards, the downtrend strengthened, forming, after a correction, another high, through which one could draw a more local descending trendline N2.
- Next, there was a longer upward correction, having formed a more global high of October 23, 2017. Finally, there could be drawn trendline N3 that indicated the border of the global downtrend.
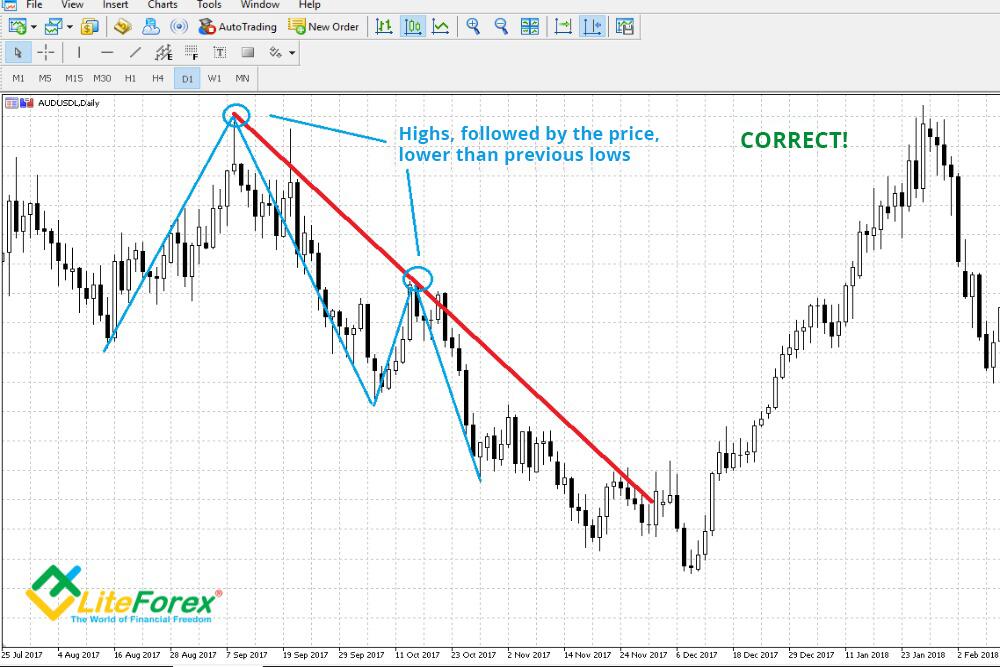
Important! It is right to draw the trendline in a downtrend only through the highs that were followed by new price lows (i.e. after which the trend continued).
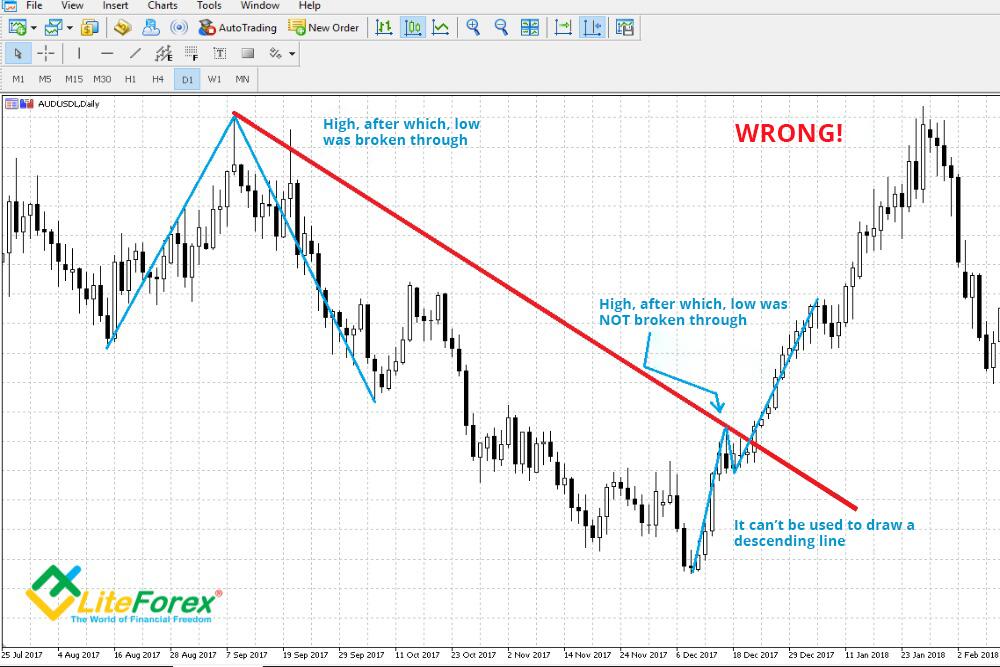
It is a mistake to draw a trendline according to the highs, after which the price didn’t go lower than the previous lows:
Now, let us study how to build trendlines in a bullish trend:
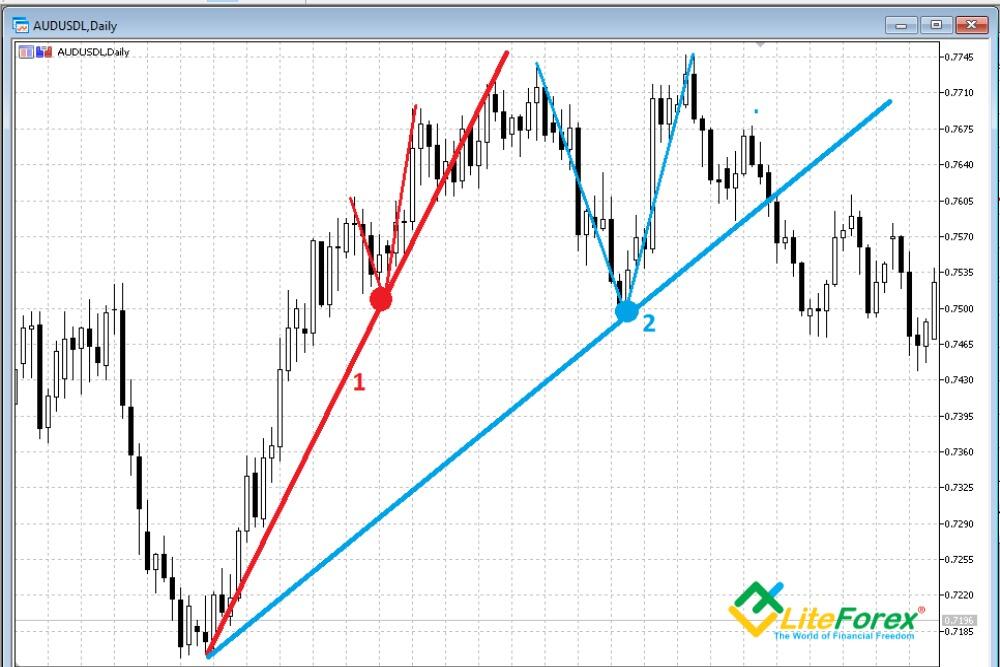
You can see two ascending trend lines in the chart:
Line N1 represents a more rapid local uptrend, as the second low, it is drawn through(marked with red dot), appeared after a short correction.
Afterwards, on approximately February 11, you can see a signal that the trend may reverse – the trendline was broken out and the bar closed below. However, the price didn’t start sliding down right away and moved up for the last time. And only after that, a long downward movement started.
As you see next, the above downward movement turned out to be a correction that was followed by the price breaking through the previous high. Thus, we could draw trendline N2, representing the border of a more global uptrend
I’d like to stress that, when you draw trend lines in a bull market, you base on the same logic as in case with downward trendlines:
It makes sense to draw a trend line in an uptrend only through the lows, after which the price reached new highs. In our case, this rule is observed.
Try to build a long-term bearish trend on your own on the EURUSD chart here. Chose the timeframe of 1 year at the bottom of the chart and apply the Trend Line tool:
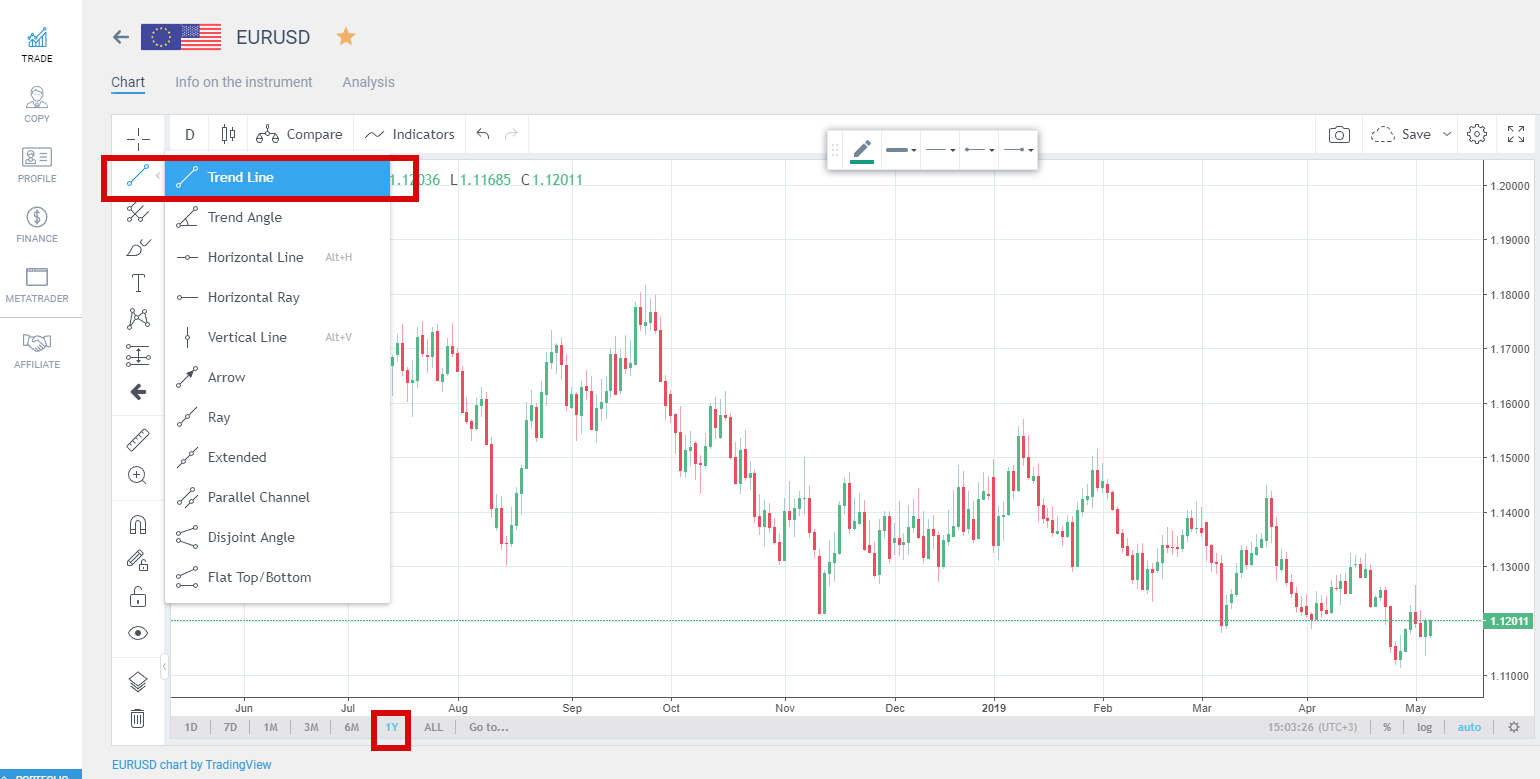
Have you succeeded? Excellent!
What should a trader do with bullish and bearish trends?
The most important thing is to learn step by step how to determine in advance what direction you will trade in.
If you are a trend trader, you need to determine in advance the global trend direction and you should enter trades only based on corresponding signals, ignoring all the others. You should remember that getting a few losing trades with the trend before a winning one is a feature of trend trading. Here, you mostly bet on getting the maximum profit due to the probable continuation of the global trend. Therefore, the profit, yielded by even one winning trade can excessively cover the losses, yielded by a few losing trades, occurred before.
If you would like to try counter trend trading in financial markets, you also need to know to major rules of countertrend trading:
You shouldn’t expect long price movements after you’ve entered a trade. The concept of a counter-trend itself implies that a trader is trading a corrective price movement that is likely to end quite soon.
The essence of any countertrend is to enter a trade in the direction opposite to the rice momentum, betting on a pullback. You’d better enter contrary to the local price momentum, but ACCORDING to the global trend direction.
According to these rules, trading counter trend in general suggests small-sized, but frequent winning trades with take profit/stop loss ratio of about 1/1.
Trading the trend will have a bit different features in cases with employing different types of forex analysis:
- Trading, based on technical analysis suggests that the trader uses the trend direction as a filter for signals in his/her trading strategy (an entry is put only if the trading strategy signals are in the same direction as the trend and the risk management rules are observed). There are usually applied technical tool, like moving averages, for example.
- Trading based on fundamental analysis suggests utilizing the information on the price trend direction as a supplementary tool to enter a trade according to the global macroeconomic trend.
Both of these types of analysis apply the principle “from large to small”:
- When using technical analysis, the global trend is determined in a longer timeframe, and the entry signals come from a short term time frame. For example, if a global trend is identified in an hourly chart, entry signals can be looked for in a 15-minute or 5-minute chart.
- When using fundamental analysis, you first assess the general outlook for the instrument traded, based on the analysis of macroeconomic factors; next you make a forecast about the future situation; and finally, You analyze the price chart to search for an entry signal, in the same direction as the forecast.
It should be also borne in mind that trendline breakouts can often be false. This also can be used in the trading strategy, when you enter a trade expecting the trend continuation, rather then the trend reversal,
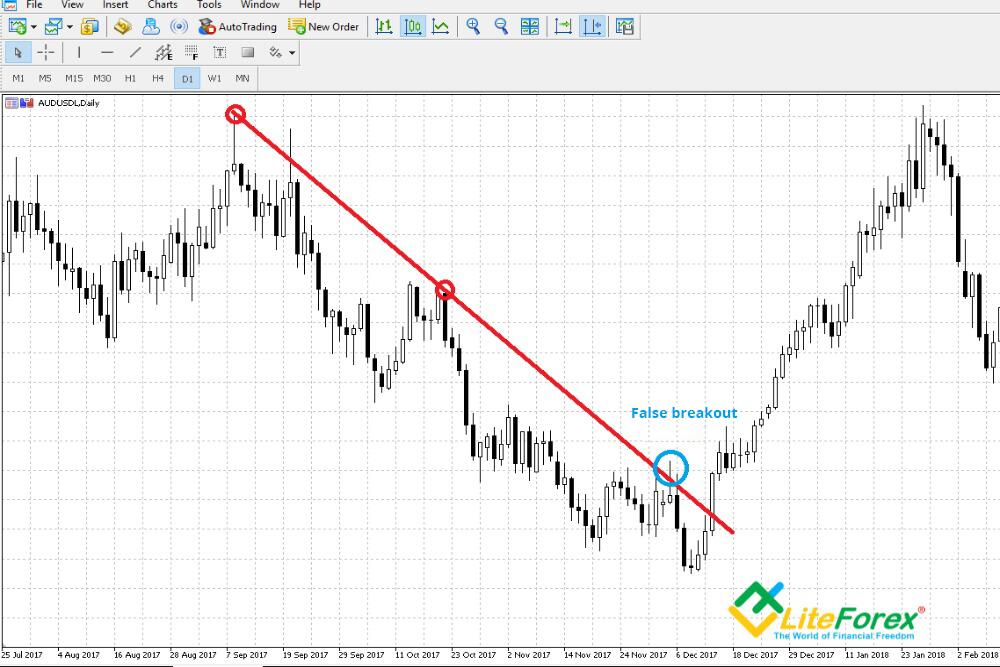
In this case, you may enter a trade if the price rolls back below the trend line. A stop loss is set higher than the false breakout.
This way of entering a trade has several advantages
If the trend hasn’t reversed, so, it still highly likely to continue
Small stop loss, compared to a potential profit
Simple entry
You can choose a few entry signals:
The price rolls back below the trend line
The price closes above the trend line (for bullish trend) or below the trend line (for a bearish trend), different candlestick patterns emerge, and so on.
Conclusion
It is quite easy to identify a trend, so, anyone will succeed. The difficulties start when a trader has particular expectations for the further price movements. If you approach the trend definition like predicting future price movements (for example, trying to guess if the trend will continue or reverse), this will only result in disappointment, because it is impossible to predict the future. But if you realize that the correct definition of a trend only tilts the scales of probability in your favor, and is not a 100% guarantee of success, then you will trade more consciously, and the approach will be more professional.
P.S. Did you like my article? Share it in social networks: it will be the best "thank you" :)
Useful links:
- I recommend trying to trade with a reliable broker here. The system allows you to trade by yourself or copy successful traders from all across the globe.
- Use my promo code BLOG to get a 50% deposit bonus on the LiteFinance platform. Simply enter this code in the appropriate field when funding your trading account.
- Telegram chat for traders: https://t.me/litefinancebrokerchat. We are sharing the signals and trading experience.
- Telegram channel with high-quality analytics, Forex reviews, training articles, and other useful things for traders https://t.me/litefinance
Price chart of EURUSD in real time mode
The content of this article reflects the author’s opinion and does not necessarily reflect the official position of LiteFinance broker. The material published on this page is provided for informational purposes only and should not be considered as the provision of investment advice for the purposes of Directive 2014/65/EU.
According to copyright law, this article is considered intellectual property, which includes a prohibition on copying and distributing it without consent.