Studying the features of Forex trading using VSA and the “Broadening Wedge” pattern
The ability to read the market not only helps to survive in difficult situations but also to earn money with familiar patterns. One of them is the “Expanding Wedge” pattern. Its effectiveness is high, but if you add VSA-analysis elements to your trading method, the result will be even better. The fighting between bulls and bears does not cease, and the ordinary trader needs to determine which of them dominates in order to take the side of the fittest. I call this approach the coyote method, and it works.
Trend reversals may occur very rapidly, though, as a rule, they are accompanied by consolidation, which in VSA is usually called distribution or accumulation of positions by large players. Within its framework, extremes are often drawn, which ultimately leads to the formation of the Expanding Wedge pattern. It includes two lines, 2-4 and 1-3, formed with the help of successively rising maxima and lowering minima. Neither sellers nor buyers want to surrender. Someone has to surrender anyway. If you can identify a loser, you can confidently open a position. And here the analysis of spreads and volumes comes to help us.
Broadening wedge on EUR/AUD chart
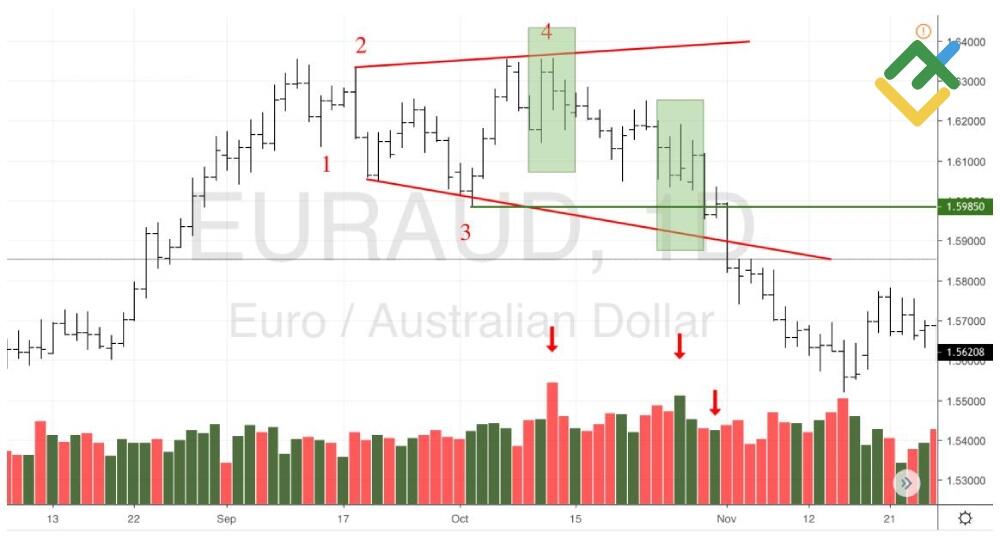
The appearance of high-volume charts should draw the attention of any trader. If the movement is on the bar with a decent range in the framework of consolidation, it makes sense to assume the presence of a trace of a large "bear". Confirmation is the formation of point 4 of the “broadening wedge” pattern. The inability of the bulls to restore the uptrend is the first sign of their weakness. Now we should prepare for a breakthrough of support line near point 3. Up to this point, the emergence of an upthrust on increased volumes indicates that everything goes according to the plan. The rebound is coming!
Trading strategy for the broadening wedge on the EUR/AUD chart
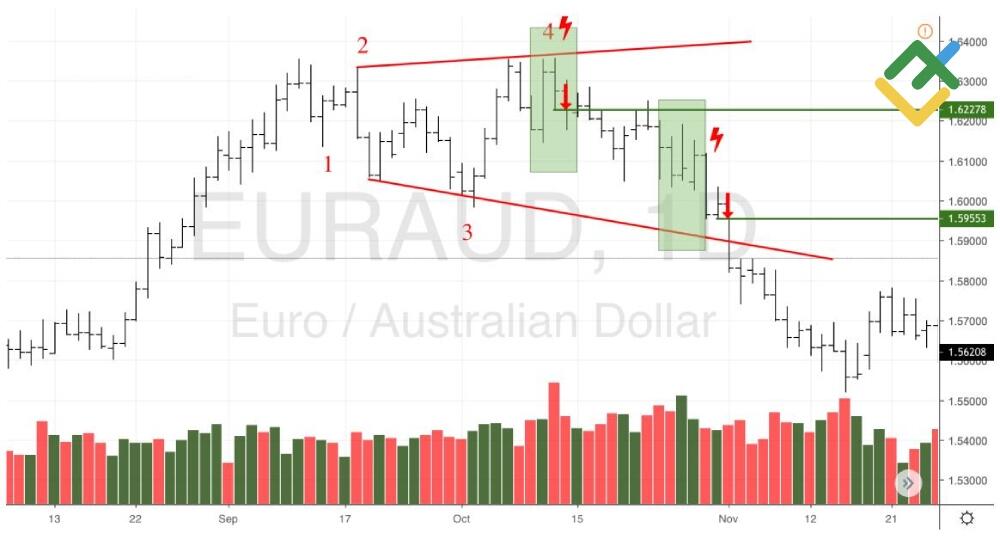
The conservative approach assumes that the trader should be waiting for the breakout bar to close. If it is below support, as in the case of EUR/AUD, a pending order is placed at the minimum point of the bar. Its activation allows you to open a short position. The aggressive strategy provides for sale opportunity in the area of points 2 and 4. The trader expects that the large “bear” will be able to complete the formation of the “broadening wedge” pattern. Protective stop-loss orders are placed in the area of the previous cluster (conservative approach) or at the level of maximum price fluctuation (aggressive approach). The exit from the position is carried out using a trailing stop.
Broadening wedge pattern on AUD/JPY chart
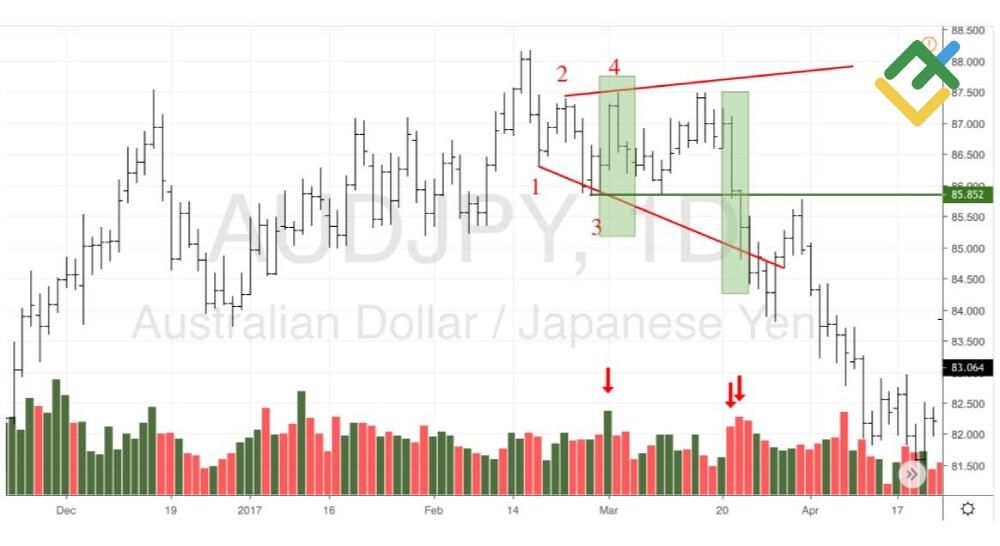
On the daily AUD/JPY chart, as well as in the case of EUR/AUD, a bar with a wide spread and increased volume appeared within the trading range. Following it an upthrust was formed. A large "bear" has shown itself because when everyone is buying, there is a great opportunity to sell. It is waiting for its turn. While we count on a breakthrough of support line near point 3. It goes on high volumes, which confirms the trend reversal.
Trading strategy for the "broadening wedge" pattern on the AUD/JPY chart
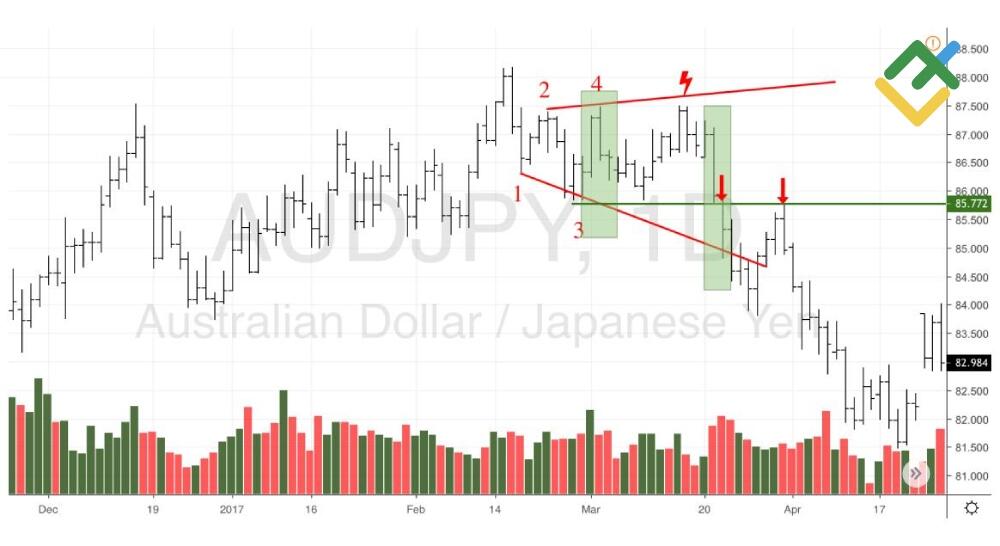
We can open a short position both on the support breakthrough and on the retest. A stop-loss order is set at the level of the previous local maximum, a trailing stop is used to close the short position.
Thus, the combination of price action and VSA-analysis allows you to find yourself in the same boat with major players, which is at least equivalent to the ability to survive in the waters of such a turbulent river as Forex.
P.S. Did you like my article? Share it in social networks: it will be the best "thank you" :)
Useful links:
- I recommend trying to trade with a reliable broker here. The system allows you to trade by yourself or copy successful traders from all across the globe.
- Use my promo code BLOG to get a 50% deposit bonus on the LiteFinance platform. Simply enter this code in the appropriate field when funding your trading account.
- Telegram chat for traders: https://t.me/litefinancebrokerchat. We are sharing the signals and trading experience.
- Telegram channel with high-quality analytics, Forex reviews, training articles, and other useful things for traders https://t.me/litefinance
Price chart of EURAUD in real time mode

The content of this article reflects the author’s opinion and does not necessarily reflect the official position of LiteFinance broker. The material published on this page is provided for informational purposes only and should not be considered as the provision of investment advice for the purposes of Directive 2014/65/EU.
According to copyright law, this article is considered intellectual property, which includes a prohibition on copying and distributing it without consent.