Evaluating Forex Strategy Effectiveness Using Sharpe Ratio
How to evaluate the effectiveness of a trading system or strategy on the Forex market. Sharpe ratio: definition, calculation formula, examples of calculation manually and using Excel
How do we evaluate the effectiveness of the strategy? Profitability is not the most important indicator, as risks increase with higher profitability. The effectiveness of capital management strategies with regards to the risk level can be calculated using the Sharpe ratio, which is used to analyze the enterprise's performance on the stock and currency markets. It allows you to compare how much the risk for the strategy is higher compared to risk-free investments and whether the income is worth this risk. Read this article to find out what Sharpe ratio is and how it is calculated, and find examples of comparing the effectiveness of two strategies using calculations in Excel.
Evaluating the effectiveness of the trading system using the Sharpe ratio
Tell me, how do you assess the effectiveness of the trading system, strategy, or advisor? As practice shows, novice traders don't really think about it. They just start trading the strategy on a demo account and if they get profit, the strategy is effective, if they lose the deposit it isn't. Successful professional traders analyze the equity curve, test the strategy on different currency pairs, estimate the ratio of profitable and losing trades, maximum drawdown, etc. (Read more about the analysis methods here). There are also those who remember: the greater the profit, the greater the risk. The question arises: how do you develop a strategy that is optimal in terms of profit and risk? Which is better: low or high profit and risk? This is where the Sharpe ratio comes to the rescue.
In this review you will learn:
- What the Sharpe ratio is, why and when it is used.
- How to calculate the Sharpe ratio manually. Example of evaluating the effectiveness of the strategy.
- Improved Sharpe Ratio (modifications and additions to the tool).
What is the Sharpe ratio?
Suppose there are two investment strategies: bank deposits with an interest rate of 8% per annum and cryptocurrency investments, where the annual yield may be more than 1000%. From the point of view of profit, investments in cryptocurrency seem more attractive, but remember that in 2018, BTC lost more than 80%, while bank deposits brought their investors a steady annual income. In the short term, cryptocurrency was in a better position, but because of the high risk, cryptocurrency investors suffered losses in a year, while the depositors got a stable income.
The idea of calculating this coefficient belongs to the Nobel laureate William Sharpe, who was the first to offer a fairly simple model for assessing risks with respect to profits. In 1990, he received a Nobel prize for his Capital Asset Pricing Model (CAPM), and today the coefficient he developed is used not only in investing and trading, but also in the economy of enterprises.
The Sharpe ratio allows you to:
- Compare the risk/return ratio of various investment options.
- Assess the effectiveness of strategies within a single investment option (the risk/return ratio of different investment portfolios, Forex strategies, advisors, etc.).
- Select a more attractive strategy in terms of minimizing risk with the same return.
The Sharpe ratio shows how much more income the strategy brings compared to the base interest rate, investments in which are considered completely risk-free. The ratio formula is as follows:
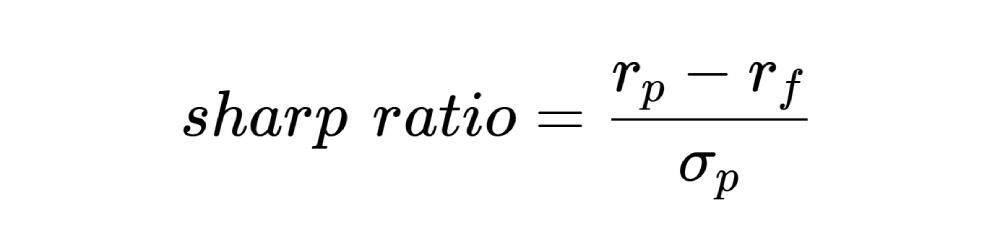
- rp – return on an asset for a fixed period. The period can be a day, month, year. Instead of profitability, you can use its increase in comparison with the previous period. Since the coefficient is not without flaws, it is recommended to calculate the coefficient in different ways for different periods, eventually creating a digital array for each strategy. For deposits, the return is the bank rate, for Forex it is the MT4 data that can be obtained, for example, in a backtest.
- rf – risk-free income. In theory, this is the guaranteed income with zero risks. In practice, any investment implies varying degrees of risk. Therefore, when evaluating the investment portfolio, its return is compared with the US Treasury bonds, which are considered one of the most reliable instruments in the world. For foreign currency assets, you can take the discount rate or the base rate for the deposit. The most important rule is to take relatively similar data for each investment strategy. For example, if the efficiency of investing in German stocks is estimated, then for comparison with deposits or investments in euros you need to take similar data for Germany, and not, say, the United States.
- σp – standard deviation. Manually, it is calculated as follows: suppose there is a return over 5 periods. We find the arithmetic average of the return. Subtract it from the return for each period. The result for five periods is squared, added, divided by the number of periods minus 1 (5-1=4, in this case). Then we extract the square root from the result. In Excel, you can use the STDEV function.
When comparing strategies on Forex, there is no risk-free income, as there is no benchmark with near-zero risk in the over-the-counter market. In MT4, the Sharpe Ratio for Forex Trading is the ratio of arithmetic average profit (average income over a period) to standard deviation. How effective this approach is a rhetorical question. After all, the absence of risk-free income increases the coefficient, thus distorting the result. If we are talking about the comparison of investing in different currency pairs on Forex, then it should not be taken into consideration. But if we compare Forex and the stock market, it would make sense to take the same risk-free return for Forex as you did for stocks (for example, the above-mentioned yield of treasury bonds).
The standard deviation on Forex is asset volatility for the analyzed period. If the numerator uses return for 6 months, then the volatility parameter is for a similar period.
Sharpe ratio values:
- 1 and more – optimal value for an effective strategy or performance of an investment portfolio. The higher the ratio, the better.
- To 1 – the strategy is far from optimal, there are excessive risks, but it still can be used.
- Less than 0 – the strategy is not recommended, management of the investment portfolio is inefficient.
If two strategies have the same return but the Sharpe ratio of the second strategy is higher, it means that it is less risky.
Examples of calculating the effectiveness of the strategy using the Sharpe ratio
Example 1. This is a very simplified example of a calculation that is used for superficial analysis. Suppose that the strategy has the following conditions:
- Initial deposit – $150.
- The trading period – 1 week.
- Return – 20% ($30).
- Volatility – 50 points. If the standard deviation is used more often in the stock market, on Forex we use volatility with the formula that includes historical volatility, arithmetic average, the number of candlesticks analyzed and the number of price changes. It is easier to use the volatility calculator.
The Sharpe ratio is 30/50 = 0.6.
The value of the coefficient is not great, but the strategy can still be used. However, there is a nuance: if a trader somehow gets a relatively high income with small volatility, it makes sense to examine the strategy in more detail. Low volatility means a flat, and you will not earn much on a flat.
Example 2. In the previous example, one period was taken as the basis, and volatility was used as the standard deviation. Now we will take a look at a more realistic example. The table below shows the profitability of two strategies in a year with a monthly breakdown.
Month | Return of strategy 1, % | Return of strategy 2, % |
January | 27 | 24 |
February | 35 | 40 |
March | 34 | 33 |
April | 26 | 21 |
May | 28 | 18 |
June | 30 | 31 |
July | 30 | 30 |
August | 37 | 42 |
September | 31 | 35 |
October | 25 | 15 |
November | 30 | 39 |
December | 27 | 32 |
Average return | 30 | 30 |
The average annual return is the same for both strategies, but already at this stage, we can see that the second strategy is less stable due to the fact that it has a larger deviation of monthly income from the average value. Now we calculate the standard deviation of the first strategy.
Month | Return of strategy 1, % | Return minus average return, % | Difference squared, % |
January | 27 | -3 | 9 |
February | 35 | 5 | 25 |
March | 34 | 4 | 16 |
April | 26 | -4 | 16 |
May | 28 | -2 | 4 |
June | 30 | 0 | 0 |
July | 30 | 0 | 0 |
August | 37 | 7 | 49 |
September | 31 | 1 | 1 |
October | 25 | -5 | 25 |
November | 30 | 0 | 0 |
December | 27 | -3 | 9 |
Add the difference squared, divide by 11 (the number of months minus 1), extract the root. We get a standard deviation of 0.04. For the second strategy, a similar calculation will give a deviation value of 0.09. Since the numerator of both strategies is the same, it is logical that the Sharpe ratio in the first strategy (30%/4%) will be higher than in the second (30%/9%).
Example 3. For investment portfolios, the calculation formula is much more complicated, since we need to take into account the yields of individual securities. Here it is easier to create an Excel table from the data array and uses the formulas AVERAGE and STDEV.
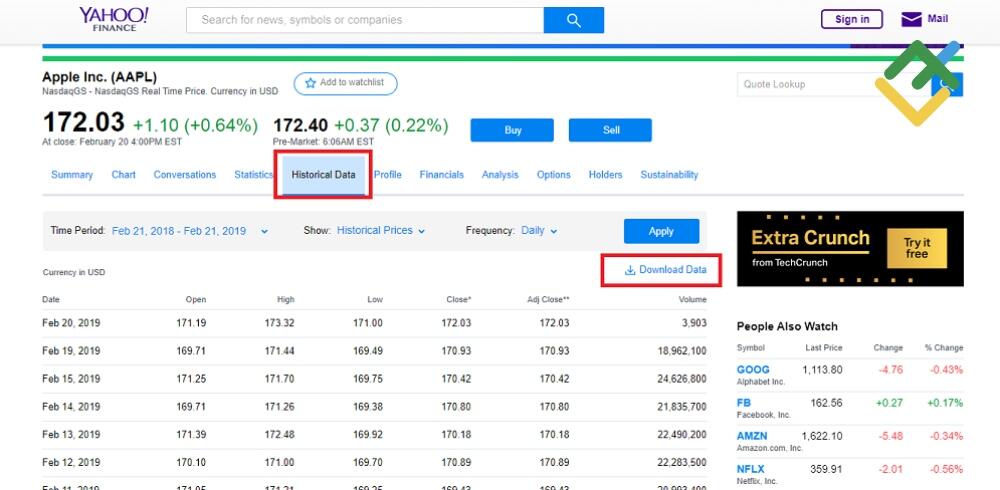
There are many ways to get statistics on the daily value of shares, but there is not always a download option. I suggest using finance.yahoo.com. This is an analytical portal with a stock screening, which provides the possibility of daily analysis.
finance.yahoo.com/quote/AAPL/history?p=AAPL This link will show you the information for Apple.
If the file does not convert to Excel properly(all data is in one cell), we use the formulas LEFT and RIGHT. Stock yields can be calculated only from the second day by subtracting the closing price of the second day from the first (find the Excel file with calculations here).
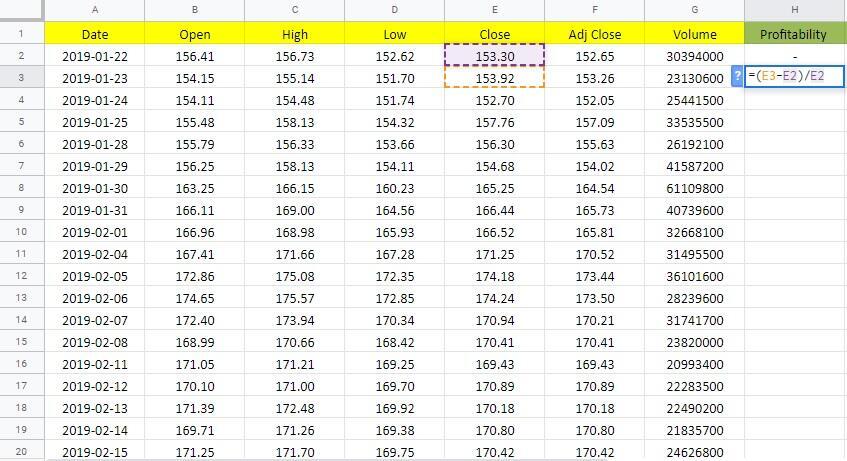
We stretch the return cell to the end of the array. The average return value for each day during the month is calculated in the next column using the formula AVERAGE (I3:I22). Another option: select the entire yield column and look at the bottom panel of Excel, where it also shows the average value. In this case, it is 0.6%.
Now you need to calculate the risk-free return for 1 day. Let us assume the return of treasury bonds is 5%, and there are 365 days in a year. Return per day is 0,0137%. All the data for the calculation of the numerator of the Sharpe ratio are ready. Now we calculate the relative deviation. We need no intermediate actions for the calculation, we have this function in Excel. Enter STDEV (I3:I22)
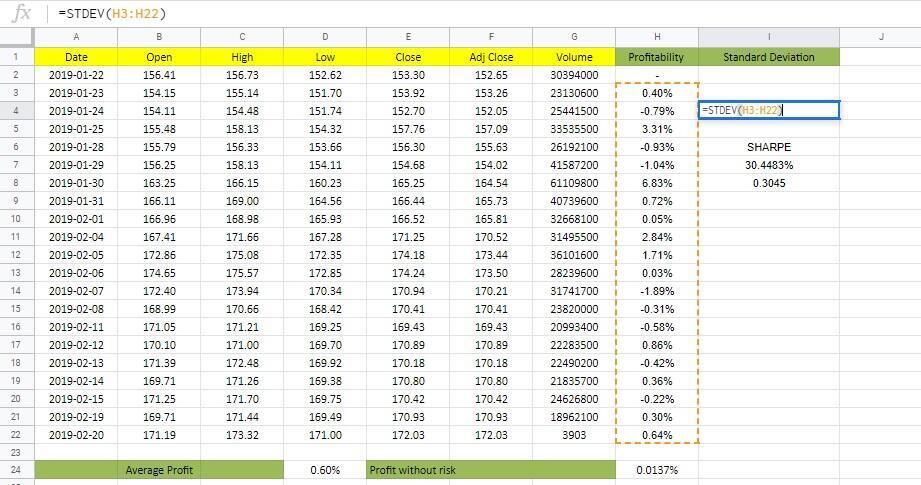
In this case, the standard deviation is 1.93%. Make sure all numbers are in the same format. In Excel, percentages and the number of decimal places are set up by clicking the right mouse button and choosing Cell Format in the menu.
Final touch: we subtract the profitability of the risk-free asset from the average income and divide the result by the standard deviation. Sharpe ratio is more than 30%, or 0.31, which is less than 1. Therefore, Apple shares are not the best investment idea, although still acceptable.
The principle used in the example with securities can also be used for Forex if you convert daily trading statistics to Excel. Example 2 includes analysis data for one year, which can be calculated manually in 15-20 minutes. Daily analysis for a year in Excel will show some intermediate areas where the risk strongly deviates in one direction or another. Seeing these deviations in the daily or weekly section, one can estimate the strength of the influence of the fundamental factor on the strategy. If you have any questions, you can ask them in the comments.
Disadvantages of Sharpe ratio:
- There is no single recommendation on which values should be used in the formula. Depending on whether we take the discount rate or the deposit rate as a basis for the risk-free income, the coefficient will be different. Therefore, the coefficient is used for relative comparison, without being tied to the values.
- Due to inaccuracies in calculations, it is not enough to compare one coefficient value of each strategy. The following discrepancy means a deeper study of the strategy results is required: the coefficient of the first strategy is better for one period (or calculation method), while that of the second is better for the other.
- It is undesirable to compare radically different strategies where the risk difference is obvious. For example, investments in gold and cryptocurrency.
The difference in approaches to the calculation method creates inconveniences. For example, you need to compare the effectiveness of your own strategy with the trade of a PAMM manager, then a problem arises. Some services calculate the Sharpe ratio automatically. But if you try to calculate it yourself, the result may differ drastically. What can you do? Recalculate the ratio based on your own method (after all, it is the comparative analysis that is important). But does the PAMMaccount description have the necessary data?
You also see Sharpe ratio when developing your own strategy in System Creator (a program for creating automated trading systems based on a given strategy). In addition, there is a standard deviation in the MyFxBook monitor.
Improved method of calculating Sharpe ratio
Many tools have modified versions. The authors who proposed modified formulas thought that the basic calculation method was too simplified and expanded it with mathematical statistics.
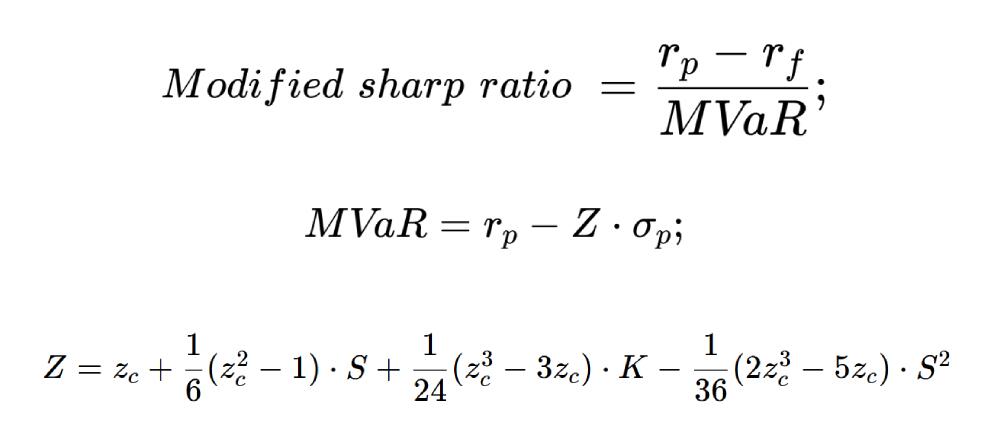
Improved Sharpe ratio formula:
- rp – the average value of return on investment portfolio.
- rf – the average value of return on risk-free asset.
- σp – standard deviation.
- S – the excess of distribution of portfolio returns, zc – kurtosis, К – quantile.
Excess, kurtosis and quantile are the concepts of econometrics and mathematical statistics. It is up to you whether you should explore them in detail. This formula is applicable to the assessment of the securities portfolio, it has nothing to do with the situation on the currency market.
Conclusion
Sharpe ratio is based on three indicators: income (average and broken down into periods), risk-free rate, and standard deviation. It allows you to compare the effectiveness of strategies but works best with the same type of strategies. The value of the coefficient for a particular strategy itself does not matter, it is compared with the coefficients of other strategies. If you have questions, ask them in the comments. If you do not agree with any of the calculations (including mathematical ones), I also invite you to the discussion.
P.S. Did you like my article? Share it in social networks: it will be the best "thank you" :)
Useful links:
- I recommend trying to trade with a reliable broker here. The system allows you to trade by yourself or copy successful traders from all across the globe.
- Use my promo code BLOG to get a 50% deposit bonus on the LiteFinance platform. Simply enter this code in the appropriate field when funding your trading account.
- Telegram chat for traders: https://t.me/litefinancebrokerchat. We are sharing the signals and trading experience.
- Telegram channel with high-quality analytics, Forex reviews, training articles, and other useful things for traders https://t.me/litefinance
The content of this article reflects the author’s opinion and does not necessarily reflect the official position of LiteFinance broker. The material published on this page is provided for informational purposes only and should not be considered as the provision of investment advice for the purposes of Directive 2014/65/EU.
According to copyright law, this article is considered intellectual property, which includes a prohibition on copying and distributing it without consent.