As it is known, a currency rate is affected by many factors.
Let's name the fundamental factors:
- state of commodity market which represents the economic life of a country or region, its supply/demand and productive forces;
- monetary policy of сentral banks which affects the size of interest rates, the cost of money, interest in foreign currencies;
- state of the labour market which indicates the rate of economic growth of the country characterizes commercial activity;
- business activity which represents production, commercial activity;
- external and geopolitical factors: known political risks, spontaneous social risks, natural hazards, and so on.
Today we will talk about the main fundamental economic factors and their impact on exchange rates.
The article covers the following subjects:
Some of the features of the analysis of the economic indicators in the Forex market
The largest group is formed by economic ones, which can be interpreted with the help of indicators regularly published in Forex.
The list of economic indicators in Forex includes great domestic product, producer price and consumer prices indexes, unemployment rate, dynamics of housing building, business activity index, etc.
It is useful to analyze economic indicators in the exchange market for several reasons regardless of an investor’s trading type.
- Classification the indicators by their importance enables to forecast a quotation movement; a surge in the rate after a renewed indicator release can reach 200 points and more in just a few hours.
- News background has a direct influence on the rate dynamics and often contradicts technical indicators. Such a disparity can cause losses which could have been avoided.
- The understanding of economic processes allows feeling the market better.
- It should be borne in mind that traders reacting to the economic indicators release analyze the secondary information. This information has been given them by the news companies, which have got it from special agencies calculating the major indicators. The market does not always change its course after such news release but it always becomes more active.
As a rule, the indicators of those currencies are followed which form a trader’s portfolio. Almost always it includes the USA dollar, Japanese yen and the pound sterling. All the most important indicators are presented in Forex economic calendar and this considerably simplifies trader’s work.
A list of planned economic events:
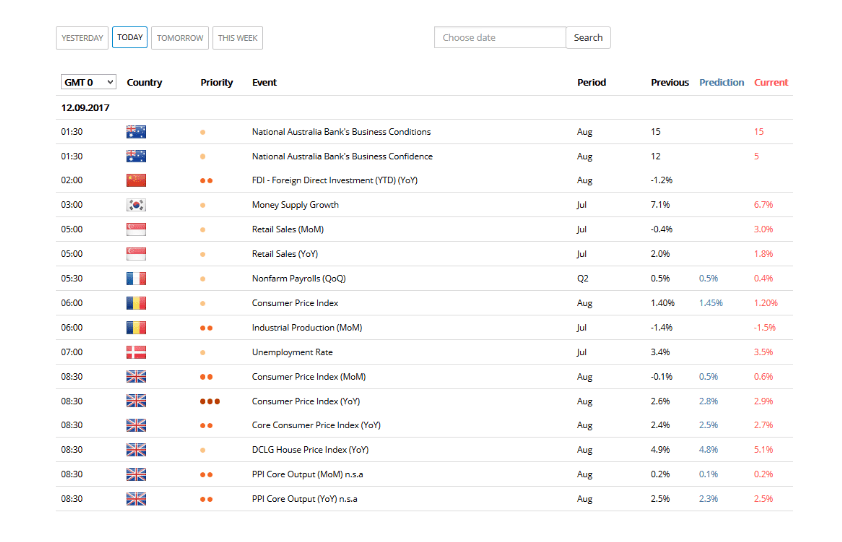
The indicators with current values significantly different from predicted ones have the greatest influence on the market. For example, expecting the Bank of Canada not to change the interest rate, traders are not going to carry out any speculation or revise the rate dynamics. However, if the rate is reduced, the upward trend is likely to start in the market.
The following indicators have the greatest influence on the market:
- Indicators of the general economic performance of the country. (GDP and GNI, consumer prices and production prices indexes, inflation level, interest rate, export surplus);
- index of employment (unemployment rate, jobless claims);
- indexes of industrial production (business activity index, industrial production index, amount of nonfarm payrolls, volumes of housing construction, the volume of durable goods orders)
The major indicator is the gross domestic product. All the other data are interpreted from the point of view of if there are any economic problems and what influence they will have on the production level. GDP is released quarterly, and the predictions of its dynamics are renewed every month.
Gross domestic product is the total value of everything produced by all the people and companies in the country during a certain period of time. One of the most well-known ways of GDP calculations is by the expenditures. According to it, GDP is a sum of personal consumption expenditures, government spendings, business investment and net export (the difference between export and import). Such a structure shows that GDP growth should not always be interpreted positively. When it grows due to the growing government spendings a currency rate can easily go down. This is because the list of such costs includes military spendings which further can destabilize the economy in the country.
Gross national income is considered more seldom than GDP but it indicates the volume of production only by the residents of the country. The comparison of GDP and GNI shows who earns more, residents of the country working outside the country or non- residents, whose companies work inside the state.
Inflation level and correspondingly the rate of the a national currency depreciation can be followed by several indicators; consumer prices index CPI, production prices index PPI and inflation rate.
CPI indicates a commodity bundle cost which includes the most necessary goods and services. Production prices index unlike CPI doesn't include retail margin or imported goods prices. Every month this indicator shows the rise of prices for semi-finished products, components and end products.
Interest rate, which is determined by the central bank, is the indicator the economic situation in the country.
If inflation growth is accompanied by interest rate rise, a country’s economy is likely to have middle-term or short-term problems which can't be solved by market forces. From the investors’ point of view, the increase of interest rate causes a currency appreciation, its reduction causes a national currency depreciation.
Trade balance indicates the ratio of imported foreign goods volume to that of exported goods.
If the country’s export exceeds its import, the national currency is strengthened and vice versa. The dynamics can be analyzed through an export surplus. Sometimes the dynamics of import and export prices and current account deficit is used for analysis.
Money market and monetary policy
The monetary policy of central banks is the most important indicator of currency dynamics. In a sense, the monetary policy reflects the reaction of central bank officials to the general state of economic life in the country.
The Bank of Japan regulates the yen, the Bank of England regulates the British pound sterling, and so on. And since the currency itself is an instrument for regulating economic relations, the cheapening or appreciation of money affects the prospects of certain economic spheres.
How monetary policy affects the currency
There are two types of monetary policy:
The cheap money policy is the policy of a central bank which has its aim in reducing the value of money. This policy is carried out at the expense of low interest and discount rates at which commercial banks borrow money from the central bank. This leads to a decrease in the purchasing power of the national currency and serves as a stimulus for the growth of business activity in the markets. As a rule, an easing monetary policy environment (even if only predicted) leads to a bearish trend for the currency.
Tight (or dear) money policy is an anti-inflationary policy. The central bank limits the money supply by increasing the rate at which commercial banks are credited.
Expensive money policies lead to a bullish trend for currencies and a bearish one for stocks.
Due to the increase in the purchasing power of one currency in relation to other competing currencies, manufacturers and exporters remain unable to provide competitive prices for their goods in the markets.
However, there are also quite paradoxical situations. The victory of Donald Trump in the 2016 US presidential election which pushed the dollar to 11-month high due to a changed outlook in monetary policy, is a prime example of this. Not only was the victory itself paradoxical, but also its impact on the monetary policy.
Despite Trump's open advocacy for cheap money, protectionism, and enterprise development, this economic part of the electoral agenda was perceived by economists and investors in exactly the opposite way. And it is no coincidence, because the prospects for strengthening business activity cover obvious risks of cheapening money, and hence accelerating inflation. Trump's victory signalled a bullish trend in Fed rates for December, raising the likelihood of an event from 75% to 85%, according to CME Group's FedWatch tool.
Labour market and employment
When analyzing a country’s economy the attention should be paid to the unemployment rate and the number of jobless claims. Although the indicators are lagging they help us to learn about the state of the economy more thoroughly. The unemployment rate is the ratio of unemployed people in a country to the labour force. It includes only people who are interested in finding work, except for students, those not working on principle, etc. Weekly release of jobless claims number allows to rapidly assess in the dynamics employment rate. It should be borne in mind that this indicator is subjected to seasonal fluctuations, that is why it is more often used as reference information and doesn't raise volatile swings in the markets.
A thriving labour market indicates a bullish trend in the local currency.
A weak labour market, unemployment and rising benefits indicate a bearish trend.
The best known and the most significant indicator, which is the base of some trading strategies on news, is Non-farm payrolls. It is the number of people employed in nonfarm sector.
The indicator embraces more than ¾ of all employment in the USA but doesn’t include those who are employed in agriculture, government structures, private household and non-profit sector. The indicator representative because the employment growth causes the rise of population income. This in its turn causes consumer expenditures which influences GDP.
Release calendar of the basic economic indicators for the USA dollar
| Indicator | Country | Release frequency | Release date | Release time | Importance |
| GDP | USA | once a quarter | every last Thursday of the month | 13:30 UTC | high level |
| Durable goods orders | USA | once a month | the fourth week of the month | 13:30 UTC | medium level |
| PMI | USA | once a month | the last working day of the month | 13:30 UTC | medium level |
| CPI | USA | once a month | between the 15th and the 20th day of the month after PPI release | 15:30 UTC | high level |
| PPI | USA | once a month | about the 15th day of every month | 14:15 UTC | medium level |
| Number of jobless claims | USA | once a week | every Thursday | 13:30 UTC | low level |
| Balance of payments | USA | once a quarter | about the 15th day of every month following the reporting period | 15:00 UTC | high level |
| Retail sales | USA | once a month | about the 13th day of every month | 13:30 UTC | medium level |
| Trading balance | USA | once a month | the third week of the month | 13:30 UTC | high level |
| Unemployment rate | USA | once a month | the first Friday of the month following the reporting period | 13:30 UTC | medium level |
| Non-farm payrolls | USA | once a month | the first Friday of the month following the reporting period | 13:30 UTC | high level |
Industrial production indicators
The base of any country’s economy is its industrial sector. For its assessment, both objective quantitative data (PPI - industrial production index) and subjective survey-based date (PMI - non-manufacturing business activity index) can be used.
Industrial production index indicates the total output of all manufacturing of the industrial sector.
This indicator is often used as a leading one for GDP; it is also used to predict GDP dynamics.
Non-manufacturing business activity index is based on surveys of purchasing and supply managers who answer the questions about new orders, production land employment levels, amounts of materials supply and stock. The response options are “better”, “unchanged”, “worse”. The sum of replies is interpreted to the scale of 0 to 100. The indicator’s positive dynamics compared to the previous periods is interpreted positively by markets, and the negative dynamics cause a decline in a currency rate.
Industrial production indicators can indirectly attribute such factors as retail sales dynamics, volumes of new housing construction and durable goods orders.
The interpreting of all three indices is the same, the more money consumers are ready to spend at the moment, the higher their expenditures are. Furthermore, expenditures growth means that buyers assess the development prospects positively and expect their financial condition to improve further in future.
Securities market and business activity
Despite the Forex traders' dislike of working with traditional asset classes, it is absolutely necessary to devote time to analyzing the biggest events in the stock markets. Stock market data reflect its total capitalization and liquidity, which are tied to the inflation rate and the monetary policy of the сentral bank.
The growing stock market indicates a bullish trend in the currency, reflecting the ability of producers of goods and services to borrow at higher interest rates. Central banks, in turn, see this as a prospect for tightening monetary policy.
The weakening labour market is forcing the central bank to stimulate production activity in the country by lowering the rates at which commercial banks take loans.
You can watch stocks fall on days when the currency they are pegged to becomes a top gainer against other competing currencies. The demand for currency leads to higher prices of goods and services, undermining consumer activity and the competitiveness of companies in the markets.
Politics and other factors
It is practically impossible to number all the factors that affect the world currencies. However, Trump's victory in the U.S. presidential election is an interesting event for analysis. Despite the polls largely at her side, Hillary Clinton lost the election to the Republican nominee. The markets, however, could adapt to Trump's victory quite soon. For example, the European financial sector as well as cyclical stocks grew to the 6-month highs in days. It means that every bearish trend for a currency is most often a bullish trend for other assets: the weak currency allows for investments in traditional assets, making the goods cheaper and thus more competitive.
But if we return to the European migrant crisis or, say, the Brexit referendum that pushed the British pound to the 30-year lows, we can see a cyclical decline of all spheres. The catastrophic state of the economy makes investors unwilling to buy both government bonds and private company stocks. Only the biggest players, such as whole countries, can win from such events.
Spontaneous factors, such as cataclysms, passenger planes crashes, terrorist attacks and other risks, deserve an altogether separate topic. It is simply impossible to take all of them into account but they constitute only a small part of events in a series of many regular economic processes.
Using those economic indicators described above you can always stay up to date with the latest events in the Forex market and make long-term forecasts for the main currency pairs.
Good luck in your trading!
P.S. Did you like my article? Share it in social networks: it will be the best "thank you" :)
Useful links:
- I recommend trying to trade with a reliable broker here. The system allows you to trade by yourself or copy successful traders from all across the globe.
- Use my promo code BLOG to get a 50% deposit bonus on the LiteFinance platform. Simply enter this code in the appropriate field when funding your trading account.
- Telegram chat for traders: https://t.me/litefinancebrokerchat. We are sharing the signals and trading experience.
- Telegram channel with high-quality analytics, Forex reviews, training articles, and other useful things for traders https://t.me/litefinance

The content of this article reflects the author’s opinion and does not necessarily reflect the official position of LiteFinance broker. The material published on this page is provided for informational purposes only and should not be considered as the provision of investment advice for the purposes of Directive 2014/65/EU.
According to copyright law, this article is considered intellectual property, which includes a prohibition on copying and distributing it without consent.