Principles for evaluating strategies and expert advisors for backtesting and equity, analysis of the deposit curve, calculation of the optimal number of trades for testing
To assess the prospects of investing in the PAMM account, choosing a trader to copy trades or choosing the most effective strategy, several characteristics must be analyzed. In this article you will learn what parameters are used to analyze the strategy backtest, how to know the strategy type by equity and how to analyze the backtest curve, how to calculate the optimal number of trades for testing, and also get acquainted with the general rules for evaluating the trading system.
Principles of evaluating the effectiveness of the trading system
The need to assess the effectiveness of the trading system can arise in several cases:
- making a decision on investing in a PAMM account of a certain manager, for which it is required to evaluate the effectiveness of their trade;
- analysis of the trader's trading system for copying their trades;
- comparison of the performance of several trading systems (strategies, advisors) and choosing the optimal one from the point of view of profit to risk ratio;
- evaluation of the payback of an expert advisor in the event of its purchase;
- fixating the main parameters of the trading system. In case of the system performance deviating from statistical indicators (for example, sudden growth of maximum drawdown or a series of loss-making trades), trade stops until the reasons are clarified or the settings are optimized.
Imagine that you see the results of a trading system testing on a fixed time interval. The deposit curve (equity) is ascending, the maximum drawdown is within the established risk management, the profit is quite satisfactory. Can the trading system be considered successful? No, because this information is not sufficient to make an informed decision. In this article I will try to outline in general terms the following questions:
- what are the parameters to assess the efficiency of the trading system;
- how to assess the nature of equity;
- how many trades are considered optimal for system testing.
1. Parameters for evaluating the effectiveness of the trading system
The trading system is usually evaluated based on the backtest downloaded from MT4.
Important! The main indicators of the backtest are analyzed, but their cross-checking is important too. Unfortunately, it is not unusual for PAMM managers, traders whose trades are copied, or developers of trading systems not only show a demo account test, but also forge the backtest.
Main parameters for evaluating the backtest:
- net income (total revenue minus total losses). This is not the most important indicator, but traders pay attention to it first of all. It is used to decide whether it makes sense to use this trading system at all. Also, this figure is included in the formula for calculating walk forward efficiency (WFE) - the ratio of the total profit for the year received on the main account to the profit for the year received during the test period;
- profitability. The ratio of the total profit for the test period to the total loss. For a stable trading system, the value must be at least 2. A smaller value is allowed, provided that the parameter is evaluated together with the maximum drawdown and profit;
- most profitable and unprofitable trades. The size of the most unprofitable trade should not be close to net profit. In other words, if the parameter approaches the net profit, the system has obvious problems with risk management. Pay attention to the reasons for the peak values, they can be market anomalies (sudden price spikes that are not systematic and do not repeat in the future). The risks of anomalies are accounted for in risk management, but are excluded when analyzing the test;
- maximum drawdown. Maximum deposit reduction indicating the stability of the system;
- series of loss-making and profitable trades. The indicator used to decide whether you should stop the trading or not. If on a real account, a series of loss-making trades is longer than the one in the test, the trading stops;
- recovery factor. The ratio of net profit to the maximum drawdown. The adequate value is 3, but the indicator is analyzed together with the time interval of the test;
- total number of trades and time interval. See the 3rd section for information on how many trades are considered optimal.
The results of testing on the demo and on the real accounts will differ - the performance can be worse on the real account. If the actual results have a strong deviation from the test data (the degree of deviation depends on the individual propensity to take risks), then the trading stops.
2. Evaluating the nature of the deposit curve
The form of equity not only shows the effectiveness of the trading system, but also provides an opportunity to outline the basic principles of its operation. Evaluating the nature of the deposit curve allows you to get a general idea of what strategy the trader is using. At this stage, traders who use high-risk tactics, including Martingale, are most noticeable. One of the approaches of evaluating the trading system by equity is testing the system on a minimum lot without risk management parameters included. There are other approaches: comparing equity with the maximum and minimum lot or adjusting the lot in the testing process. The trader's decision is individual, but there are several general requirements for equity.
Principles of evaluating the deposit curve:
- ideal equity is a line uniformly ascending from the bottom left corner of the graph to the upper right. Absence of fluctuations means stability of the system to various kinds of market shocks. Typically, such systems are characterized by a minimal drawdown and a small profit. The angle of equity can be different, but it must be upward. Sharp upward jumps (one-time profitable large trades) are undesirable, since they can be anomalies and can distort the results of testing. It is desirable that the system should open small but frequent positions instead of one large position;
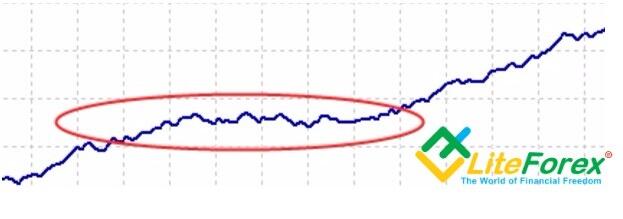
- drawdowns must be minimal, followed by rapid recovery. A decline in the effectiveness is characterized by the appearance of shelves - horizontal sections on the chart. If the shelf length is 6 months with a test period of 5-6 years, it is better not to use the trading system, because on a real account the shelf can turn into a recession;
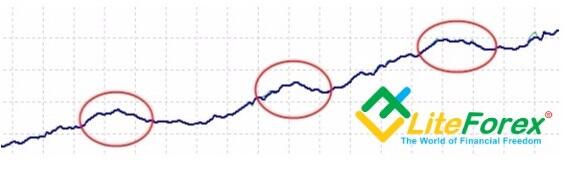
- each subsequent high of the deposit curve must be higher than the previous one. Straight equity line is rather theoretical; in practice the curve will be undulating. And if each peak of the next wave is higher than the previous one, the system is considered optimal;
- Maximum attention should be given to the last period of equity (the last 1/5 of the chart). The curve must have a steeper (or the same) upward nature. This indicates that in the latest market conditions, the system is more efficient than in previous periods. If there is saturation in the last period (the curve gradually assumes horizontal nature in comparison with the previous periods), then it is likely that it will soon show a loss.
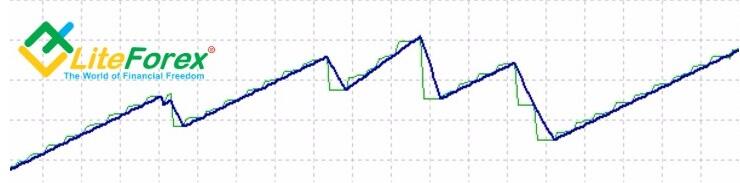
- The nature of the strategy is evident from sharp jumps and sharp corners of the equity. Below is an example of the curve of a trader working based on Martingale system:
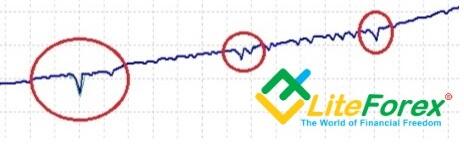
Another example of the strategy of a trader who prefers scalping: a short horizon of profit with distant stops. Steps appear where stop orders rarely work:
Another example of the strategy of a trader who prefers scalping: a short horizon of profit with distant stops. Steps appear where stop orders rarely work:
Tip: when evaluating someone else's strategy, focus not only on the nature of the deposit curve or the backtest, but also on how open the trader is. It is best if the trader's account is tied to MyFxBook and the trader will provide you with an investor password. There will be at least two notes that the service itself has already checked the trader's identification and the account's backtest is real.
3. Optimal number of trades for testing an advisor
The answer "As much as possible" is not objective. On different instruments, the effectiveness of one and the same strategy can be radically different for different reasons:
- Different volatility levels;
- Different frequency of entry signals due to more frequent or rare coincidence of combinations of technical analysis tools.
Also, the problem is complicated by the fact that the classical MT4 terminal does not have the ability to multitest (simultaneous testing for several pairs). This prevents the simultaneous evaluation of the same combination of settings.
The number of trades depends on the frequency of position opening. For example, an intraday strategy analyzed over an interval of 12 months with 250 transactions will more accurately reflect the effectiveness of the system than a scalping strategy with 400 deals in a 1-month interval.
For a conservative strategy, 200-300 transactions with an interval of 5 years will be enough. Below you can see the graph of the dependence of the standard statistical error on the number of open positions.
Number of trades
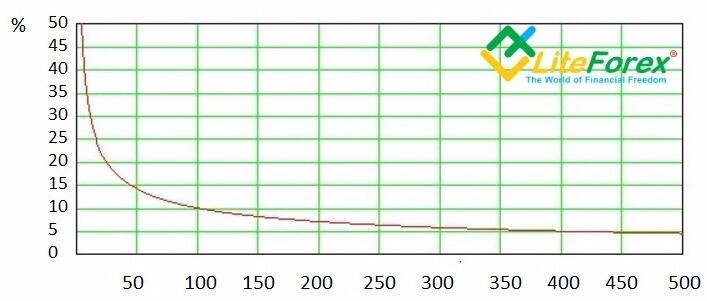
We can see that in the first section below 50 trades the margin of error is the highest, i.e. every additional 10 trades significantly reduce the probability of error. Saturation occurs on the section of 100-300 trades. If the first 100 trades reduced the error by 30-35%, then in subsequent sections to reduce the error by only 3-5%, the number of trades had to be increased by 100-200. In other words, based on the chart, the system will be equally optimized for both 300 trades and 500.
Another way to determine the right number of trades is to expand the sample and analyze the change in equity. The trading system, which is objectively optimized, shows the same stability on different numbers of trades. For example, there are two different trading systems, which on an equal number of trades show a similar result. We increase the number of trades, add filters and see that one trading system has remained stable, while the second did not. Graphically it looks like this:
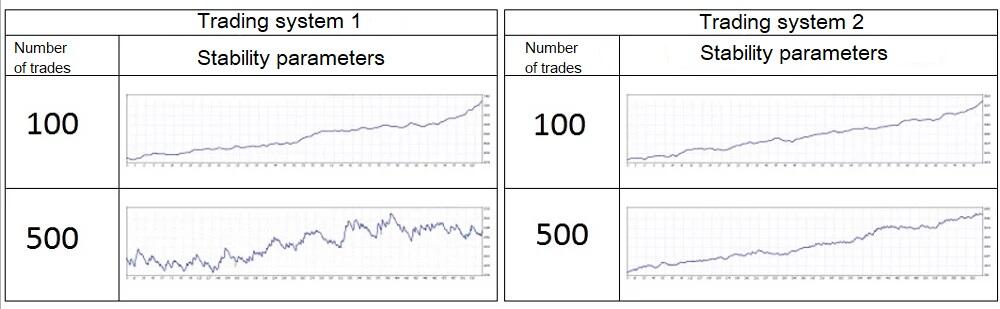
The second trading system looks more attractive in terms of use on a real account. This example shows that with an equal number of open positions, the credibility of the strategy can be different. Hence the conclusion: you can only reduce the number of trades if there is confidence that the system will remain stable.
And finally, some general rules for evaluating the trading system:
- try to evaluate the trading system as objectively as possible. A common mistake is to indulge in wishful thinking;
- when evaluating, do not use the zero bar to avoid distorting the test result;
- quotations should be as accurate as possible. It happens quite often that the testing on quotations received from one source for one asset is very different.
- the parameters set in the trading system settings must match the properties of the currency pair. Each pair has its own individual parameters, which can be viewed in the market overview by going to the "Symbols" menu (right mouse button) and clicking "Show" on the selected currency pair.
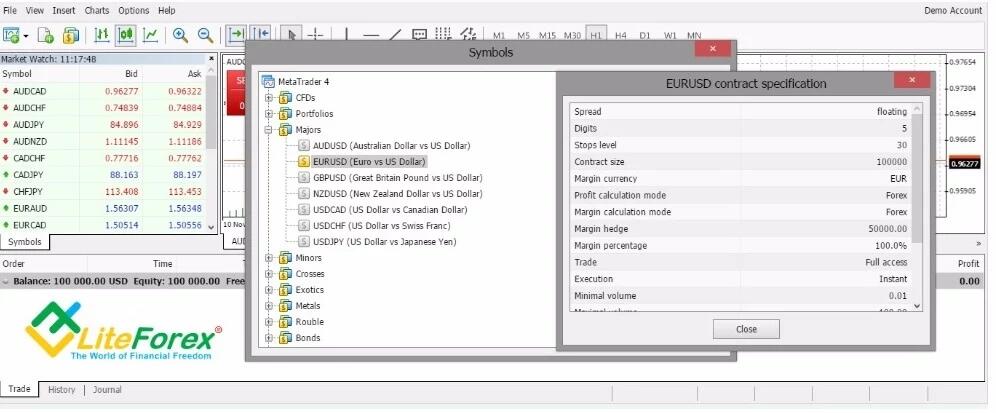
The most frequent test error codes are: 130 (incorrect stop signal) and 131 (incorrect trading volume);
- The most important testing period is the last one. For example, if the time period is 5 years, the testing is carried out in the reverse order on the interval from the fifth to the second year in the last year section. Ideally, the chosen combination of settings after testing at the last year section "outside the sample" should give a stable positive result when compared with the previous section.
Conclusion. Deep analysis of the evaluation of the trading system allows us to conclude on what potential risks await the investor who has decided to use it. Ignoring the analysis criteria can result in the fact that the assessment will not be objective, which significantly increases the risk of losing the deposit. Also, the analyzing the system effectiveness cultivates systematic approach to trading, rationality, and self-discipline in the trader. And without discipline, it will be difficult to succeed on Forex. Good luck with your trading!
P.S. Did you like my article? Share it in social networks: it will be the best "thank you" :)
Useful links:
- I recommend trying to trade with a reliable broker here. The system allows you to trade by yourself or copy successful traders from all across the globe.
- Use my promo code BLOG to get a 50% deposit bonus on the LiteFinance platform. Simply enter this code in the appropriate field when funding your trading account.
- Telegram chat for traders: https://t.me/litefinancebrokerchat. We are sharing the signals and trading experience.
- Telegram channel with high-quality analytics, Forex reviews, training articles, and other useful things for traders https://t.me/litefinance

The content of this article reflects the author’s opinion and does not necessarily reflect the official position of LiteFinance broker. The material published on this page is provided for informational purposes only and should not be considered as the provision of investment advice for the purposes of Directive 2014/65/EU.
According to copyright law, this article is considered intellectual property, which includes a prohibition on copying and distributing it without consent.