TrendWave indicator: application, settings, template, trading strategies
TrendWave is an indicator that combines the functions of a trend tool and an oscillator. Its algorithm is based on two Moving Averages, whose meeting at the key levels delivers a signal to buy or sell (the algorithm itself is a bit more complex). TrendWave can be used alone but is more efficient, as all oscillators work, in combination with other indicators. From this review, you will learn general information about the indicator settings and parameters, its work principle, you will also get familiar with its application in forex trade, and with the example of the real strategies on the basis of TrendWave, where all the features, advantage and disadvantages of the indicator applied to short term trading are clear.
Just about 10 years ago, you could find this indicator only on paid resources. At that time, it cost about $100 to download it, but now it is free. Although some “authors” still try to sell modified versions of TrendWave under different names. In this article, in the part devoted to trading strategies in the forex market, you can download the indicator and its templates via a link absolutely free of charge.
The TrendWave indicator is called a trend oscillator, and it is interesting combination of two types of technical tools. It can identify the beginning and the end of a new wave trend movement and, as an oscillator, it identifies the overbought and oversold zones.
The indicator is based on a Simple Moving Average and an Exponential Moving Average with critical price levels. When the MAs meet at the overbought or oversold zones limited by strong price levels, based on technical analysis, there is a signal that is indicated as a dot in the chart. The general algorithm of the chart formation is more complicated, and it makes no sense to study it in detail. After all, if know the programming language, you can study it on your own if you want.
Most strategies are based on the indicator reversal pattern, when its both lines meet higher or lower a particular level (depending on the assumed direction of the position you are going to open), there appears a dot that is the signal.
A few points that you should pay attention to:
- The indicator key levels are -50 and 50. A buy signal is when a dot is painted between levels –50 and -60; a sell signal is when the dot is between levels 50 and 60. If the indicator goes lower than -60 or higher than 60, this is even a stronger signal. But this rarely happens, so it makes sense to refer to the indicated range. You see it on the example of the strategies described below. It is not recommended to change the levels.
- After the dot is painted, the indicator lines should be heading outside the zone, afterwards, in one or two bars, they must cross the levels and go to zero level (middle line). Further, in the third strategy, I will give an example of the signal weakness when TrendWave paints a dot twice during 10 bars.
Indicator doesn’t often repaints, that is an obvious advantage. Another advantage is that it is useful during flat trading (you will also see that on the examples of the strategies described below).
Inputs of TrendWave:
- WavePeriod: this is a parameter that determines the algorithm inputs according to the chosen timeframe. This is the indicator period.
- AvgPeriod. This is smoothing (averaging) period (the number of bars being analyzed) applied to both moving averages (the lines of bulls and bears). The shorter is the period, the more sensitive is the indicator yo the price movements and the more there will be false signal, if you increase the parameter, this will reduce quantity of trading signals, but will make them more reliable, but they may be lagging. The indicator efficiency depends on how optimal the period is.
- SoundAlert. It is a sound notification of the appearance of trading signals. It is a useful function if the indicator plays a secondary role and you don’t have time to monitor the chart all the time. But you should bear in mind that, when you combine the TrendWave with other indicators, it will notify you only about the TrendWave signal, not about a potential entry.
- EmailAlert. This function sends you a notification about the trade signal to your email. Taking into account the frequency of trading and intraday timeframes, this function seems useless to me. But it may be convenient for you.
There is both negative and positive positive feedback about the TrendWave. You can come across a lot of criticism in the comments, for example, lagging and false signals. I think it is just a personal opinion of everybody. There are no ideal indicators, much depends on fundamental factors, on general market situation, forex trader sentiment, average volatility of the instruments and so on. So, I suggest we move on from theory to practice.
Four simple forex trading strategies based on TrendWave indicator
The TrendWave is mostly used as the primary indicator, but it will engage too high risk if your strategy works only according to its signals (although there is such a strategy described below). Advanced indicators have a very narrow range of application, so, need to use additional filters together with them in order to assess the trend strength, confirm the market overbought or oversold and so on. Oscillators are the best supplementary tools to trend indicators. You will see this in the practical examples of strategies described below.
In each strategy description, there is a link to the template archive of the indicators and the strategy. There is a guide how to install them in the second part of this overview
1. TrendWave as an only tool in the trading strategy.
One indicator is good, two indicators are better. It is a common rule, but trading is not always a pursuit for a profit. It is also an interest, desire to understand how all this works and how it can be used in practice. So, will start with a kind of a simulator, a strategy based only on the TrendWave indicator alone, not involving graphic analysis.
Timeframe is 5 minutes. It is a dangerous timeframe for this indicator, so, you’d better utilize it in the timeframes starting from H1. But this will be suitable for demonstration how this indicator works. Currency pairs: EUR/USD, GBP/USD. Parameters: WavePeriod = 10, AvgPeriod = 21. Levels: 60, 50, -60, -50. The template archive can be downloaded here.
Conditions for entering a long trade:
- You trade during European session
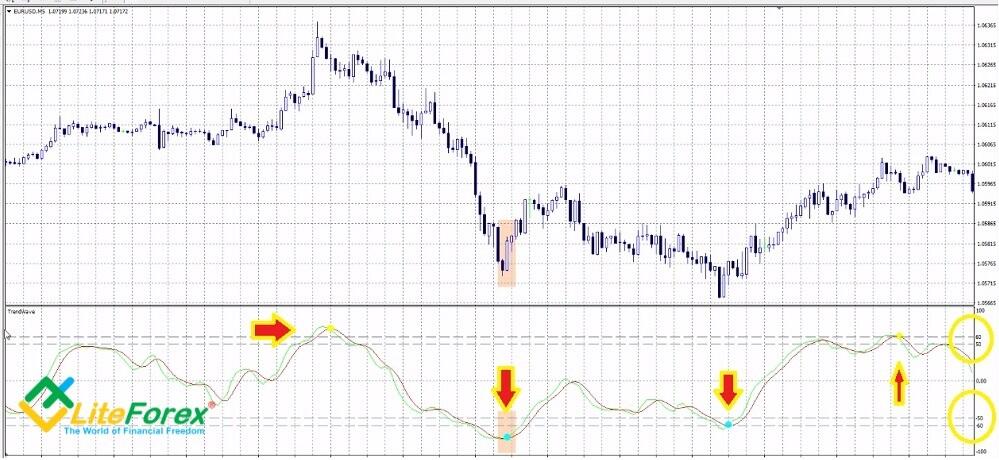
- TrendWave paints a yellow dot close to level 60 but not lower than level 50.
- In the next 5 hours (but not longer), the TrendWave goes down and paints a blue dot as close to level -60 as possible but not higher than level -50.
- The lines between these dots look relatively straight without obvious local extremes.
After there is the blue dot, you enter a trade at the next bar. The target profit is not big, 10 pips will be enough. A stop loss is also put at a relatively short distance, no longer than 10-20 pips.
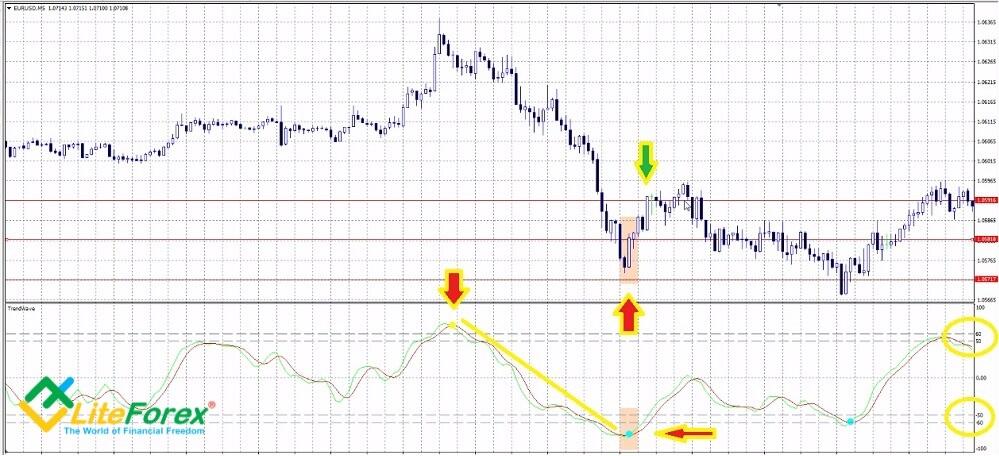
You see in the figure that there are painted two dots of different color at the opposite levels. Both lines are relatively straight, though there is a small gap. When the blue dot appears, you can enter a trade at one of the three bars. The red horizontal lines mark from to bottom: take profit, entry point, stop loss. The stop loss doesn't work out, the position is closed by the order in a few bars, the exit point is marked by the green arrow.
Conditions for entering a short trade:
- You trade during European session
- TrendWave paints a yellow dot close to level -60 but not higher than level -50.
- In the next 5 hours (but not longer), the TrendWave goes up and paints a blue dot as close to level 60 as possible but not lower than level 50.
- The lines between these dots look relatively straight without obvious local extremes.
The condition for entering a trade is similar to that of the long trade.
The situation is similar to the previous one here. The blue dot is between the needed levels, the yellow is higher than level 60 (it a stronger signal than when it is painted between levels 50 and 60), but the price touches take profit and the trade is exited automatically (green arrow).
You can experiment with the strategy. You can find out from the history what is optimal interval between the dots; for different currency pairs, the distance between the dots may be 2-3-4 hours. You can also assess the profitability of trades according to the distance between the dots and levels 60 and -60, based on historical data.
2. TrendWave and Hooya Map: triple confirmation of the trend
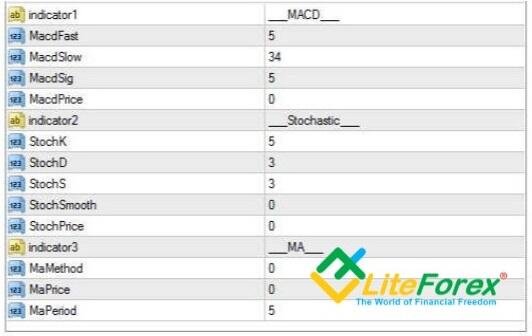
I have already describe the Hooya Map indicator in the article devoted to intraday strategies. This a complex indicator that includes the classical MACD, MA and stochastic. All the three indicators are oscillators that have their own advantages and drawbacks.
Hooya Map is convenient as, instead of three charts, overloading the screen, it paints three horizontal lines of dots, each line presents the data of one oscillator. The color of dots means the projected trend, rising or falling, and so the potential trade type. The strategy suggests you expect all the three oscillators of Hooya Map and the TrendWave to send the same signal simultaneously.
The recommended timeframe is H4, the currency pair is EUR/USD. Parameters of TrendWave:
- WavePeriod = 10.
- AvgPeriod = 21.
- Levels - 60, 50, -50, -60.
Sound and email alerts are not needed, so, I recommend you to set false for these parameters. The Hooya Map settings are displayed in the screenshot below. The template archive can be downloaded here.
Conditions for entering a long trade:
- TrendWave paints a blue dot
- Hooya Map paints three green dots at the same time.
The second condition is confirmation and must be met at the same bar as the first condition, or at the next bar. You enter the trade at the second bar after the second condition has been satisfied. You put a stop loss at 30 pips, a target profit is 20 pips. After it is reached you can either exit the entire trade, or close 50% and leave the other 50% open and protect this
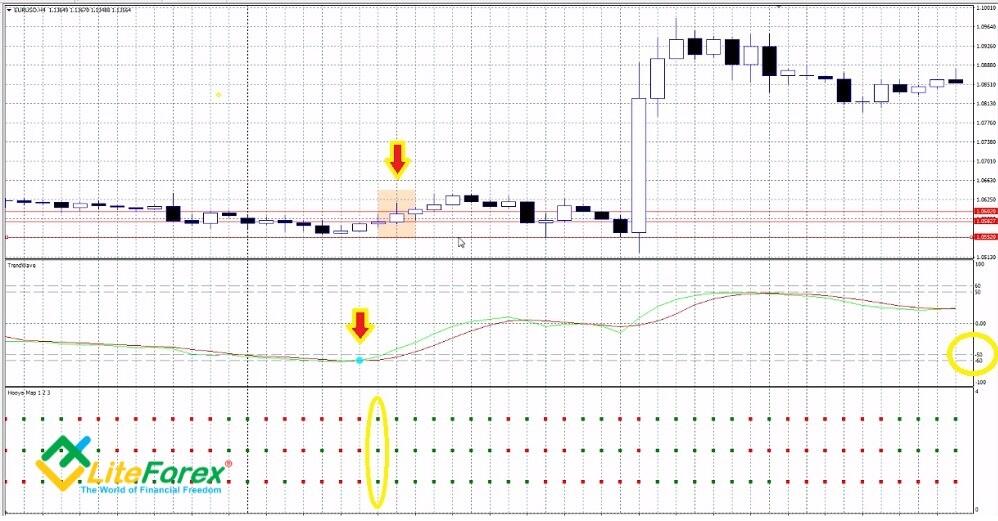
It is clear from the snapshot that the Hooya Map has painted a vertical line of 3 green dots only at the next bar after the blue dot was painted. The trade is entered at the next bar, and, what is important in this case, the Hooya Map delivers the same signal at the signal bar. If the dots are not of the same color at the signal bar, you might enter a trade, but take profit should be set at a shorter distance.
Note that the take profit, set in the given example, could have closed the position earlier. It is set at the level suggested by the testing on the historical data, but in this example, the trade could have been exited later.
Conditions for entering a short trade:
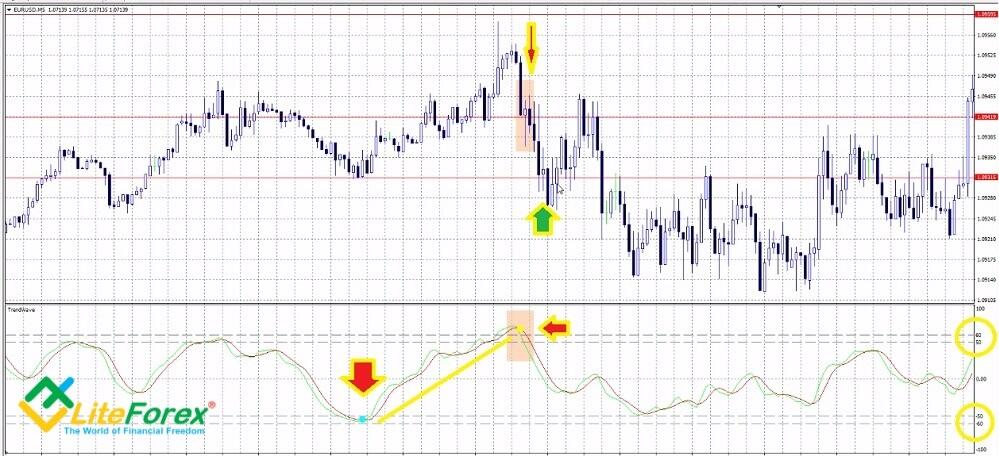
- TrendWave paints yellow dot
- Hooya Map pints three red dots at the same time
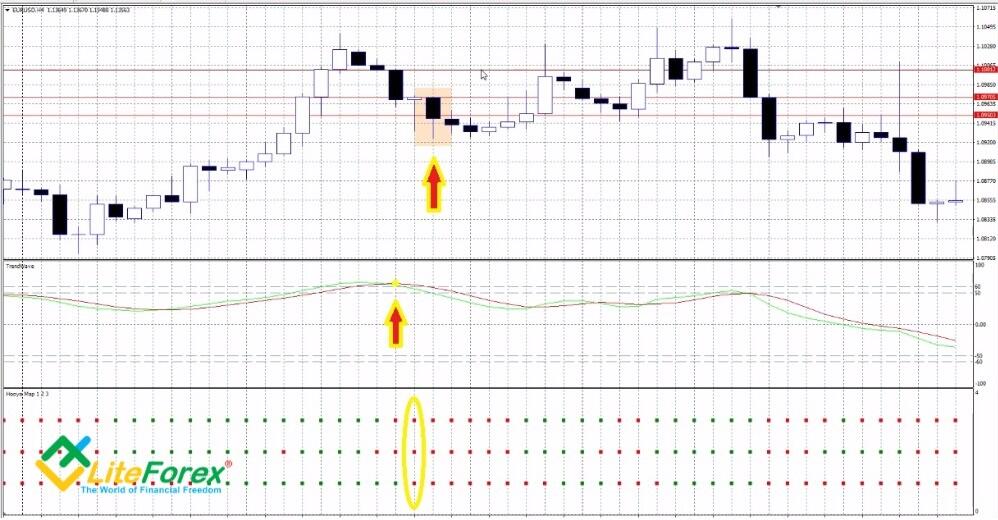
There is a similar situation. Hooya Map also paints a vertical row of red dots only at the next bar after the yellow dot. Take profit also works out earlier than the trend movement finishes. In some cases, it makes sense not to exit the trade too early, but, for example, exit 50% of the trade at the target level, and track the rest 50% till the nearest pivot point, setting a trailing stop.
A few recommendations concerning the strategy
- There can be a divergence shown by the Hooya Map at the bar where the trade was entered. This signals that you should stay in front of your computer and monitor the situation as you may need to exit the trade before the target profit of 20 pips us reached.
- The signals rarely coincide exactly, so, you’d better apply the strategy to trading a few currency pairs, having selected optimal values for stop losses and take profits according to the pair’s volatility calculator.
- Don’t trade during the first 12 hours on Monday and the last 12 hours on Friday.
- The best timeframe is H4. You can test the strategy on the hourly timeframe, but trade signals will be less valid due to speculative price swings and market noise.
3. TrendWave and trend cycles
According to Elliott wave theory, the market has cyclical nature. Every trend always finishes. Any fall is followed by rise, and vice versa. The matter is only how to distinguish between the temporary correction and the trend reversal. You can employ the TrendWave together with another interesting indicator Cycle Koufer Extremus. It helps to track the end of trend waves, and so, it is similar to TrendWave. However, there is not much detailed information about this. There is only its general work principle described. So, if someone knows programming language well, please write its formula in the comments. I suggest those, who wants just to understand the accuracy of signals, without going deep into the mathematical rules, get familiar with the parameters.
Parameters of the indicators:
- TrendWave: WavePeriod = 10, AvgPeriod = 21. Levels: 60, 50, -60, -50.
- Cycle Koufer Extremus: Period of fast MA - 12, Period of slow MA - 24, Crosses = 50, Levels: 85, 15.
Timeframe – 15 minutes, currency pairs - EUR/USD, GBP/USD. Although it is recommended to employ the TrendWave on the timeframes of H1 and longer, here it performs quite well combined with another cycle indicator. You can download the strategy template here. Note that there are two indicators in addition to the strategy template in the archive. The second indicator is auxiliary, the Cycle Koufer Extremus won’t work without it. So, you past both files onto MT4.
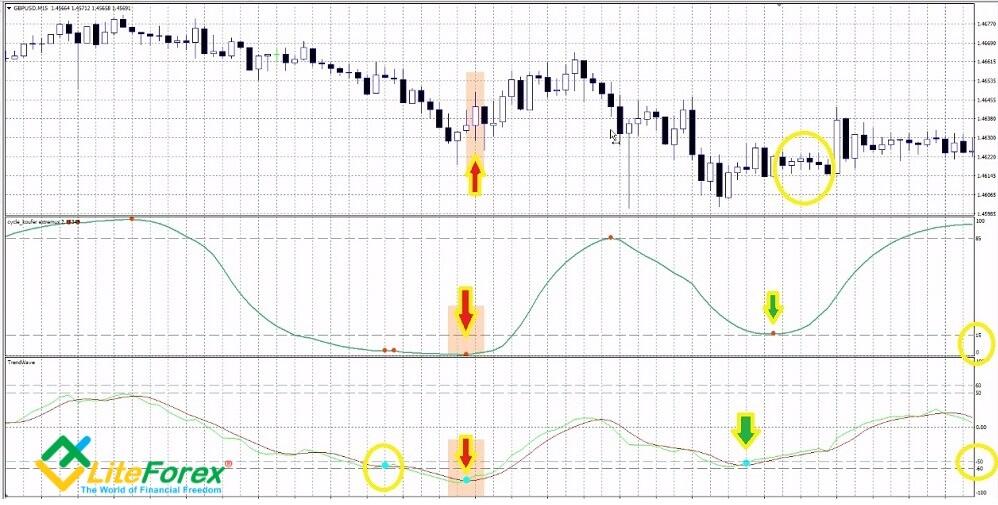
Conditions for entering a long trade:
- Cycle Koufer Extremus paints a dot between levels 0 and 15. The closer it to zero level, the better.
- TrendWave paints a blue dot as low as possible. The main condition is that is must be below level -50 as low as possible, close to level -60. This corresponds to the case when the green bull line breaks through the red bear line upside.
An additional requirement. Analyze the TrendWave behavior during the previous 10 bars. It shouldn’t have been below -50 with painting a blue dot. If, when the both conditions were met simultaneously, the TrendWave painted dots a few bars ago, you don’t enter a trade.
You can enter a trade at the next bar. Target profit depends on the situation. The strategy allow to pick up the movement of the trend wave equal to about 20-30 pips. You put the stop loss at roughly the same distance, referring to the local lows (you put a stop a little lower). When the target profit is reached you see the market situation. If the trend hasn’t yet exhausted, you protect the trade by a trailing stop. If there are any signs of a reversal, you close the entire position. If the price hasn’t reached the target level, you exit the trade earlier.
The screenshot displays how there coincided the signals of both indicators, furthermore, there were no dots of TrendWave before the signal bar. You enter the trade at the next bar. The green arrow points to the bar where the target profit was reached. You can exit the trade here, or you can wait, as following a short pullback, the trend has drawn the price few pips high before there started trading flat.
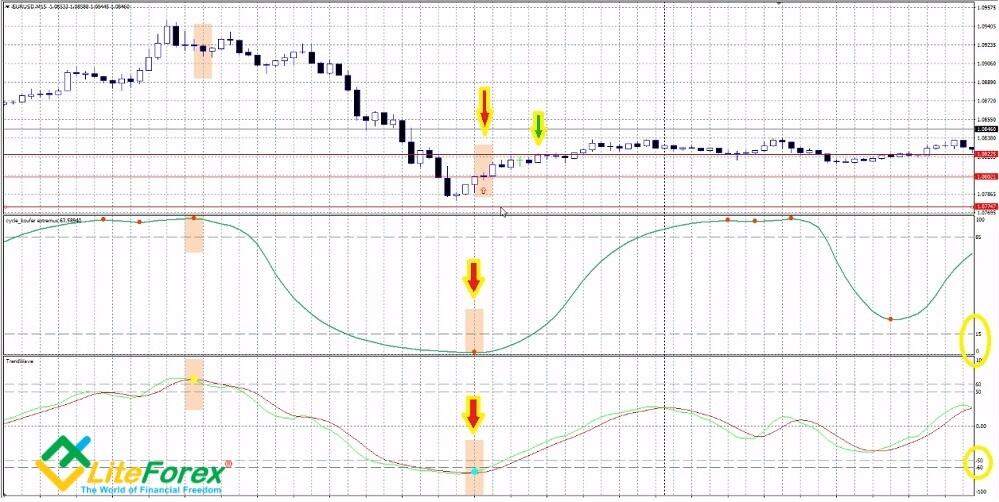
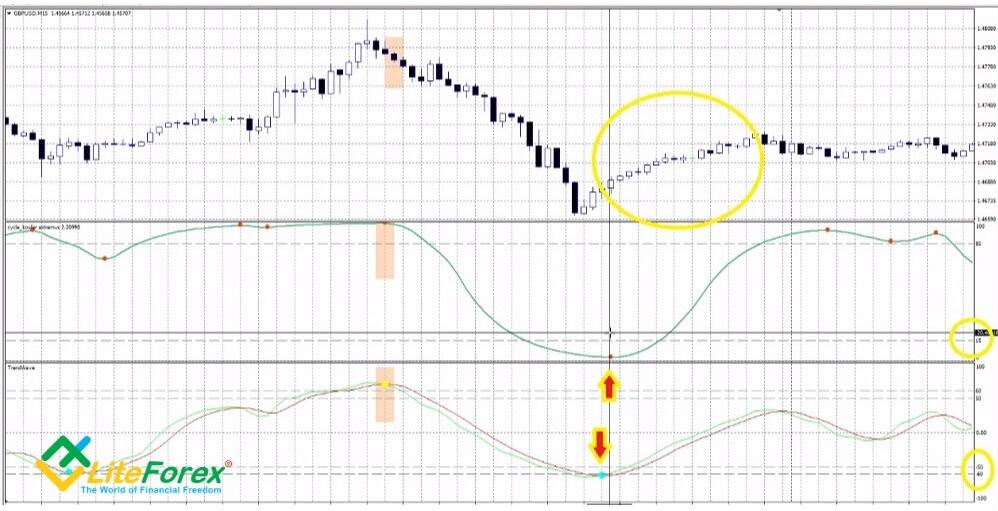
Conditions for entering a short trade:
- Cycle Koufer Extremus paints a dot between levels 85 and 100. The closer it to level 100, the better.
- TrendWave paints a yellow dot as high as possible. The main condition that it should be above level 50 as high as possible, close to level 60. The corresponds to the case when the green bull line breaks through the red bear line downside.
You should also check 10 last bars before the signal, the TrendWave should not paint a yellow dot between levels 85 and 100. Entry and exit rules are similar to those of a long trade.
The situation here is similar to the previous one. Both indicators send corresponding signals at the same time, the TrendWave hasn’t painted dots before the signal bar (the dots of Cycle Koufer Extremus are not taken into account). In this case, the trend also continues after the target level has been reached. This confirms that this strategy requires constant monitoring of the situation.
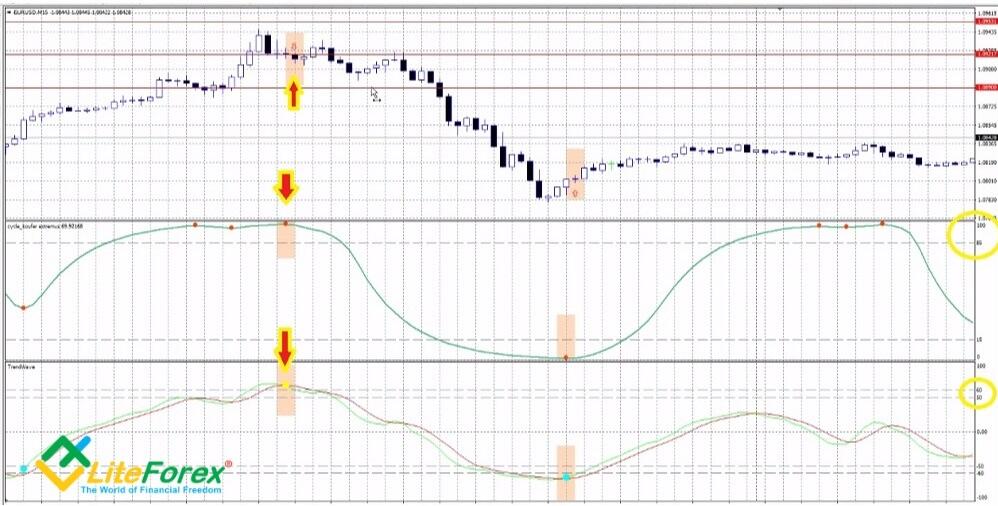
The next screenshot presents two other possible situations.
In the first case, you see the simultaneous coincidence of both indicators’ signals, but the TrendWave has painted a dot before this, which means that the trend is not clear or strong. If you entered the trade in the case like this, it would still yield profit provided that you put a stop loss at a longer distance. But the profit won’t be significant, and it is not worth risking if the trend direction is not clear.
In the second case, two conditions have not been met. Indicators send signals with few-bar shift, and the Cycle Koufer Extremus is little higher than level 15. The strength and the direction of the trend are not clear. And so, you shouldn’t enter a trade.
You can also see the divergence of a few bars in the indicators’ signals here, but others conditions are met. Although it is not recommended to enter a trade in this case, the risk is acceptable, and, as you see from the chart, justified. This suggests that the divergence in the indicators’ signals of 1-3 bars is not a strong deviation, unlike the case with levels 100, 0 for Cycle Koufer Extremus and 50, -50 for TrendWave.
The strategy is designed to identify the beginning of a strong trend. The problem with it is that its signals are not often clear and the strategy itself can be applied in many ways. Its advantage is that you don’t need to expect until all the conditions are accurately met. Indicators may paint dots at different bars (with the interval of no longer than 1 bar), which is also a signal. If, during the 10 bars preceding the signal one, the TrendWave painted dots, it means that the ongoing trend hasn’t yet exhausted and it may be just a correction, rather than a reversal. In this case, you don’t enter a trade. You may change the timeframe or the currency pair.
4. TrendWave and Sentiment: little by little, one travels far
The Sentiment was describe in the article devoted to long-term trading strategies. It is a trend indicator that will serve as a filter in this strategy. The currency pair traded is EUR/USD, the timeframe is H1, the template archive is here.
Parameters of the indicators:
- TrendWave: WavePeriod = 10, AvgPeriod = 21. Levels: 60, 50, -60, -50. They are default.
- Sentiment: Period= 10, Mode - fast, Levels: 0,22 and -0,22.
You can also see the divergence of a few bars in the indicators’ signals here, but others conditions are met. Although it is not recommended to enter a trade in this case, the risk is acceptable, and, as you see from the chart, justified. This suggests that the divergence in the indicators’ signals of 1-3 bars is not a strong deviation, unlike the case with levels 100, 0 for Cycle Koufer Extremus and 50, -50 for TrendWave.
The strategy is designed to identify the beginning of a strong trend. The problem with it is that its signals are not often clear and the strategy itself can be applied in many ways. Its advantage is that you don’t need to expect until all the conditions are accurately met. Indicators may paint dots at different bars (with the interval of no longer than 1 bar), which is also a signal. If, during the 10 bars preceding the signal one, the TrendWave painted dots, it means that the ongoing trend hasn’t yet exhausted and it may be just a correction, rather than a reversal. In this case, you don’t enter a trade. You may change the timeframe or the currency pair.
You have already come across the Sentiment indicator in the article devoted to long-term trading strategies. This is a trend indicator that will serve as a filter in this strategy. The currency pair traded EUR/USD, timeframe is H1; the template archive is here.
Parameters of the indicators:
- TrendWave: WavePeriod = 10, AvgPeriod = 21. Levels: 60, 50, -60, -50. They are default.
- Sentiment: Period= 10, Mode - fast, Levels: 0,22 and -0,22.
Conditions for entering a long trade:
- TrendWave paints a blue dot between levels -50 and -60. The conditions are the same as in the previous strategy (the dot may be below level -60). The lower is the dot, the better. This means that the ongoing trend has already exhausted its strength, bears are reducing the trade volumes and the balance of power may soon shift in favor of bulls.
- Sentiment is below level -0,22. By the time of the signal appearance, the indicator should have been painting rising by module columns and, at the signal bar, there should be a column that is less by module than the previous ones.
As soon as both conditions are satisfied simultaneously at the same bar or at the two consecutive bars, you enter a trade at the next bar. There are a few variants of exiting the trade. You may hold it up to the target profit of 30-50 pips, but this is not always reached. Another signal for taking at least a part of profits will be when TrendWave line touches zero level. The position is completely closed if the Sentiment touches the opposite level of 0.22.
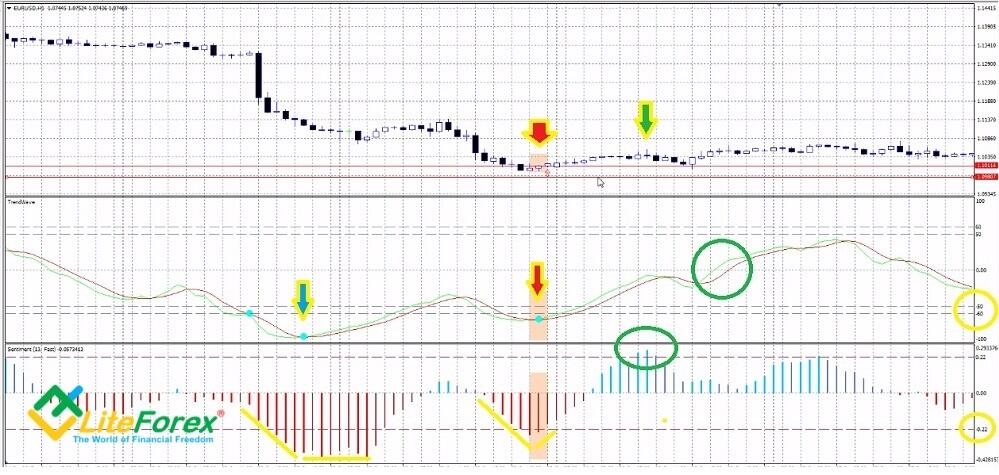
The first TrendWave dot below level -60 is the is marked by the blue arrow. Before the signal bar opened, the Sentiment had painted a number of columns each of which is greater by module than the previous one, but when the TrendWave delivered a signal, the columns were not declining. This means that the trend has not yet exhausted and is more likely to turn into trading flat or continue moving down, so, one shouldn’t enter a trade.
The second signal accurately meets the strategy requirements. The TrendWave paints a dot close to level – 60, and, at the same time, the Sentiment paints a pattern with rising and then falling by module columns. In the candlestick chart, I marked with a pink box three bars that can be called signal. It makes sense to to wait during at least one more bar after the first declining column appears.
Green circles mark the exit conditions: Sentiment reaches level 0.22 or TrendWave meets zero level.
Conditions for entering a short trade:
- TrendWave paints a yellow dot between levels 50 and 60. The higher is the dot, the better,
- Sentiment is below -0.22
The entry conditions are similar.
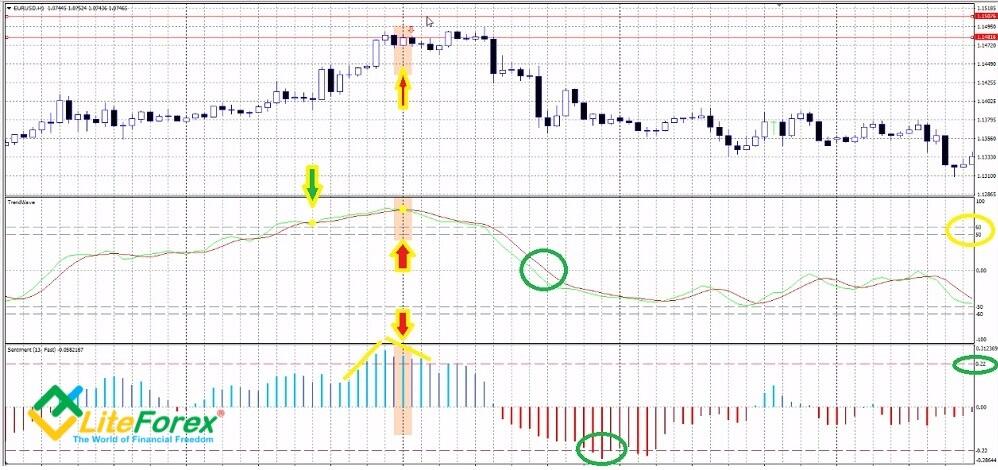
The figure displays another unclear situation. In the first case (green arrow) is lower than the needed level, so we do not enter a trade. In the second case, the TrendWave is clearly lagging. Sentiment painted growing columns above the needed level, and next, there has been a column that is less by module, but the dot of TrendWave appears only in one more bar. Unlike the example studied above, the signal here is not accurate, and the trader must realize that entering a trade in this case engages quite a high risk. In this example, the trade has yielded a profit, the potential exit points are marked with the green circles.
The signals are rare but, just like in the previous strategy, there is quite much room for experiments. You don’t have to strictly observe the entry rules, as for different currency pairs the signal value of TrendWave can be different; it is only important that it should be either in the top or in the bottom zones (it is not recommended to change the Levels parameters). It is also important that the Sentiments forms a pattern of columns that confirms the trend reversal.
Conclusion. In some sources, there is information that the TrendWave is a flat indicator and it sends a lot of false signals in a trending market. It is arguable. Of course, there can be errors, but if you discover some regularities during the testing on historical data and use additional supplementary tools, it can yield a far better result. In the strategies described above I tried to explain the most frequent combinations and offered the guide hot to react. I hope it will help you. And, of course, I am waiting forward to questions concerning the strategies, comments and your ideas.
I wish you success in trading!
P.S. Did you like my article? Share it in social networks: it will be the best "thank you" :)
Useful links:
- I recommend trying to trade with a reliable broker here. The system allows you to trade by yourself or copy successful traders from all across the globe.
- Use my promo code BLOG to get a 50% deposit bonus on the LiteFinance platform. Simply enter this code in the appropriate field when funding your trading account.
- Telegram chat for traders: https://t.me/litefinancebrokerchat. We are sharing the signals and trading experience.
- Telegram channel with high-quality analytics, Forex reviews, training articles, and other useful things for traders https://t.me/litefinance
Price chart of EURUSD in real time mode

The content of this article reflects the author’s opinion and does not necessarily reflect the official position of LiteFinance broker. The material published on this page is provided for informational purposes only and should not be considered as the provision of investment advice for the purposes of Directive 2014/65/EU.
According to copyright law, this article is considered intellectual property, which includes a prohibition on copying and distributing it without consent.