ICT Killzones are trading windows when institutional investors are most active. During these periods, market volatility often increases, creating opportunities to profit from short-term price movements but also raising risks.
According to the ICT concept, there are four Killzones. Three of them occur during the early hours of the London, New York, and Asian trading sessions, while the fourth falls during the closing of the London session, which overlaps with the New York session.
This review examines how ICT Killzones drive market movements, how to apply them in trading strategies, and what risks to consider.
The article covers the following subjects:
Major Takeaways
ICT Killzones are specific periods of time within global market sessions when institutional traders are most active. During these critical periods, a sustained trend often forms, fueled by rising trading volumes, and genuine breakouts of key levels occur.
According to the ICT concept, there are four primary kill zones in Forex: the Asian, London (European), New York (American), and London closing zones.
ICT kill zones exist in every trading session, but each has its own most active instruments due to the markets' geographical locations. For example, the Asian session's kill zone is most important for the Japanese yen, while gold trades most actively during the London/New York Forex session overlap.
When trading Kill Zones, it is necessary to account for the transition between daylight saving time and standard time.
One strategy option: after a calm Asian session, place pending orders on both sides of the price range to capture the trend movement at the start of the ICT London Kill Zone.
What Are ICT Killzones in Forex Trading?
ICT Killzones are specific time periods during the trading day when market makers are most active. According to the Smart Money concept developed by Michael Huddleston, known as The Inner Circle Trader (ICT), it is during these periods that the most stable trends most often form, genuine breakouts and liquidity sweeps occur.
Based on his trading experience, the ICT outlined four periods featuring the highest volatility. One falls during the American session, one during the Asian session, and two during the European session. The Pacific session was not included in this list. The author of the theory likely considered it the calmest, with minimal trading activity.
This theory is often criticized on trading forums. Among the main arguments are:
Modern trading is largely automated. For trading algorithms, the time of day is not a critical factor, so the lines between different time periods can be blurred.
The value of many assets is influenced by fundamental factors that are not tied to specific time zones. News published outside the London Killzone can also trigger severe market volatility.
The ICT Killzone theory is best applied to major currency pairs, gold, and silver, as these assets are most actively traded during the London and New York sessions. Exotic currency pairs are more dependent on local time and the specifics of regional financial markets. Activity in the cryptocurrency market is also largely determined by fundamental factors. For stocks, the theory is less applicable due to price gaps between trading sessions.
The ICT Killzones concept is not a one-size-fits-all guide. It is a supplementary tool that can help increase the likelihood of finding high-quality trading signals. It is based on the observation that trading activity tends to increase during certain periods of the trading session. However, this pattern is not constant and can be disrupted by fundamental and other factors.
Four Primary ICT Killzone Times
The ICT methodology identifies four main Killzones. Understanding the unique characteristics of each trading session can help traders pinpoint high-probability setups and determine the most favorable times to enter the market.
Killzone | Time (UTC) | Market | Volatility | Description |
Asian | 00:00–03:00 | Tokyo, Sydney | Low (relative to other zones) | The price is moving within a narrow sideways range (consolidation). Liquidity is gradually accumulating here, which professional traders will collect in the next session. |
London | 7:00–10:00 | London, Europe | High | This period often features daily highs or lows. |
New York | 12:00–15:00 | New York | Very high | Prices often continue the trend set in the Forex London session time. This is the busiest time of day due to the release of important US economic reports. |
London Close | 15:00–17:00 | London, Europe (close) | Medium/High | The price retreats from daily extremes. |
The trading hours for Forex are displayed in daylight saving time: EDT (Eastern Daylight Time) for New York, and BST (British Summer Time) for London.
ICT Asian Killzone Time
The Asian ICT Killzone in Forex trading refers to the period when initial market liquidity forms, often setting the tone for further price movements throughout the day.
Asian Session Forex Time EST:
UTC — 00:00–03:00;
BST (London) — 01:00–04:00;
EDT — 20:00–23:00.
Note: During the winter, GMT and UTC are the same. However, in the summer, the United Kingdom switches to BST (British Summer Time), which is GMT+1, resulting in a one-hour difference between GMT and UTC.
The Asian trading session is considered the calmest. While the financial centers in New York and London are closed, market activity is primarily driven by participants from Asia. The ICT Asian Kill Zone begins with the opening of trading in Singapore and Hong Kong, which kicks off the Tokyo session Forex time. This period may be suitable for novice traders who are not yet ready to react quickly to the sharp price movements common in the American and European sessions.
Asian ICT Killzone Features
The most actively traded currency pairs are those involving the JPY, AUD, and NZD against the US dollar, as well as cross rates involving these currencies.
During the ICT kill zones times, the dollar typically consolidates following active trading in previous sessions. Major market participants may use this time to build up positions ahead of the next trading sessions.
Most trading signals form on Asian currency cross rates, as the US dollar and the euro often move sideways during this time.
Trading is primarily conducted on short-term time frames (M15–M30), and less frequently on the H1 time frame.
Best strategies
Trading within a price channel by opening positions on rebounds from its boundaries.
Trading using pending orders.
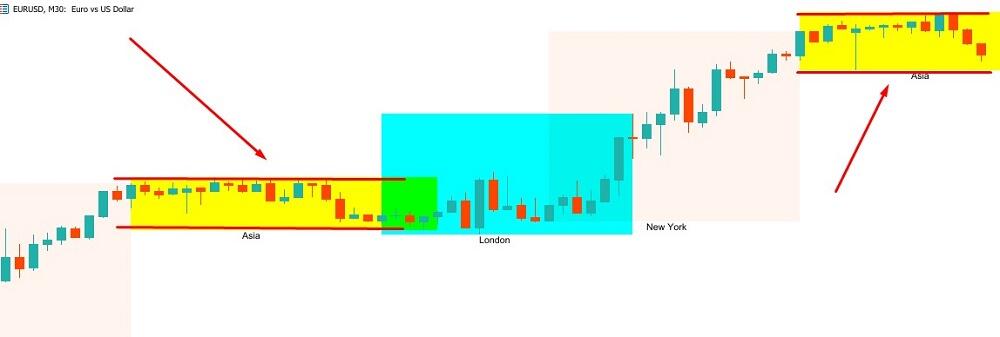
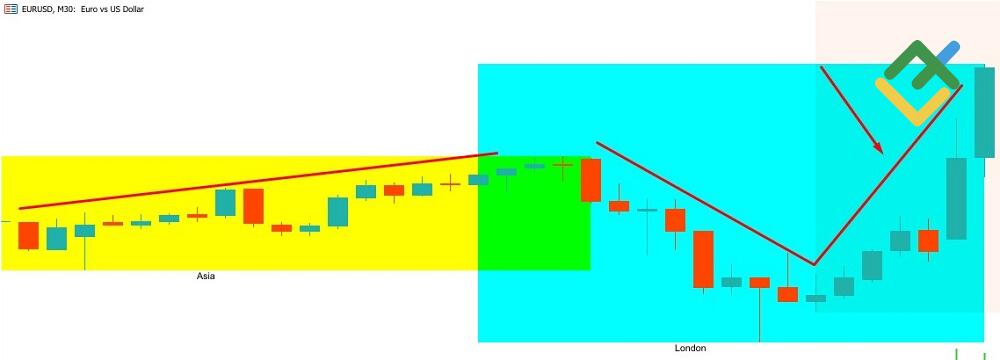
The Asian session (highlighted in yellow) is typically characterized by a narrow trading range and small candlestick bodies. As the London ICT Killzone begins, candlestick sizes become larger, reflecting increased market volatility. However, the primary market direction is more often shaped during the New York ICT Killzone.
ICT London Killzone Time
The London ICT Killzone is considered one of the busiest periods of the trading day, when market liquidity increases sharply, and significant price movements often occur.
London Session Forex Time:
UTC — 07:00–10:00;
BST (London) — 08:00–11:00;
EDT — 03:00–06:00.
London is one of the world's leading financial centers, making the London trading session one of the most active periods for major currency pairs. Its opening coincides with the start of the London ICT Killzone. Following the typically quieter Asian session, market activity and liquidity increase sharply. Trading volume is usually highest during the first three hours of the session, then gradually tapers off during the day.
London ICT Kill Zone Features
The most actively traded pairs are those involving the EUR, CHF, and GBP against the US dollar, as well as cross rates involving these currencies.
At the start of the London ICT Killzone, sustained trends often form and can persist throughout subsequent trading sessions for more than 16–24 hours.
During the ICT session times, scalping can be profitable: high volatility allows traders to generate profits from short-term price movements.
In an uptrend, the daily high often forms, while in a downtrend, the daily low forms during the last three hours of the London trading session.
Best strategies
Entry at the start of a new trend.
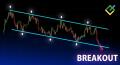
Trading breakouts of key levels based on Kill Zones Forex.
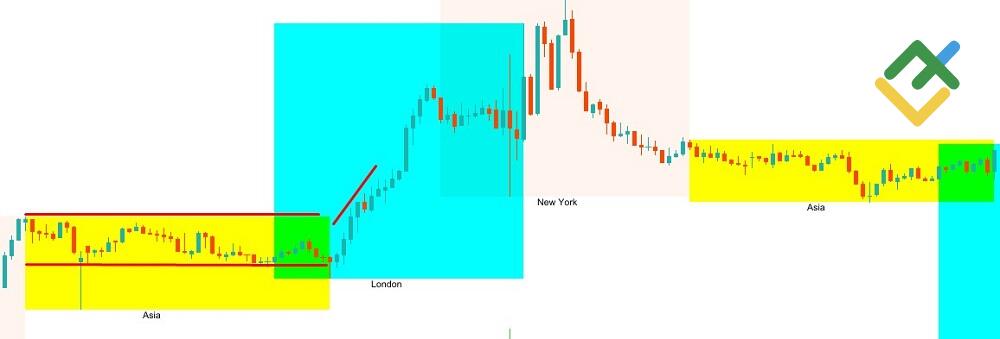
In this example, trading activity increased sharply at the end of the London ICT Killzone, following the close of the Asian session.
ICT New York Killzone Time
The New York ICT Killzone is known for its high volatility and significant trading volume, as both US and European market participants are active simultaneously during this period.
New York Session Forex Time:
UTC — 12:00–15:00;
BST (London) — 13:00–16:00;
EDT — 08:00–11:00.
The start of the American (New York) session overlaps with the second half of the European (London) session. Both Forex trading sessions are considered the most active in terms of volatility and trading volume. Therefore, the period when they overlap is one of the most dynamic ICT Killzones.
This period attracts experienced traders with its high liquidity and abundance of trading opportunities. At the same time, the market can be particularly volatile: activity from major players on both sides can lead to significant price shifts. The largest price fluctuations are often observed during the NY session Forex time.
New York ICT Kill Zone Features
The most actively traded assets include pairs involving the US dollar, major currency pairs, cross rates, stocks, stock indices, and gold.
Both short-term and long-term trends can develop during this period. Short-term movements arise from an active tug-of-war between buyers and sellers, while long-term trends are more often determined by US macroeconomic data and important news related to the US dollar.
During the New York session, prices often return to the range established during the London session. Although this pattern does not always hold true, it can be taken into account when looking for trading opportunities.
Best strategies
Scalping in highly volatile conditions.
Trading based on fundamental analysis.
Capitalizing on trends that emerge during the London Forex trading session.
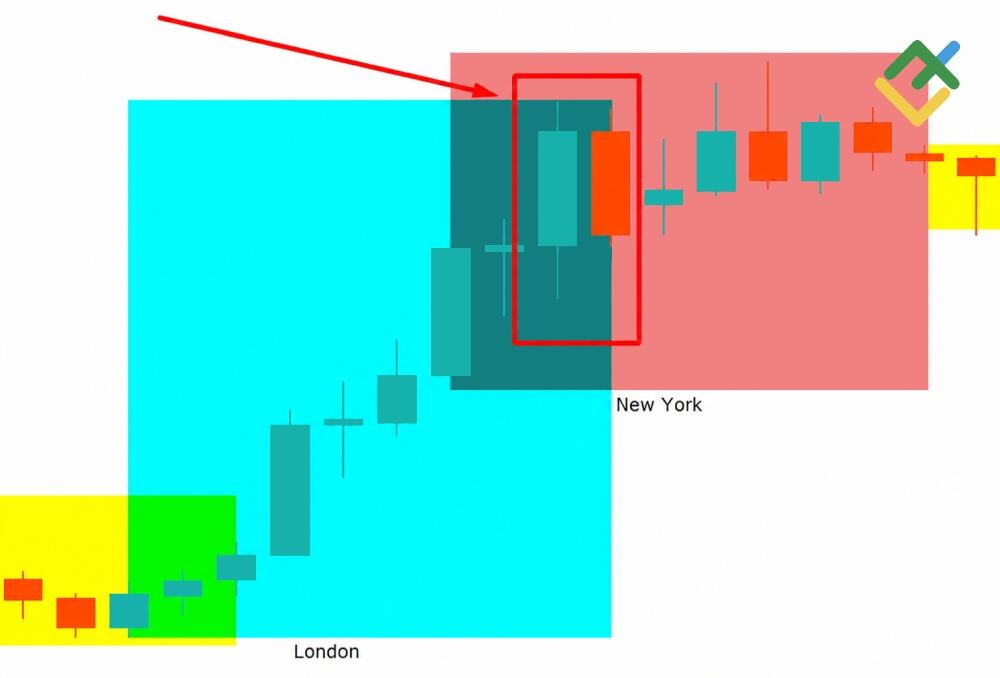
The Asian and London ICT Killzones show moderate volatility. With the start of the New York ICT Killzone, which overlaps with the closing period of the London session, a sharp downward move is observed, followed by a return of the price to the middle of the trading range.
The green volume bar on the bearish candlestick indicates increased trading activity. In this situation, a trader can switch to a lower time frame to identify optimal trade entries aligned with the downtrend.
ICT London Close Killzone
The London close is the period when European market participants wrap up their trading activity, which often leads to profit-taking and market structure shifts in intraday price trends.
London Close Kill Zone:
UTC — 15:00–17:00;
BST (London) — 16:00–18:00;
EDT — 11:00–13:00.
The European and US trading sessions overlap for four hours. The London session starts earlier, so the first two hours of overlap between the second half of the London session and the start of the US session coincide with the New York ICT Killzone. After it ends, there are still two hours left until the London session closes—this trading window is called the London close ICT Killzone.
Although this time range still overlaps with the New York session, trading activity here typically begins to decline. European traders close their positions, which can lead to price corrections within the daily range.
London Close ICT Killzone Features
The most actively traded assets are major currency pairs involving the US dollar and other assets with moderate volatility.
During the first hour of the Killzone, a short-term trend may develop towards the middle of the daily range. This movement can be used for short-term trading and scalping on the M15 time frame.
Compared to the ICT New York Kill Zone, volatility is typically lower: corrections are generally less pronounced, occur less frequently, and price movements appear more predictable.
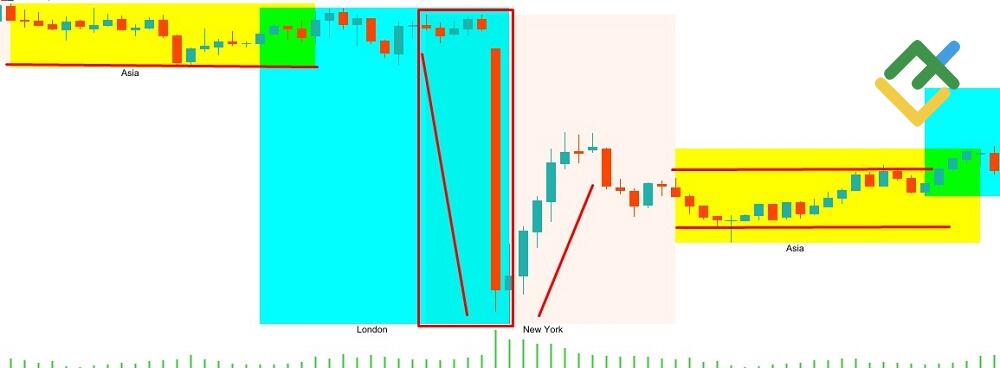
Following a relatively calm Asian trading session, a pronounced downtrend forms during the London ICT Killzone, with the price setting a new daily low. During the London ICT Killzone close, which overlaps with the New York session, a corrective pullback occurs to the London session's opening level, after which, driven by increased activity from New York session participants, the price breaks above this level.
How to Trade ICT Killzones: Step-by-Step Guide
There are many ICT trading strategies. For example, you can use heightened volatility and directional price movements within each zone to open short-term trades. Another option is to look for entry points after the calm Asian session, at the start of the London session, to try to join a strong trend that often develops during the overlap between the London and New York sessions.
Regardless of the strategy you choose, you will need an indicator that highlights these time zones on the chart. You can download a free version of the ICT Killzones and Pivots indicator for MT5 here.
How to install the ICT indicator:
In the trading platform, open the File tab and choose the Open Data Folder option.
Navigate to the custom indicators folder.
Copy the ICT Killzones indicator installation file into that folder.
Restart the platform.
Once you restart the platform, the indicator will appear in the custom indicators section.
The indicator automatically highlights three main zones. The fourth zone—the ICT Killzone at the close of the London session—should be identified manually. On the chart, it corresponds to the second half of the overlap between the London and New York trading sessions:
Let's take a closer look at the different trading strategies below.
London Breakout/Killzone
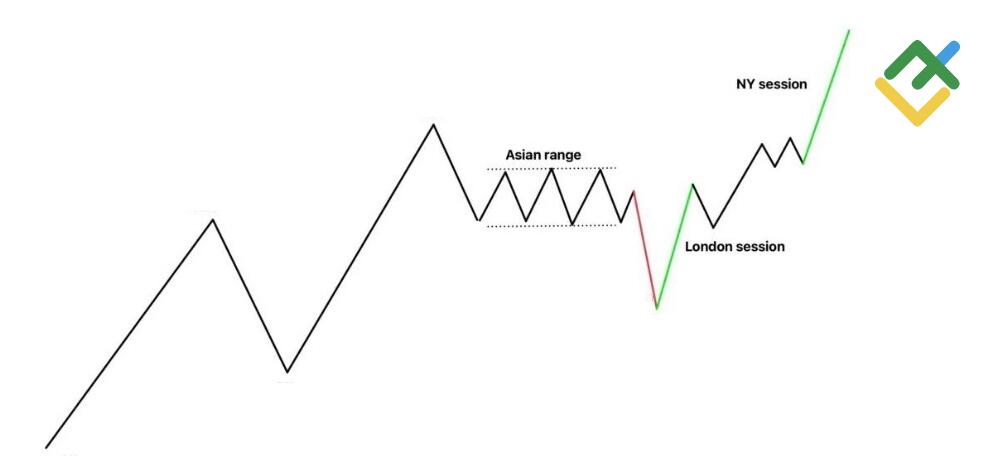
The idea behind this strategy is as follows: during the Asian session, the Forex market often consolidates. When the London session opens, considerable liquidity flows into the market, potentially triggering a sharp price move. Frequently, this shift determines the trend direction for most of the trading day. Currency pairs: GBP/USD, EUR/USD, GBP/JPY. Time frame — H1.
How to trade:
One hour before the start of the London ICT Killzone, determine the Asian session's range, highlighting its high and low.
Ten minutes before the London session opens, place pending orders slightly above the high and below the low of the Asian session.
The logic behind this strategy is that it is difficult to predict the direction of price movement in advance when volatility is rising. However, it is precisely at the start of the London ICT Killzone that momentum often builds, which can set the trend and lead to a daily high or low. The distance to the pending orders is about 20 pips for five-digit quotes.
Place your stop-loss order in the middle of the Asian session's trading range.
After opening a position, it is recommended to use a trailing stop to manage the trade.
Profit-taking targets:
Close 50% of the position by the start of the New York session, as rising volatility could reverse the trend.
Close the remaining 50% at the start of the London Close ICT Killzone.
Another option is to close the position when other reversal signals appear.
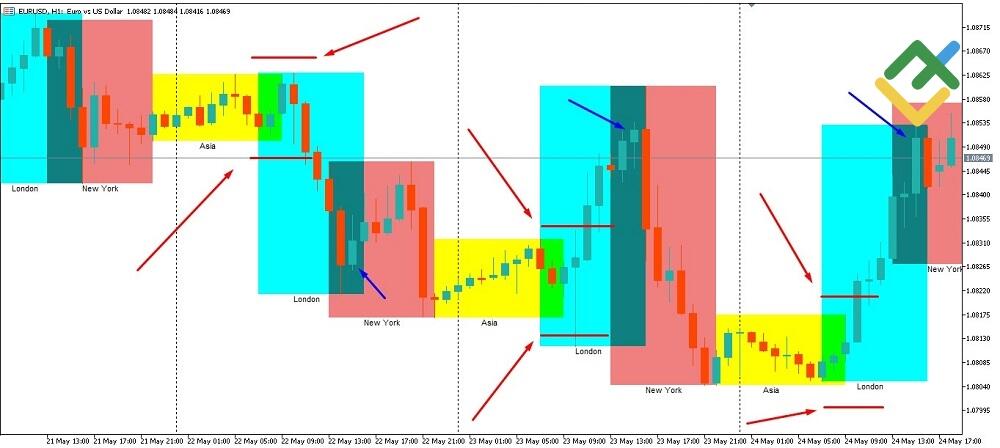
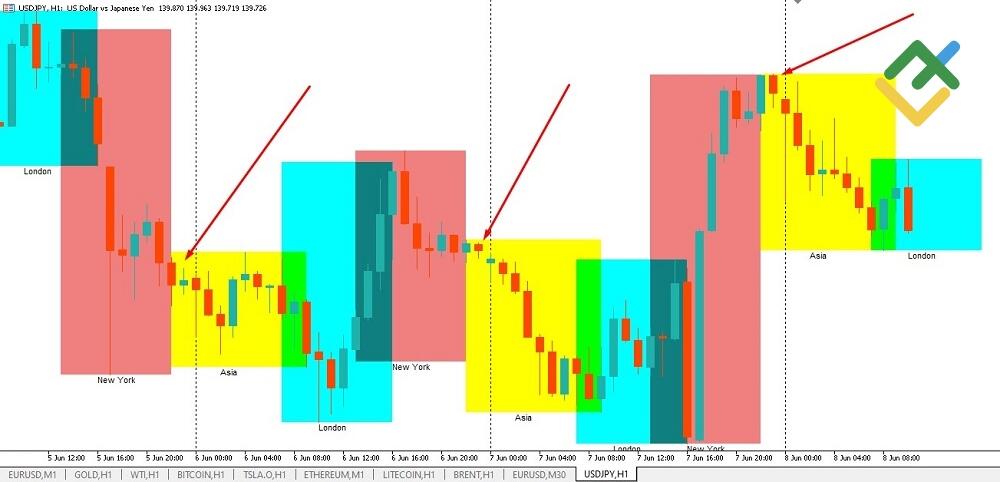
The yellow rectangle marks the Asian session's range. Before the London session opens (blue rectangle), pending orders are placed outside this range: above the upper boundary—Buy Stop; below the lower boundary—Sell Stop.
In all three examples, following a relatively quiet Asian session, the London session began with a pronounced trend on the hourly time frame. This trend subsequently persisted during the New York ICT Killzone (pink rectangle).
The weakening of the trend, indicated by the blue arrows, began with the opening of the London Close ICT Killzone.
Asian Range
This ICT trading strategy is suitable for conservative traders who prefer to trade in conditions of moderate volatility.
At the start of the Asian session, the EUR/USD pair's direction is often shaped by the first one or two candlesticks following the active New York session. Within the ICT framework, traders use this period to confirm the prevailing trend on higher time frames, looking for clear signs of either a reversal or a continuation of the momentum established during the New York session.
After that, a position is opened on the M15–M30 time frames in the direction of the movement set by the first one or two candlesticks in the Asian session.
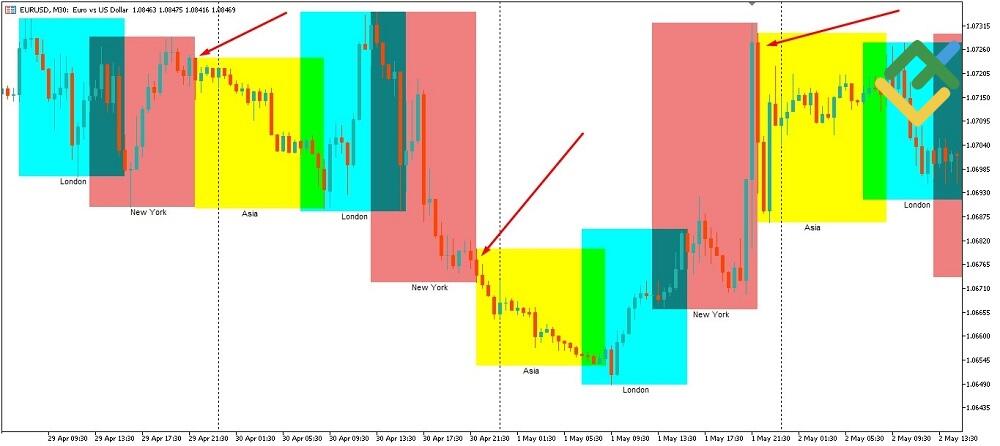
In the first case, the price began to reverse before the New York session ended. The first bearish candlestick determined the direction of the price movement during the Asian session.
In the second case, the price continued to move in the previously established downtrend during the Asian session.
In the third case, fundamental factors triggered exceptionally high volatility for the Asian session.
A similar pattern is observed in the USD/JPY pair due to the relatively calm, slow-moving nature of the Asian trading session.
Smart Money
Smart Money is a concept that describes the behavior of major market participants: banks, hedge funds, and institutional investors. According to this theory, before building a large position, these participants seek to drive the price into zones with a high concentration of retail traders' stop-loss orders in order to harvest liquidity. As a rule, this occurs near key support and resistance levels. As a result, an order block may form on the chart—one of the key Price Action patterns used in strategies that monitor major market participants' actions.
This ICT strategy is most commonly used with the EUR/USD and GBP/USD currency pairs at the start of the London ICT Killzone.
How to trade:
Determine the general market trend. Zoom out on the chart to assess the overall structure and direction of the trend.
Pay attention to the range during the Asian session. Before the London session opens, market makers may orchestrate false breakouts of its boundaries.
Look for false breakouts that run counter to the main trend. During the London or New York sessions, monitor situations in which the price moves outside the Asian session range but contradicts the prevailing market trend.
After confirming a false breakout, open a position in the direction of the price reversal.
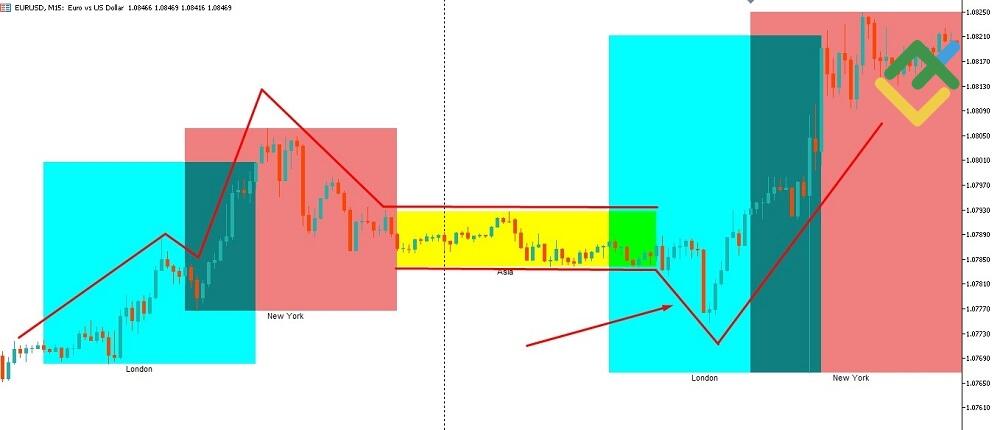
The chart shows an uptrend formed during the London session and continued into the New York session. By the end of the New York session and by the close of the trading day—the vertical line marks the boundary between trading days—trading volume declined, leading to a correction in the upward trend.
The Asian session was relatively calm. During the London ICT Killzone, no clear direction emerged: a false breakout appeared on the chart in the form of a large bearish candlestick on the M15 time frame. This may indicate a short-term increase in selling volume from major market participants, after which liquidity was gathered at lower price levels, and the price reversed to the upside.
Common Mistakes When Trading ICT Killzones
Premature entry before the Killzone period begins. Increased volatility and trend formation during Killzone periods are common but not guaranteed. Once the window opens, wait for a sustained price movement and assess the balance of supply and demand. Key levels and market liquidity data can serve as additional benchmarks.
Attempting to trade with the trend without a clear confirmation. To reduce the risk of false signals, first determine the direction of movement on higher time frames. If there is at least a short-term but sufficiently stable trend on them, you can look for entry points within the Killzone on lower time frames.
Mismatch between the asset and the selected trading zone. For example, trading the GBP/USD pair during the Asian session may be accompanied by less predictable price action and an increased risk of false signals.
Ignoring time zone differences. A one-hour shift in the Killzone start time can lead to entering the market too early or too late.
Disregarding fundamental factors. The release of macroeconomic statistics and important news can sharply change the direction of price movement and trigger stop-loss orders amid increased volatility.
The high volatility of the London and New York ICT Killzones increases trading risks, as market conditions can change rapidly. At the same time, it is precisely these periods that often present opportunities to profit from strong momentum moves.
Best Currency Pairs for Each ICT Killzone
The effectiveness of Kill Zone trading largely depends on the chosen instrument, as different currency pairs tend to be most active during specific Forex market hours. Understanding kill zones and this relationship allows traders to focus on assets with higher liquidity and more predictable price action.
Best Forex Pairs to Trade During Asian Session
AUD/USD — exhibits high trading activity due to the opening of trading sessions in Sydney and Tokyo. It often forms clear consolidation ranges during the Sydney session Forex time.
USD/JPY — The Japanese yen is sensitive to Japanese macroeconomic data, which is frequently released during this period.
AUD/JPY — a cross-currency pair with relatively high volatility, suitable for intraday trading and working with short-term trends during global Forex hours.
NZD/USD — one of the most popular currency pairs in the Asia-Pacific region.
EUR/JPY — actively traded at the start of the Tokyo session and sensitive to activity among Japanese market participants.
Best Forex Pairs to Trade During London Session
EUR/USD — the world's most liquid currency pair.
GBP/USD — one of the most prominent London session Forex pairs, often exhibiting high volatility at the start of the London session.
EUR/GBP — one of the most popular cross pairs in the European market.
USD/CHF — the Swiss franc responds strongly to the opening of European trading markets. Due to its status as a safe-haven asset, it is also sensitive to major international events.
GBP/JPY — an attractive cross-currency pair that can form sustained trends during the overlap between the Asian and European sessions.
Best Forex Pairs to Trade During New York Session
EUR/USD — exhibits the highest liquidity during the overlap between the London and New York sessions.
GBP/USD — is sensitive to the release of US macroeconomic data.
USD/CAD — a popular New York session Forex pair. It trades actively during the US session and is often used in a Silver Bullet (ICT) strategy that identifies price imbalances or fair value gaps (FVG).
Besides currency pairs, trading signals for gold (XAU/USD) frequently appear in the London and New York ICT Killzones. During the US session, this instrument typically exhibits high liquidity and often correlates with the EUR/USD pair.
ICT Killzones vs. Standard Forex Trading Sessions
ICT Killzones are relatively short time spans within trading sessions characterized by heightened volatility and high activity among major market participants. According to the ICT concept, it is during these periods that institutional players are most actively managing liquidity, which can shape daily highs and lows and form strong price movements.
Trading sessions cover the entire period of activity in the major Forex markets worldwide, whereas ICT Killzones represent specific time segments within these sessions.
Criteria | Regular Forex Sessions | ICT Killzones |
Duration | Long stretches of 8–9 hours | Small windows of 2–3 hours within the regular sessions |
Price behavior | Short-term and long-term trends, sideways movement | High volatility, sharp, sudden price movements |
Analysis tools | Technical analysis (support/resistance levels, trend lines, indicators), fundamental analysis | Smart Money Tools such as Order Blocks and Fair Value Gap (FVG) |
Main goal | Determining the general daily trend | Finding an entry point to capitalize on volatility for higher returns in the short term |
Conclusion
The ICT Killzones should be treated as guidelines rather than strict rules. While high volatility can occur at any time, it is generally more likely to increase during these periods.
The ICT Killzones concept is most commonly applied to major currency pairs, as well as gold and silver. Its effectiveness may be lower for stocks, illiquid assets, and local markets.
For more aggressive trading, the London and New York ICT Killzones are typically preferred due to higher liquidity and activity. According to the ICT framework, key intraday highs and lows often form during the London session, while the New York session is more prone to reversals and corrections, especially toward the London close.
For session-based trading, indicators that map trading hours and ranges can be useful. To improve signal quality, they should be combined with other technical tools such as trend indicators, volume analysis, oscillators, Fibonacci levels, and broader market structure methods.
You can test the ICT Killzones strategies on a demo account in MT4 or MT5. It allows you to study session behavior and evaluate your trading without risking real capital.
ICT Killzones FAQs
The indicator automatically highlights key ICT Killzones on the chart in different colors, adjusts for daylight saving and standard time changes, and helps traders quickly identify periods of increased market activity.
There is no such thing as a one-size-fits-all time frame. Typically, the broader trend is analyzed on the H4–D1 time frames, while entry points within Killzones are sought on the M15–M30 time frames, combining analysis across multiple time frames.
Killzones are periods of heightened activity within trading sessions. They are characterized by increased volatility and trading volume, sharp price movements, the formation of order blocks, and breakouts of key levels.
The London Kill Zone and the NY Kill Zone are the most commonly used trading windows for gold. It is during these periods that maximum liquidity, high trading volume, and strong price movements are typically observed.

The content of this article reflects the author’s opinion and does not necessarily reflect the official position of LiteFinance broker. The material published on this page is provided for informational purposes only and should not be considered as the provision of investment advice for the purposes of Directive 2014/65/EU.
According to copyright law, this article is considered intellectual property, which includes a prohibition on copying and distributing it without consent.