
A trading strategy known as Inner Circle Trader (ICT) is becoming increasingly popular. It is commonly described as trading by following the footprints of major market participants. The analysis of institutional behavior helps traders to understand market intent and join the price movement at the beginning of a trend.
The ICT strategy suggests that major market players profit by manipulating prices. By deliberately building liquidity, they create the momentum needed for significant price shifts. The ICT approach seeks to identify recurring patterns in this process, enabling retail traders to align their positions with institutional activity.
The article covers the following subjects:
Major Takeaways
- The ICT trading strategy was developed by trader Michael J. Huddleston and is positioned as a way to trade with smart money concepts. Through the ICT concept, traders learn to recognize market manipulation, identify recurring patterns, and capitalize on the price movements that follow.
- The ICT trading strategy is based on market structure, premium and discount zones, imbalances and gaps, order blocks, breaker blocks, kill zones, as well as support and resistance levels. Moreover, the approach highlights the role of trading sessions and risk management.
- Order blocks are price zones where large players accumulate positions without causing sharp price moves. Order blocks often form near highs or lows and precede price reversals. When price returns to an order block, it may provide entry opportunities. If the price breaks through an order block, this zone becomes a breaker block and can act as new support or resistance.
- Fair value gaps (FVGs) reflect price imbalances created by institutional activity. These gaps form when large orders are executed, causing strong price movements. Price often returns to these gaps to rebalance supply and demand.
- A kill zone is a time period when institutional traders are most active. During these sessions, the best trading opportunities appear. In the ICT approach, Forex trading is usually concentrated during this time.
- Trading algorithm: first, determine the market structure. Identify the Asian session high and low, then wait for the London kill zone to start. During this period, look for optimal entry points. If an ICT pattern does not form during the London session, wait for one during the New York kill zone. Exit points are typically prior highs or lows, key levels, or earlier imbalances.
What Is the ICT Trading Strategy?
The ICT trading strategy was created in 2016 by American trader Michael Huddleston. His experience working at a major bank and exposure to institutional trading algorithms helped him understand price manipulation and the dynamics of supply and demand.
ICT in trading stands for Inner Circle Trader, a strategy based on the idea that markets are moved by large financial institutions, while retail traders mainly supply liquidity. The method is classified as an intraday trading strategy.
ICT Definition: Inner Circle Trader Methodology
The Inner Circle Trader (ICT) strategy is a methodology for analyzing financial markets. It assumes that price moves in search of liquidity and that large market participants, often referred to as smart money, play a key role in this process.
Core ICT concepts focus on:
- price behavior near liquidity zones (stop orders, equal highs/lows);
- market structure shifts;
- imbalances between supply and demand (Fair Value Gaps);
- areas of potential institutional activity (Order Blocks);
- periods of increased activity (London or New York kill zones);
- price assessment relative to premium and discount zones;
- market manipulation;
- identifying potential entry points.
The goal of the method is to align retail trade entries with the expected actions of major market participants, thereby reducing risk and improving the risk-to-reward ratio.
Key Inner Circle Trader Methods
Let's explore the ICT principles, including their core elements, what they mean, and how to identify and apply them in trading.
Key elements of the ICT strategy are:
- liquidity zones (stop-loss orders, equal highs/lows, the Asian session range);
- Fair value gaps;
- order block and breaker block;
- market structure shift;
- premium and discount zones;
- kill zones (London or New York kill zone);
- a focus on indices and major Forex pairs (S&P 500, EUR/USD, GBP/USD).
Order Blocks: How Institutional Traders Leave Footprints
An order block is a price zone where large market participants place their orders, often triggering strong price movements.
Traders using smart money and ICT concepts closely monitor order blocks on the price chart to identify areas where large market participants build positions. When an asset reaches these zones, it often bounces off them, allowing order blocks to act as support and resistance levels. There are two types of order blocks:
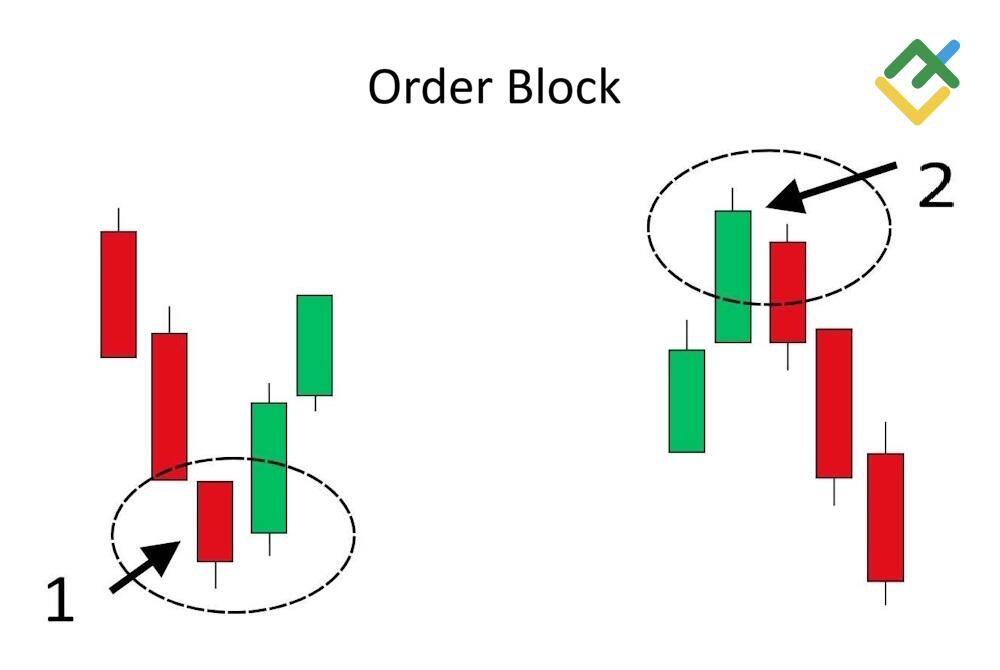
- A bullish order block is formed by the last bearish candle before a strong bullish move. It can act as a support zone.
- A bearish order block is formed by the last bullish candle preceding a strong bearish move. It may serve as a resistance zone once the price retests it.
Pattern Psychology
Order blocks typically form near the end of an upward or downward move, where large market participants place high-volume buy or sell orders. While the majority of traders may be selling, institutional players are often buying, and vice versa. This imbalance can lead to a market reversal. A zone is considered an order block only if it is followed by a significant price move.
Pattern Features
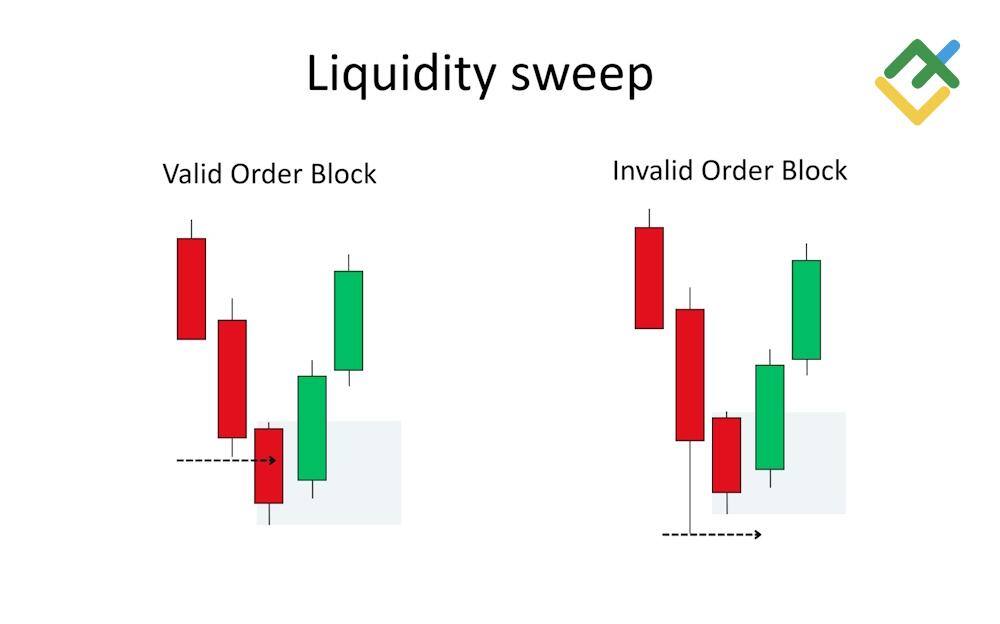
You can distinguish an order block from a regular candlestick by the following features.
Liquidity sweep. In a bullish scenario, the bearish candlestick sweeps liquidity by breaking below the low of the previous candlestick. In a bearish scenario, the bullish candlestick sweeps liquidity by breaking above the high of the previous candlestick.
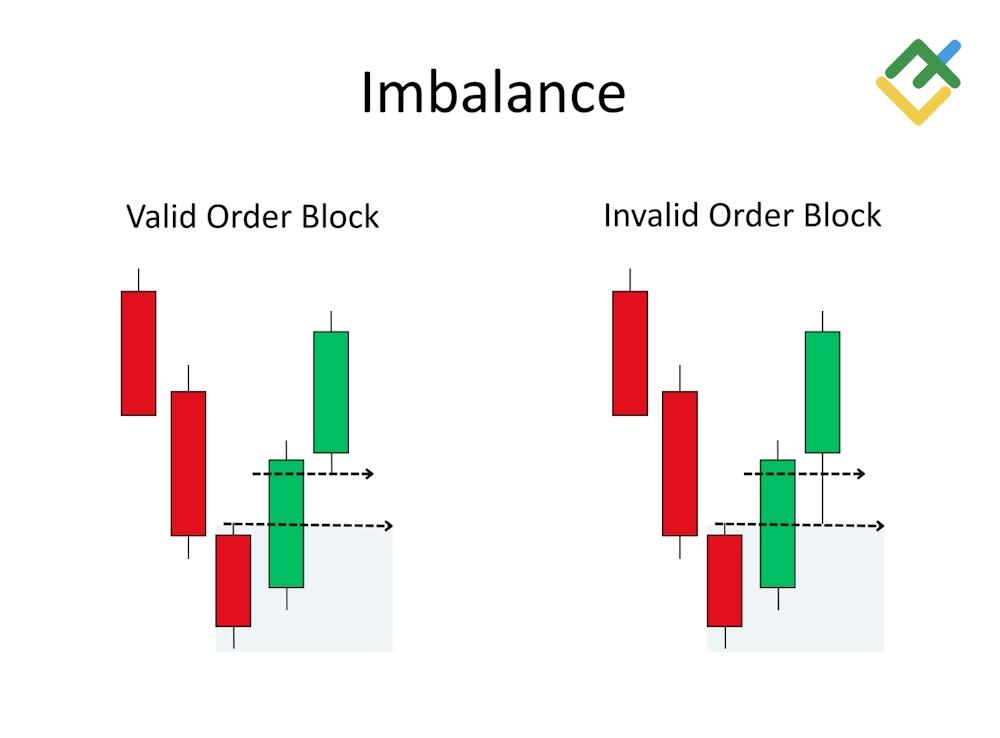
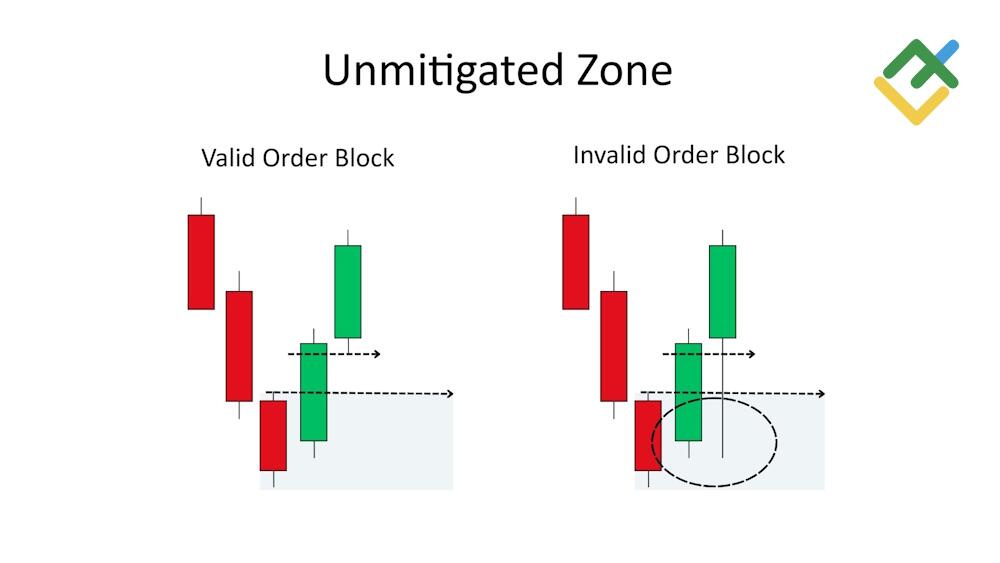
Imbalance. After an order block forms, the price moves away quickly, leaving an imbalance. This occurs when there is a gap between consecutive candlesticks, meaning the upper shadow of one candlestick does not overlap with the lower shadow of the next candlestick.
Unmitigated zone. This is a price zone where major market participants previously placed orders, but the price has not yet returned to it. As a result, the orders in this zone are considered still active or unmitigated.
Fair Value Gaps: Trading Price Imbalances
The Fair Value Gap (FVG) is a key concept in ICT. It represents a price imbalance that happens when large market participants buy or sell significant volumes at market prices, causing the price to change too quickly.
Modern markets are generally well-balanced. When a sudden imbalance occurs, the price often returns to the FVG or the balanced price range to restore equilibrium. Traders who follow the ICT concept use this behavior to their advantage.
How the FVG Pattern Forms
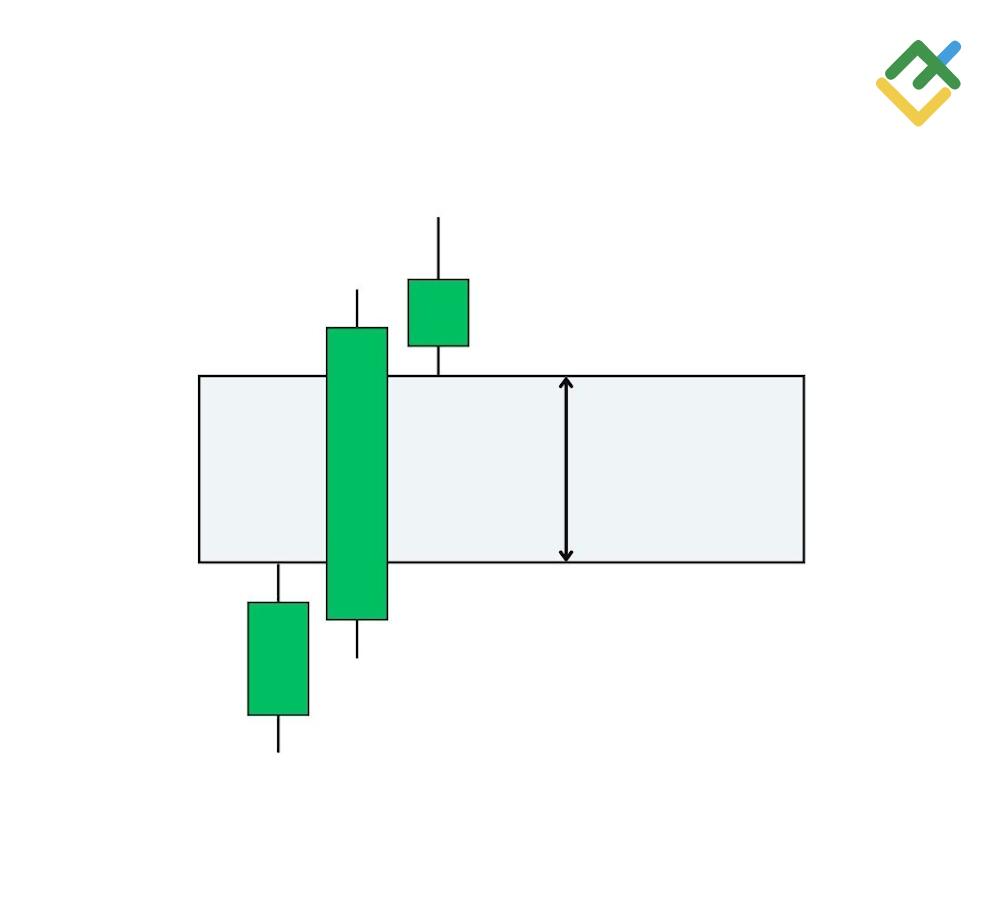
The FVG pattern consists of three candlesticks, with a gap between the first and the third.
A bullish FVG appears when the high of the first candlestick is below the low of the third one, leaving an untraded price imbalance between them. This indicates that the price rose so quickly that certain price levels were not efficiently traded.
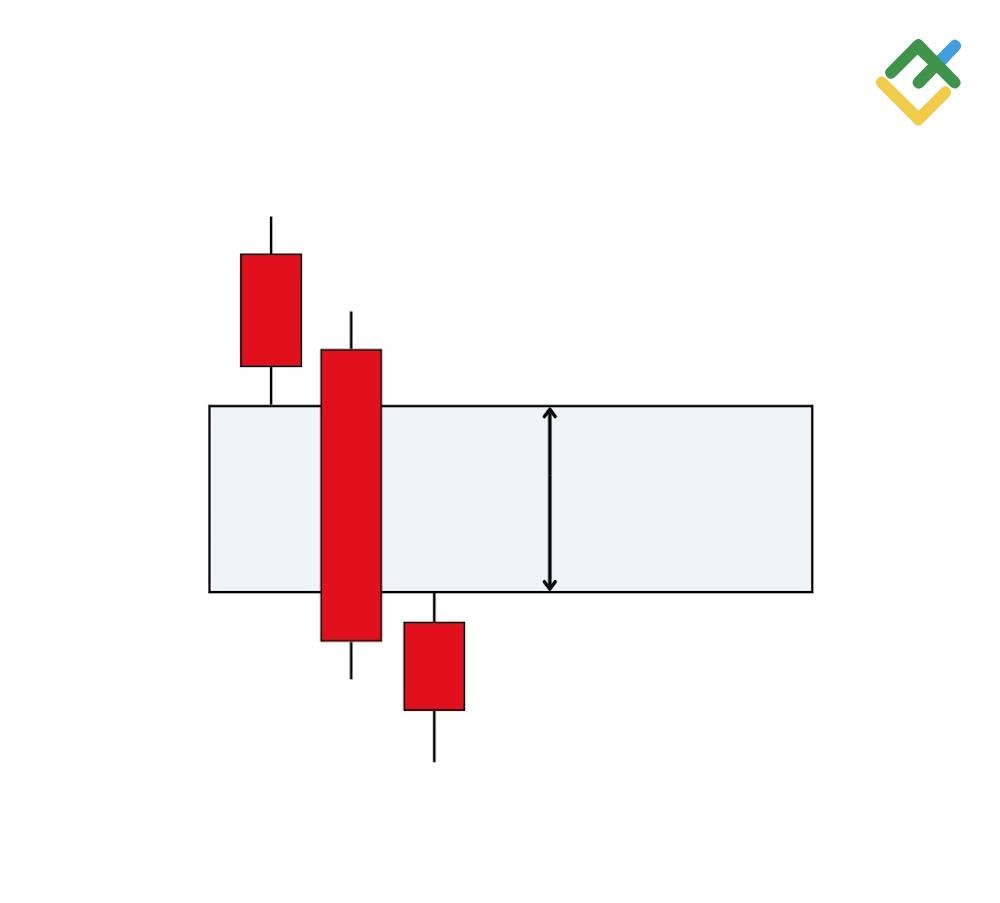
A bearish FVG occurs when the low of the first candlestick is above the high of the third candlestick, creating an imbalance between them.
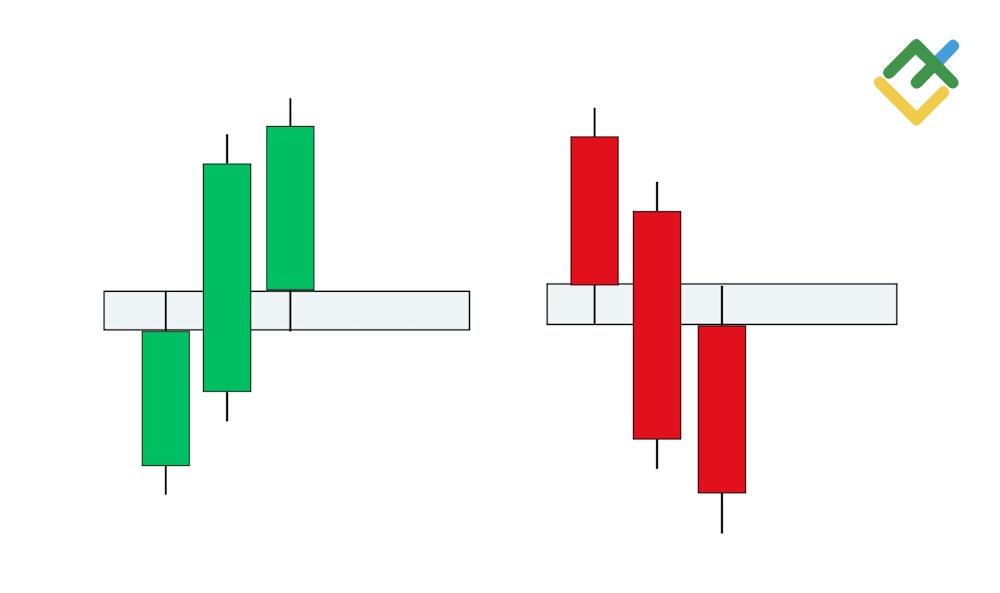
- When the shadows of the first and third candlesticks overlap, it indicates that the price range has been traded, meaning no FVG is formed.
How to Trade the FVG Pattern
There are several ways to trade this pattern.
- Place a buy/sell limit order slightly below/above the low/high of the third candlestick. The price often reaches the limit order level, though the entry price is not always favorable.
- Wait for the price to return to the gap area. When a candlestick touches the upper or lower boundary of the zone and then closes beyond it, an entry signal appears. Sustained bullish pressure in this area suggests that the price is likely to continue moving higher, confirming a clear market reaction to the FVG.
- Look for a deeper pullback into the gap area. The midpoint of the FVG is marked as a reference level. A candlestick that touches this level and then closes beyond it is considered a valid signal.
If the price breaks through the outer boundary of the pattern, the gap is considered filled, and the FVG pattern becomes invalid. In all cases, the stop-loss order is placed either beyond the extreme of the second candlestick or beyond the extreme of the first, depending on the trader's risk tolerance and prevailing market volatility.
Liquidity Pools and Market Manipulation
Liquidity pools tend to form above highs or below lows, depending on the prevailing trend. Most market participants typically place their stop-loss orders above a swing high or below a swing low. Large market players may seek to access this liquidity by deliberately pushing the price to trigger retail traders' stop orders.
This often leads to false breakouts, where trades are stopped out, and the price then reverses. This process represents the collection of stop-loss orders and the absorption of market liquidity. Within the ICT framework, such market activity is referred to as manipulation.
Traders often referred to as the "inner circle" closely monitor sharp price moves that extend beyond key extremes and are followed by a reversal. It is generally believed that the most prominent zones tend to form during periods of low trading volume or near the boundaries of trading sessions.
Example. Liquidity pools on the EURUSD chart:
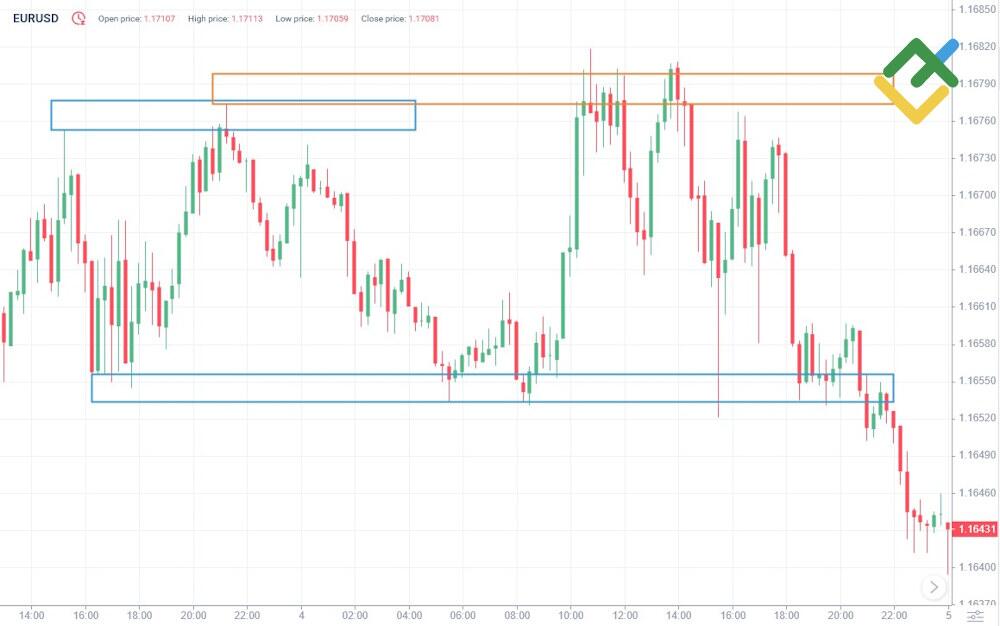
If an asset reaches a new extreme and then the market reverses sharply, ICT traders open positions in the direction of the reversal.
Premium and Discount Zones
Premium and discount zones are areas that help traders determine whether the price is relatively high or low. When the price is above the midpoint of the range, it is considered to be in a premium zone, which is typically used to look for short entries. When the price is below the midpoint, it is considered to be in a discount zone, which is commonly used to open long trades. These zones are often identified using Fibonacci levels, most commonly the 50–61.8% retracement, although experienced traders can often define them visually.
Market Structure Shift: Reading Trend Changes
Market structure is one of the most crucial concepts in the ICT Forex strategy and refers to the sequence of highs and lows formed by price.
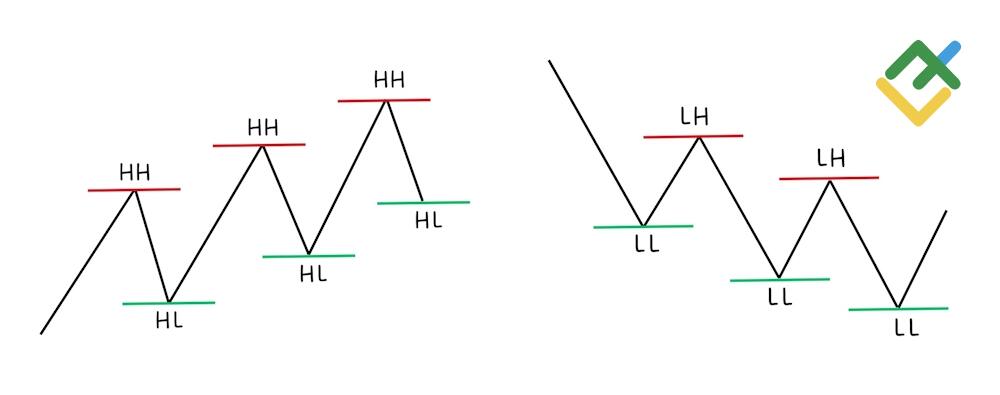
A downtrend is characterized by a sequence of declines and recoveries, with the price continuing to move lower after each drop. During this process, the market forms progressively lower swing lows and lower swing highs, creating a bearish market structure. In contrast, an uptrend consists of advances and temporary pullbacks, where each rally produces higher highs and higher swing lows. This pattern defines a bullish market structure.
The figure below shows simplified examples of bullish and bearish market structures, where HH stands for higher high, HL for higher low, LH for lower high, and LL for lower low.
The ICT Forex trading system is based on trend following. Traders aim to join the movement after prices return to key levels such as price gaps, order blocks, FVGs, or previous lows/highs.
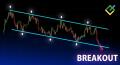
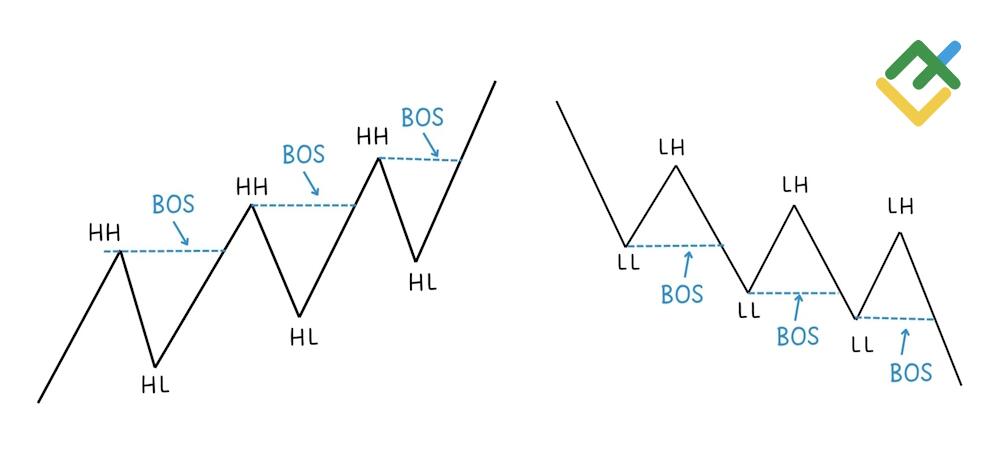
A break of structure (BOS) occurs when the price breaks through the previous high in an uptrend or the previous low in a downtrend. The BOS provides insight into the direction of the asset and is one of the most important concepts in price action analysis and large-scale trading.
A market structure shift (MSS) happens when the price breaks a key level that maintains the current trend. In an uptrend, an MSS is identified when the price breaks below the most recent higher low, signaling a potential shift to a bearish structure. In a downtrend, it occurs when the price breaks above the most recent lower high, suggesting a possible shift to a bullish structure. Such breakouts indicate that the market may be changing direction.
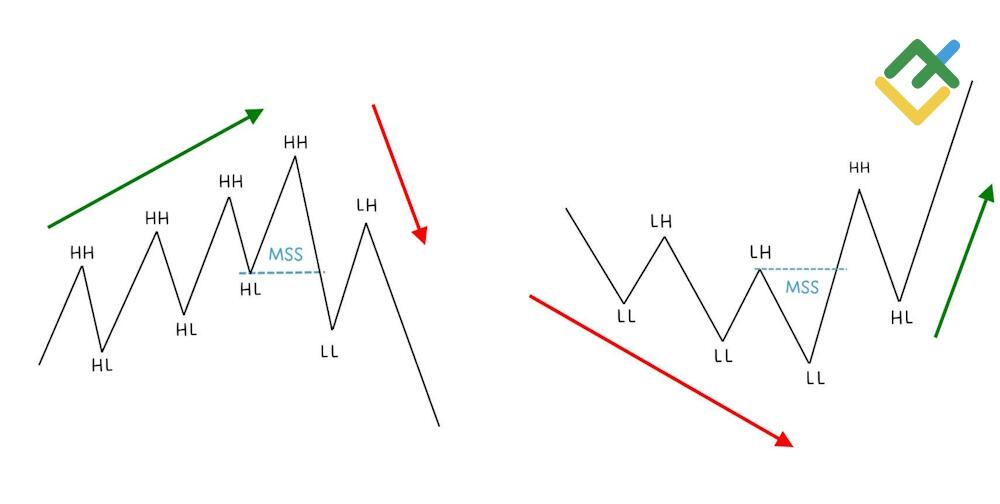
The breakout should occur during a strong impulsive move, characterized by large candlesticks, significant imbalance, or a clear shift in price behavior.
ICT Trading Sessions: Best Time to Trade
The ICT approach recognizes that price does not move uniformly throughout the trading day. There are specific periods when major market participants are more active. The Inner Circle trading strategy defines optimal hours for opening trades, known as kill zones.
Asian Session Range: Setting Up Daily Bias
Asian session range (ICT): 20:00–00:00 (EST).
The Asian trading session marks the start of the trading day and is well-suited for trading Asian currencies, stock indices, and cryptocurrencies. Price action during this session is often slow, but it typically forms a range that smart money later uses to accumulate liquidity during the London session. In the ICT approach, this period is mainly observed to identify key session highs and lows.
London and New York Kill Zones: Where the Action Happens
The London and New York kill zones play a key role in the ICT trading strategy. For much of the time, the market tends to fluctuate, consolidate, and show no clear direction. However, during these kill zones, traders often observe the following:
- liquidity sweeps;
- order blocks;
- FVGs;
- BOS or MSS.
This happens because large market participants actively open and manage positions during these periods. Kill zones help traders avoid unprofitable setups and focus on trades that offer higher potential returns.
The Inner Circle Trader method tends to be most effective during the London and New York Kill Zones, when market liquidity and participation are highest.
London Kill Zone: 2:00–5:00 (EST)
When the London trading session begins, financial markets hit full swing and volatility increases. This period often coincides with the release of key European news.
The London kill zone is characterized by:
- liquidity sweeps above or below the Asian session range;
- the formation of a new daily high or low;
- the achievement of price targets set by traders.
New York Kill Zone: 7:00–10:00 (EST)
New York is the world's leading financial center. The most aggressive price movements often begin with the opening of trading on the New York Stock Exchange (NYSE). The New York kill zone covers the start of the US trading session and partially overlaps with the closing phase of the London session.
During this period, the price often:
- forms a BOS;
- provides liquidity on one side and moves in the opposite direction;
- shows the most ICT setups, including gaps, order blocks, FVGs, FVG inversions, breaker blocks, liquidity pools, etc.
Thus, the London kill zone and the New York kill zone offer traders the perfect time to trade alongside institutional players.
How to Apply the ICT Method in Real Trading
To use the ICT strategy effectively, you need to identify the overall market direction, mark the most favorable and least favorable periods of the trading day, and spot areas of liquidity accumulation and order blocks.
Step 1: Analyze Market Structure on Higher Time Frames
First, determine the current market structure: bullish, bearish, or sideways. You need to do this before the London kill zone begins.
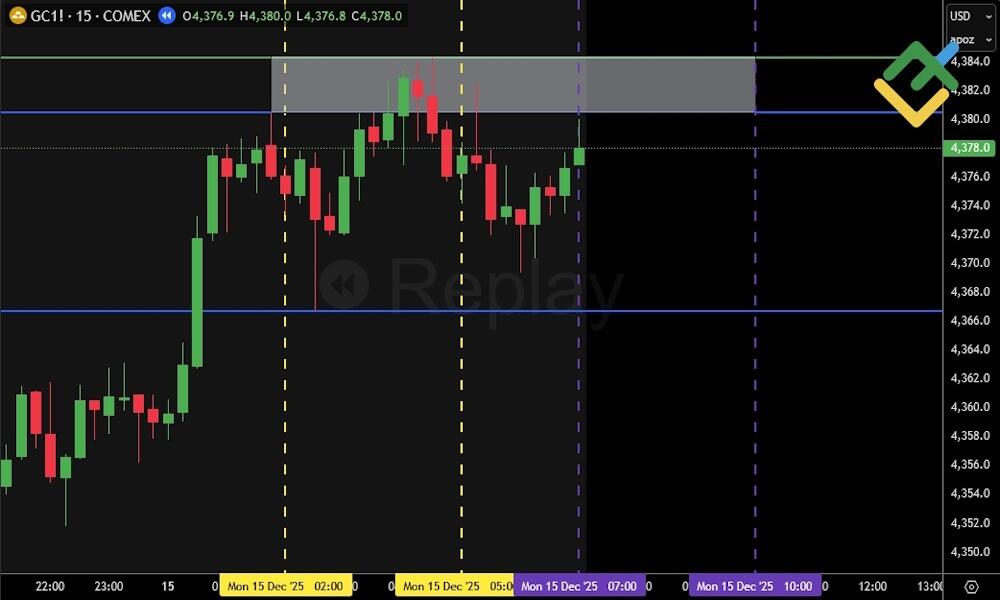
Example: Let's analyze gold futures (GC) on the M15 time frame. Wait until 2:00 EST and define the market structure. Pay close attention to the formation of key highs and lows. You can also use the previous day's high and low as reference levels.
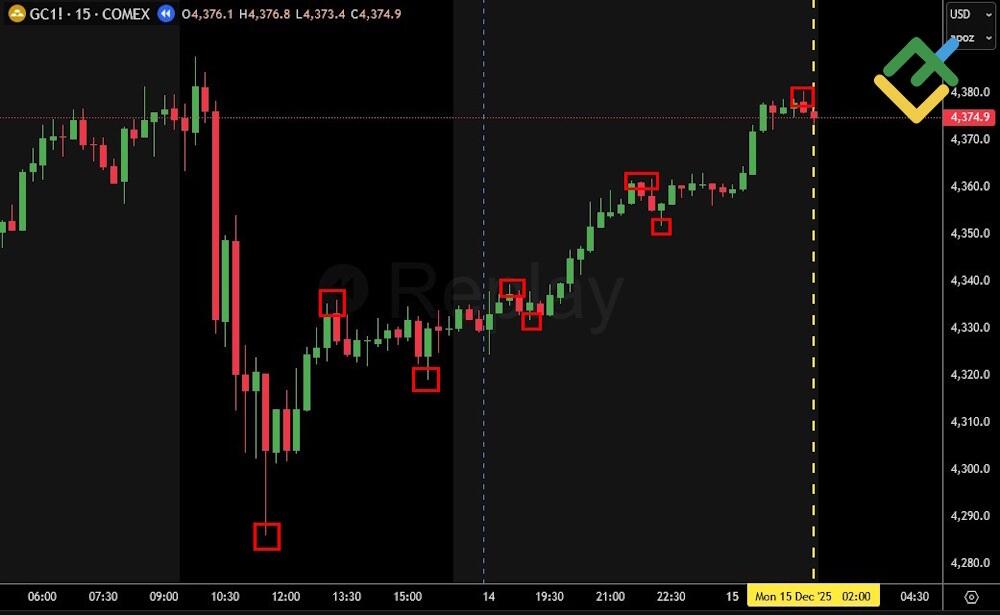
Judging by the highs and lows on the 15-minute chart, the structure is bullish. Therefore, it is profitable to open long trades during the London trading session, or to wait for a market structure shift.
Step 2: Identify Key Liquidity Levels and Order Blocks
Next, identify the daily low and high, as well as the nearest high and low. These are key levels where liquidity sweep may occur. Additionally, note the last bullish order block in the structure.
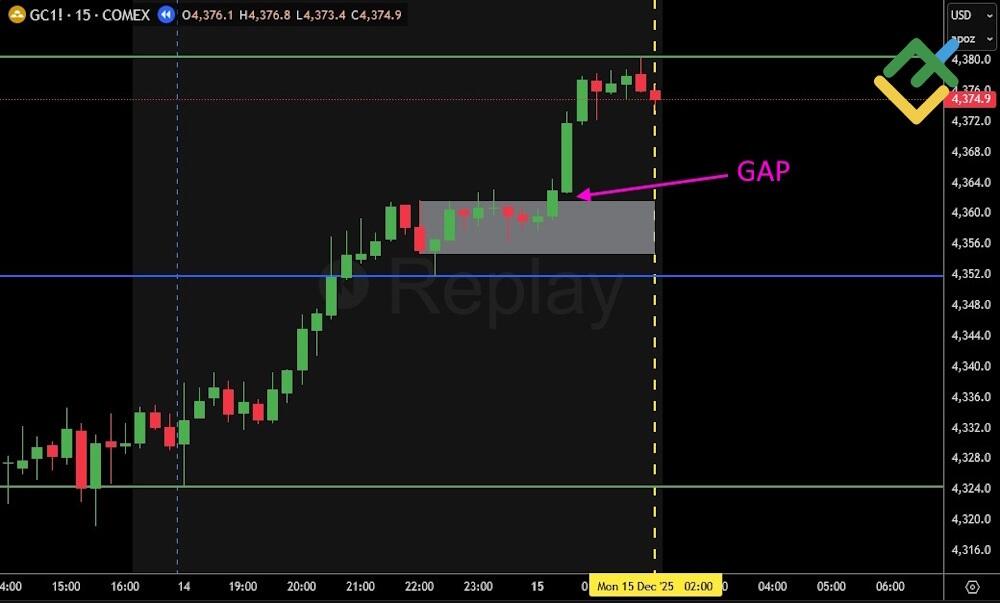
The daily high and low are marked with a green line, while the most recent swing low is highlighted with a blue line. The latest swing high aligns with the daily high. The bullish order block is identified as a bearish candlestick formed during the Asian session that held the price for an extended period before being broken. This breakout left a gap, which qualifies it as an ICT order block.
Candlesticks that remain within the opening and closing range of the bearish candlestick can be considered insignificant, as they do not influence the current market structure.
Step 3: Wait for Kill Zone and Entry Confirmation
The next step is to wait for the London or New York kill zone to begin. Assume that the London kill zone has started. This means that it is time to look for ICT patterns.
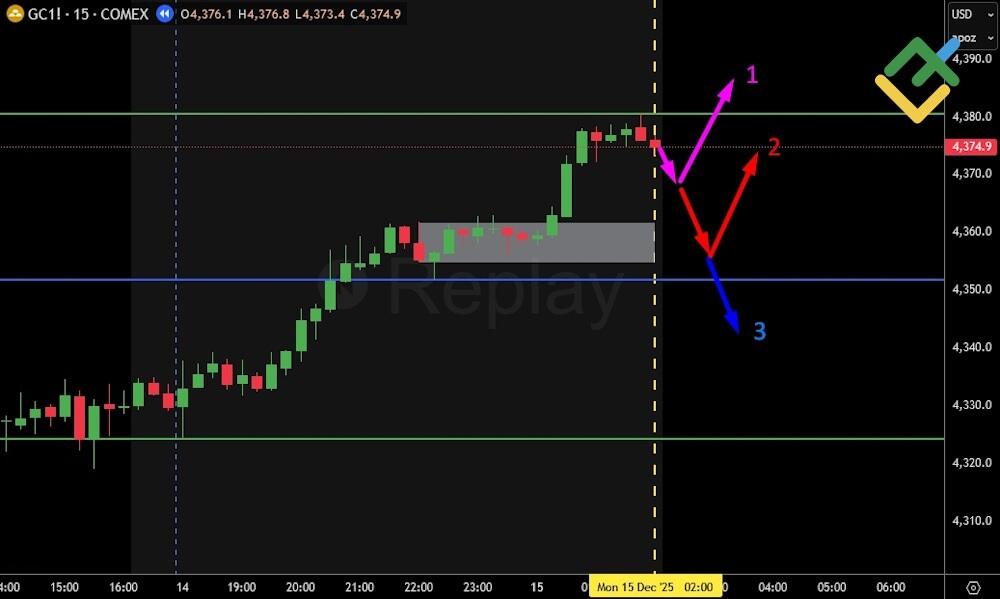
The situation can develop in three likely scenarios:
- The price will continue its uptrend: new lows and highs will appear above the previous ones, and the daily high will be exceeded.
- The price will undergo a correction to accumulate liquidity before further growth.
- A shift will occur, and the market will reverse downward.
Initially, the price declined in a correction, forming a new swing low. It then resumed higher and set a new daily high. Let's highlight these changes on the chart below and mark a liquidity pool with a gray rectangle resting above the high formed during the Asian trading session.
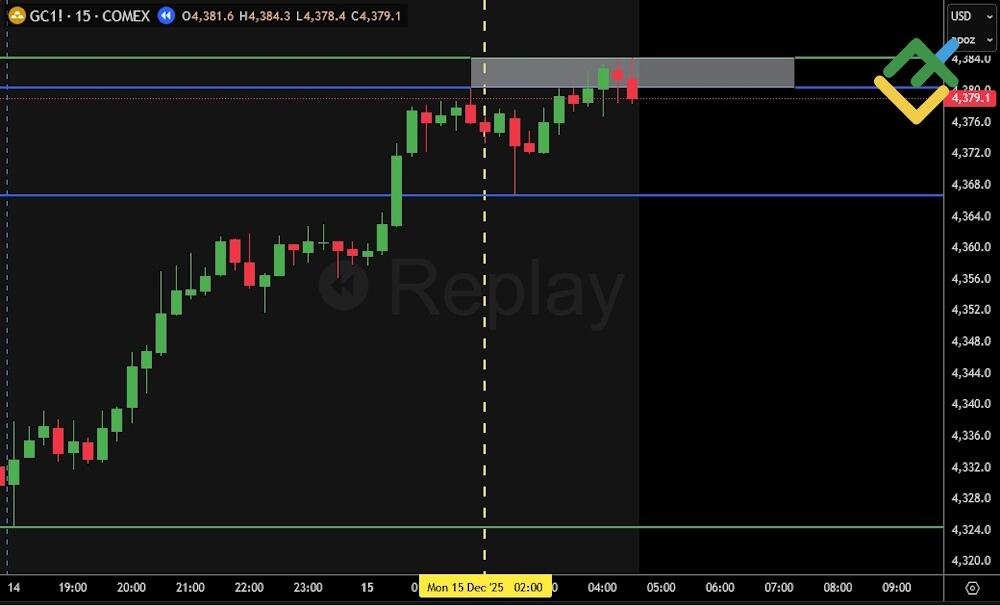
The London kill zone offers no trading opportunities, so attention shifts to the US kill zone. As the US session begins, price sweeps liquidity near the Asian session high and reacts sharply. However, the market structure remains unchanged, and there are no clear signs of an order block or an FVG. As a result, no valid entry opportunities are present at this stage.
What can we expect from the New York kill zone? Either a continuation of the trend and setting new highs, or a market structure shift followed by an ICT bearish pattern.
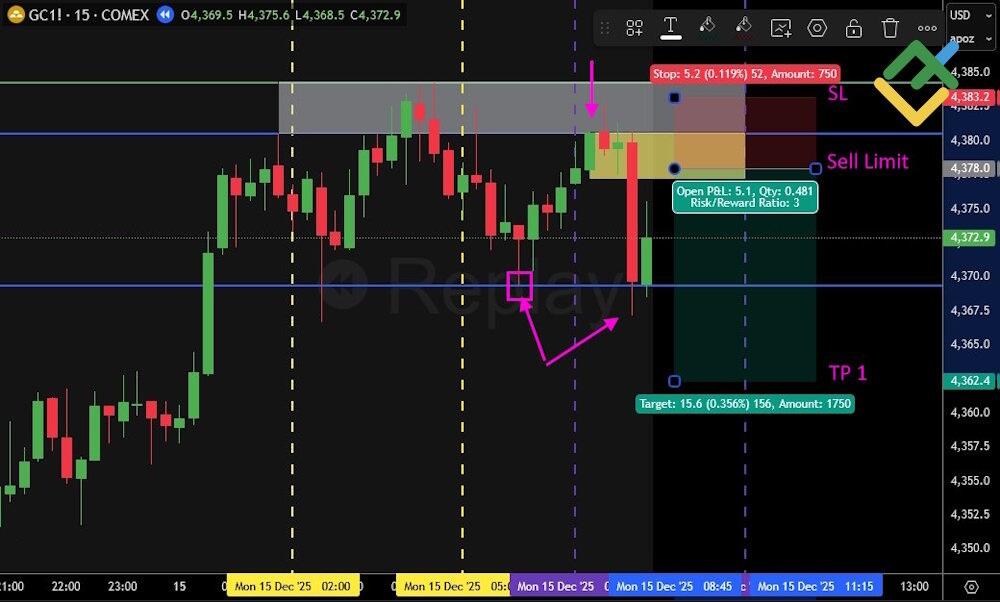
A few minutes later, a market structure shift occurs as price breaks below the previous low. A bearish order block can be identified at the last bullish candlestick highlighted by the yellow rectangle. This is followed by a brief consolidation formed by two 15-minute candlesticks and then a strong bearish impulse. The order block forms within the liquidity sweep zone, which strengthens the setup. As a result, a pending sell order can be placed just below the order block, with the stop-loss order set above its high.
Profits can be secured in two stages:
- Take part of the profits based on a profit-to-risk ratio of 3:1.
- The remaining part can be closed at the daily low.
If the pending sell order is not triggered during the US kill zone, cancel it and wait for the next trading day.
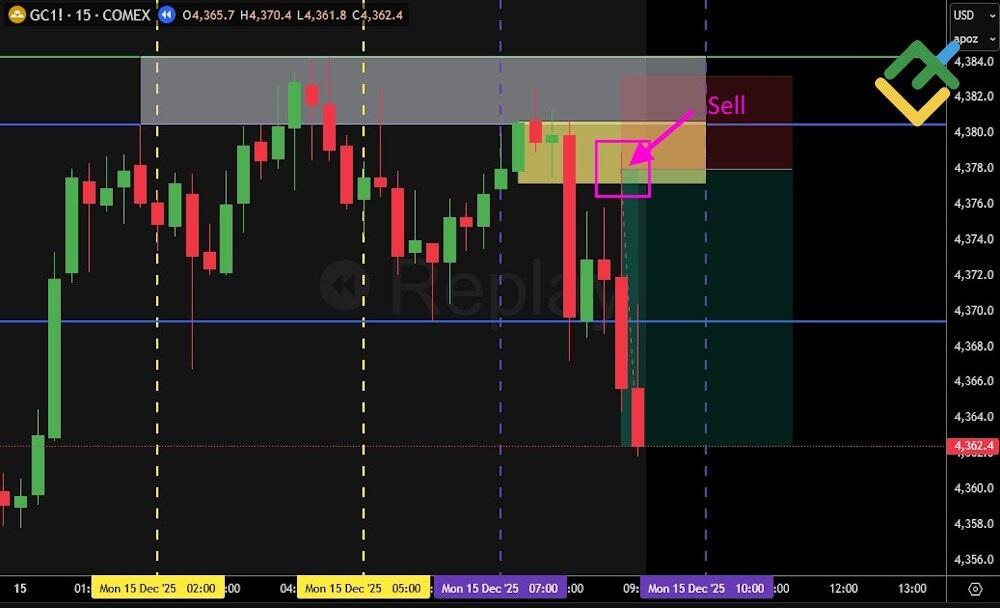
However, the sell order in our case is activated by the shadow of the 15-minute candlestick. After that, the price starts to fall swiftly as expected.
The price reaches the first take-profit level. We can close the entire trade here, as the market has already yielded a 3:1 return, or we can hold part of the trade open, anticipating further decrease.
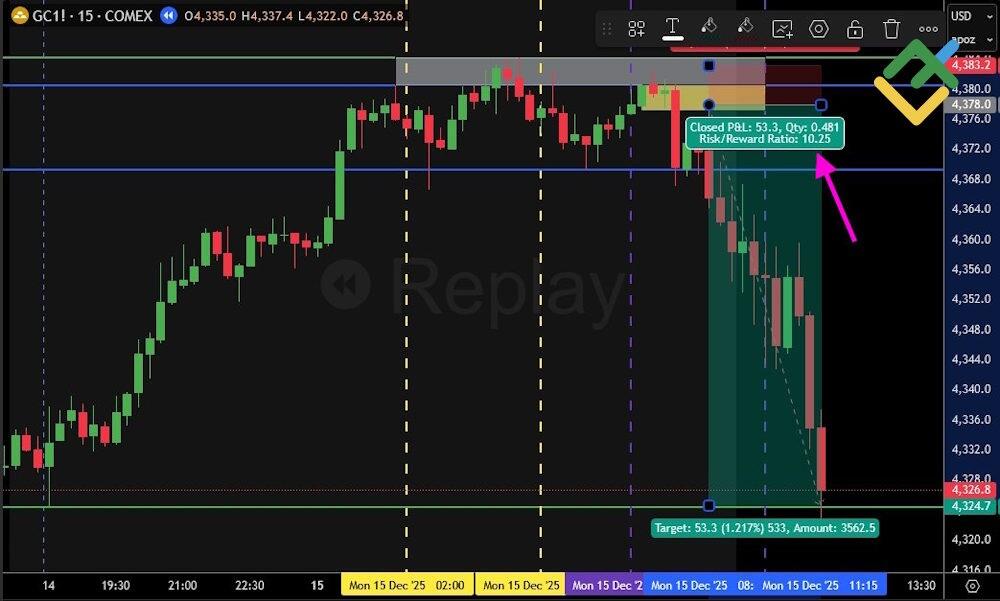
Eventually, the price plunges below the daily low and reaches the second take-profit target. The remaining position reaches a 10:1 risk-to-reward ratio. After the trade is completed, profits are secured, and preparation begins for the next trading day.
Conclusion
The ICT strategy is a powerful tool for experienced traders. It works best for those who already understand key ICT trading concepts such as market structure, liquidity accumulation, institutional traders, false breakouts, trend reversals, Price Action, and smart money. For beginners, ICT trading can appear complex, as it requires a deep understanding of price movement, market dynamics, and the ability to analyze multiple elements of the system simultaneously. In addition, the subjective nature of market analysis can create challenges, including pattern interpretation, the identification of liquidity zones, and discrepancies in broker price data.
However, by mastering the core principles of the ICT trading strategy and gaining practical experience, traders can develop a powerful framework for consistent and highly profitable trading.
ICT Trading Strategy FAQs
ICT trading (Inner Circle Trader) was developed by Michael Huddleston, an American trader and mentor who created a methodology for analyzing the market from the perspective of institutional players.
ICT trading can be profitable when the methodology is well understood and supported by strict risk management and discipline. However, it offers no guarantees and requires extensive training, consistent practice, and strong psychological resilience.
ICT stands for Inner Circle Trader, a market analysis approach centered on the actions of institutional players or smart money. The method involves studying liquidity, market extremes, trading session timing, and identifying price imbalances.
ICT trading for beginners is an approach that teaches you how to analyze the logic behind price movements, liquidity, and the behavior of major traders. This approach focuses on logic rather than indicators or signals.
Yes, the ICT strategy can be applied to the Forex market. It helps analyze currency pairs, liquidity, trading sessions, and the behavior of major market participants while maintaining sound risk management principles.
In ICT trading, kill zones are specific time windows during major trading sessions when liquidity and institutional activity increase, raising the probability of impulsive moves, reversals, and optimal trade entries.

The content of this article reflects the author’s opinion and does not necessarily reflect the official position of LiteFinance broker. The material published on this page is provided for informational purposes only and should not be considered as the provision of investment advice for the purposes of Directive 2014/65/EU.
According to copyright law, this article is considered intellectual property, which includes a prohibition on copying and distributing it without consent.