The Camarilla Pivot Points indicator is a powerful tool for intraday trading. It was developed by trader Nick Scott in 1989 based on ideas from the 1930s about price returning to the previous day's close. As a professional trader, I frequently use the pivot points to identify key support and resistance levels where a trend may reverse or strengthen, and combine this indicator with price action patterns to determine entry points more precisely.
In this article, you will learn how to calculate Camarilla pivot points, interpret breakout or rebound signals, and master effective trading strategies: from range trading to catching strong trends. You will also learn how to set stop-loss and take-profit orders in MT4, combine the indicator with oscillators, and test it to enhance your trading performance.
The article covers the following subjects:
- Major Takeaways
- What is the Camarilla Pivot Point
- Key Trading Rules for Camarilla Pivots
- Camarilla Pivot MT4 Indicator
- How Are Camarilla Pivot Points Calculated?
- How to Trade Camarilla Pivot Points
- Camarilla Pivot Trading Strategies
- Pros and Cons of Camarilla Pivot Points
- Conclusion
- Camarilla Pivot Points FAQs
Major Takeaways
- Created by Nick Scott in 1989, the Camarilla Pivot Points indicator predicts intraday price reversals using the high, low, and closing prices of the previous candlestick.
- The R1/S1 levels point to a flat market, while R3/S3 and R4/S4 are key reversal or breakout zones for trend trading.
- The indicator is used to find entry/exit points, set stop-loss and take-profit orders, and amplify signals from oscillators, the RSI, MACD, and moving averages.
- It is optimal for M30–H1 time frames; on M5–M15, there is more noise, and on higher time frames from H4, the price often breaks through the key levels.
- It can be applied to currencies, stocks, and cryptocurrencies, but requires adjustment for asset volatility and testing on a demo account.
- A breakout of R4/S4 confirms a strong trend, while price movement in the R1–S1 range indicates a flat market, and R3–S3 indicates trading within a price channel.
- Mathematical calculations minimize subjectivity, but the indicator does not take into account news and trading volume, requiring additional tools for more accurate results.
What is the Camarilla Pivot Point
There are two main types of tools in chart analysis:
- Price Action patterns: candlestick formations that can indicate the beginning of a new trend, the continuation of an existing one, or a price reversal.
- Levels: resistance and support levels, trend lines, pivot levels.
Pivot points are key thresholds where a price reversal may take place, often referred to as pivot levels. They can function as hidden resistance and support levels, acting as benchmarks that help gauge the length of a trend, its strength, and potential reversal points. The algorithm for calculating these levels is entirely mathematical, relying on the prices from the previous candlestick along with specific adjustment multipliers.
Initially, the central level is plotted. Subsequently, resistance R1 and support S1 are built at equal distances from the central point. At a greater distance, resistance R2 and support S2 are established. Further still, resistance R3 and support S3 levels are determined, and so on. Although pivot level calculators and indicators generally focus on three or four levels, there is no limit to the number of levels that may be calculated manually.
Types of pivot points: Classic, Fibonacci, Woodie, DeMark, Camarilla. Their differences lie in the formula for calculating the levels.
Camarilla pivot points help traders:
- identify potential reversal points;
- detect best times to buy or sell;
- set pending orders;
- determine bullish or bearish zones within a day;
- pinpoint a new trend;
- estimate the extent of possible corrections.
Camarilla pivot points are most often utilized as a supplementary indicator that confirms the signals generated by other tools. This eliminates subjective errors, increasing the probability of profitable trades.
Key Trading Rules for Camarilla Pivots
The concept of trading currencies, stocks, cryptocurrencies, and various other assets using Camarilla pivot points revolves around the idea that the price tends to revert to its mean value over a period. The further the price moves away from its mean value, the greater the probability of a reversal. In pivot points, the mean value is the closing price of the previous candlestick, which reflects the balance between the highest and lowest prices during that period.
The basic rules of Camarilla pivot points trading:
- R1/S1 are considered weak levels. If the price moves between them and cannot break through these levels, it means that the market is flat.
- R2/S2 are stronger levels. They are used for taking profits if the R1/S1 levels are breached.
- R3/S3 are strong benchmark levels at which the probability of reversal is high. If the price bounces off R3, short trades can be considered. If it rebounds from S3, one may consider long positions.
- R4/S4 are the most significant benchmark levels. The R3–R4 and S3–S4 zones are the areas of the most probable trend reversal. If R4 or S4 is pierced, consider long or short trades, respectively.
- Trading typically takes place intraday on the M30–H1 time frames. On the M5–M15 time frames, there is a lot of price noise and significant influence from market makers, which leads to unstable trend movements. In contrast, higher time frames tend to show more prolonged trends with pivot levels breakout.
- Camarilla pivot levels should coincide with resistance and support levels plotted through the trend extrema. Moreover, reversal patterns should confirm these levels. If Camarilla pivot levels coincide with the signals of other indicators, it boosts the likelihood of a potential price reversal.
- If the price opens above the R1 level, one may consider long trades. Conversely, if the trading session starts below the S1 level, short trades can be initiated. Should the price fail to break through R2 or S2, it may start moving in the R2–S2 range.
- If you define the high and low prices from the previous trading session as support and resistance levels, the breakout of either line will be a signal to open a trade in the direction of the trend.
The indicator is adjusted individually for each asset and each time frame, taking into account the average intraday volatility, volatility in different trading sessions, or the degree of price response to news.
Camarilla Pivot MT4 Indicator
The tool is already integrated as a basic one into the LiteFinance web platform. To use it, select Indicators/Built-in and Pivot Points Standard on the chart.
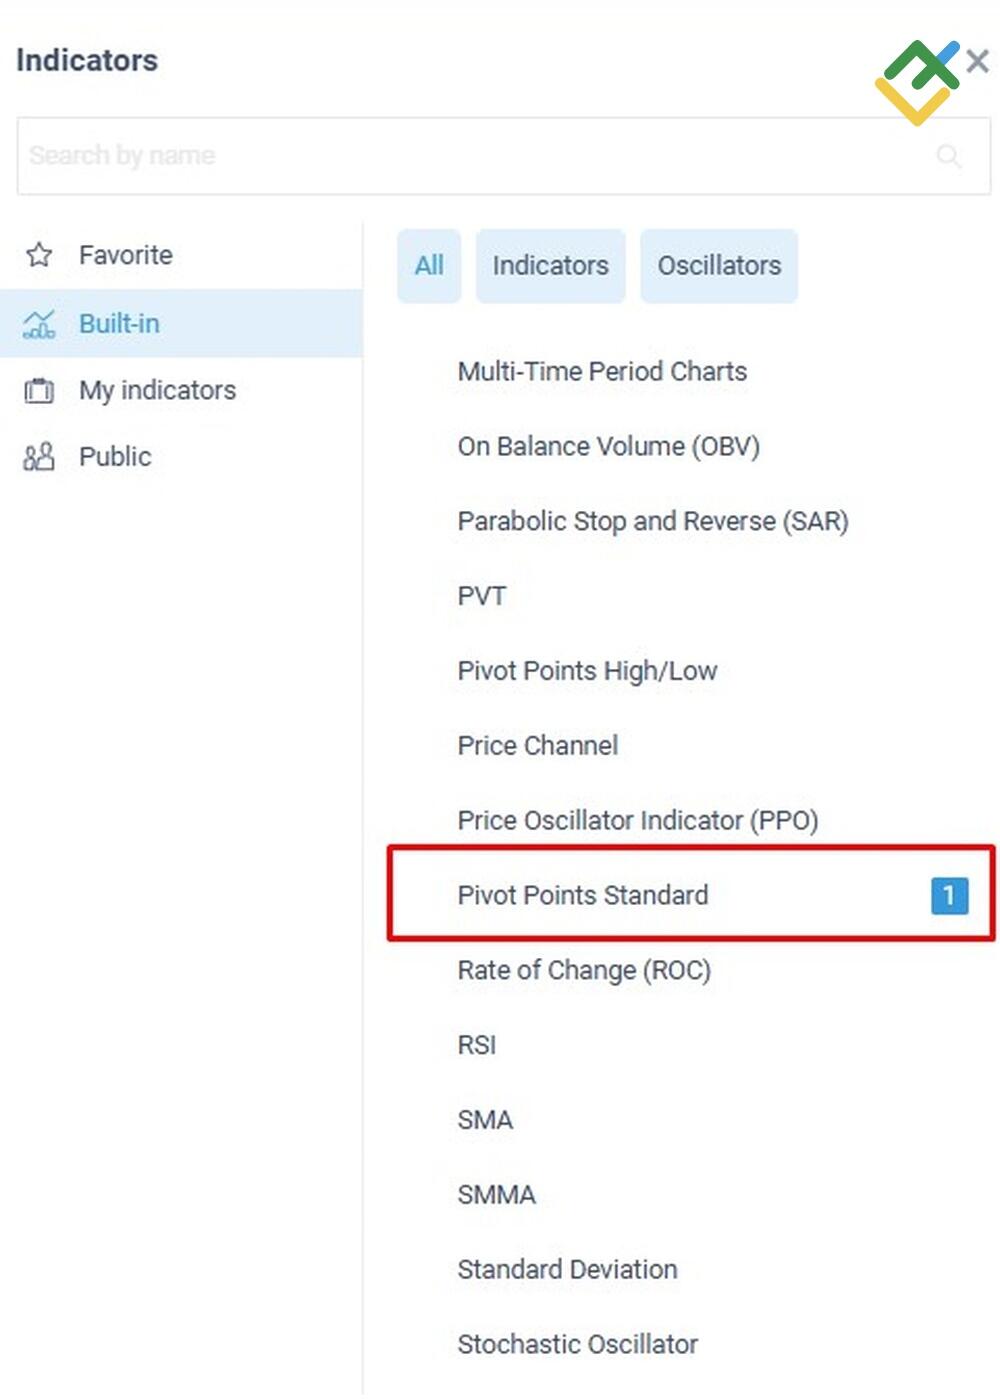
Then, choose the Camarilla display type in the indicator parameters.
Additionally, you can specify the time frame and the number of reverse values in the settings. The lowest possible time frame is daily, while the least number of reverse values is 2. This configuration means the chart will display the Camarilla Pivot levels calculated over the last two closed daily candlesticks. On the H4 time frame, each period will be equal to 6 candlesticks (6 × 4 = 24), whereas for the H1 time frame, it will correspond to 24 candlesticks.
MetaTrader 4 developers have not provided this indicator as a basic tool. Therefore, there are two options to use it.
Option 1. Camarilla pivot points building using a calculator.
Enter the four key price values of the last closed candlestick to calculate pivot levels for various indicator types. Then, apply them as horizontal lines on the MT4 chart.
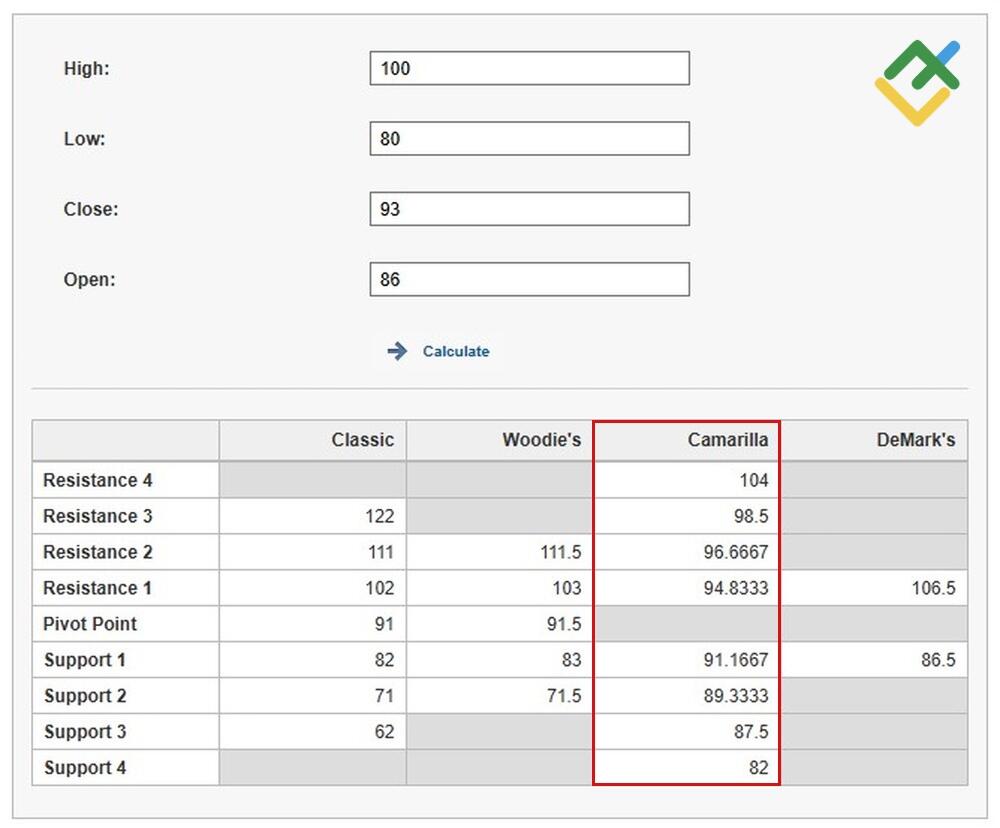
The main drawback is that each time a candlestick closes, you need to manually recalculate and reapply the levels. On the upside, some people find numerical information easier to understand than visual charts. Additionally, a calculator allows you to view calculations for multiple types of pivot points simultaneously. You can also overlay several indicators on the chart and set various calculation methods in the settings. However, having more than two dozen lines on a chart can make it look cluttered.
Option 2. Download and install the pivot point indicator into MT4.
The free indicator version for MT4 can be easily found on the Internet. For MT5, QUIK, or cTrader you should look for versions written by traders in the languages of these platforms, that is, MQL5 for MT5 and C# for cTrader.
Algorithm for adding the indicator to the chart:
- Click File/Open Data Folder in the top menu of the MT4 terminal.
- In the opened window, go to the MQL4/Indicators folder. Copy the indicator file you downloaded from the above link into this folder.
- Restart the terminal. The indicator will appear in the Custom category (Insert/Indicators).
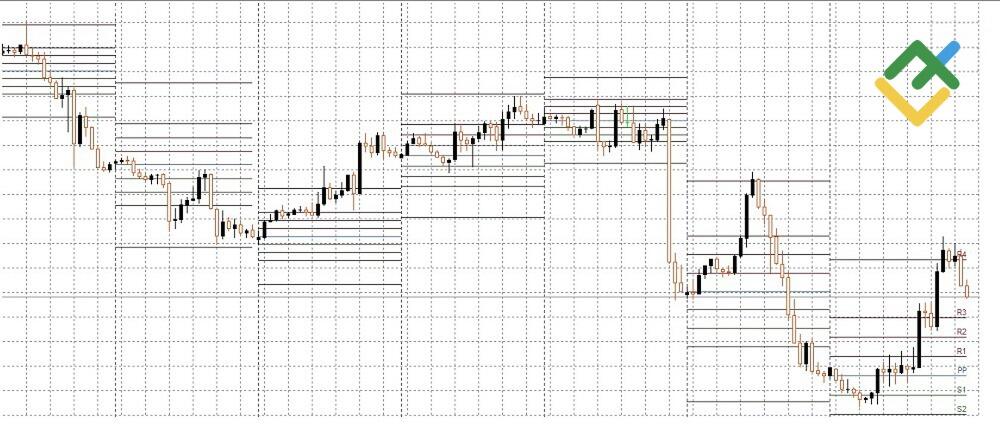
This is how the indicator looks on a chart. In the settings, you can select the calculation method (Camarilla in this case), the depth of pivot levels from 1 to 4, the calculation period, and the number of periods. In the chart above, the calculation period is set to daily, with the number of periods adjusted to 10, meaning the levels of the last ten daily candlesticks are displayed. However, since the H1 time frame is used, each range of pivot levels is calculated based on 24-hour candlesticks. This approach is convenient, as the indicator shows pivot levels for each time frame, allowing you to see which levels were tested, breached, or rejected, as well as which hourly candlestick within a day broke through a particular level.
How Are Camarilla Pivot Points Calculated?
Camarilla pivot points are calculated using three key prices: high, low, and close. Unlike other methods, there is no need to determine the central level in this approach. Only resistance and support levels are calculated, four in each direction.
R4 = (H - L) × 1.1 / 2 + C
R3 = (H - L) × 1.1 / 4 + C
R2 = (H - L) × 1.1 / 6 + C
R1 = (H - L) × 1.1 / 12 + C
S1 = C - (H - L) × 1.1 / 12
S2 = C - (H - L) × 1.1 / 6
S3 = C - (H - L) × 1.1 / 4
S4 = C - (H - L) × 1.1 / 2
Here, H, L, and C are the previous candlestick's highest, lowest, and closing prices, respectively, while R is the resistance level, and S is the support level.
Some sources may offer other calculation options with a different multiplier.
How to Trade Camarilla Pivot Points
Camarilla Pivot Point trading strategies:
1. Trading strategy based on zones of the most probable price reversal. The price will likely break through the first closest R1–R2/S1–S2 levels. However, the further the price moves away from the central level, the higher the probability of a reversal.
The area between the R3 and R4 resistance levels is recognized as a prime spot for potential price reversals, making it a good place to enter short trades. Conversely, the zone between the S3 and S4 support levels is viewed as a favorable area for initiating long trades.

The chart is plotted on the M30 time frame with pivot levels calculated based on the daily candlesticks. In the first case, marked by the higher arrow on the chart, the price hit the resistance R3 and failed to pierce it. In the second case, the price reversed from the support level S4.
2. Trading strategy based on the breakout of the flat range. When the price breaches one of the flat boundaries, it can signal the beginning of a new trend. To avoid entering a trade on a false breakout, it is advisable to use a pending order placed just above or below the first resistance or support.
Example of setting pending orders.
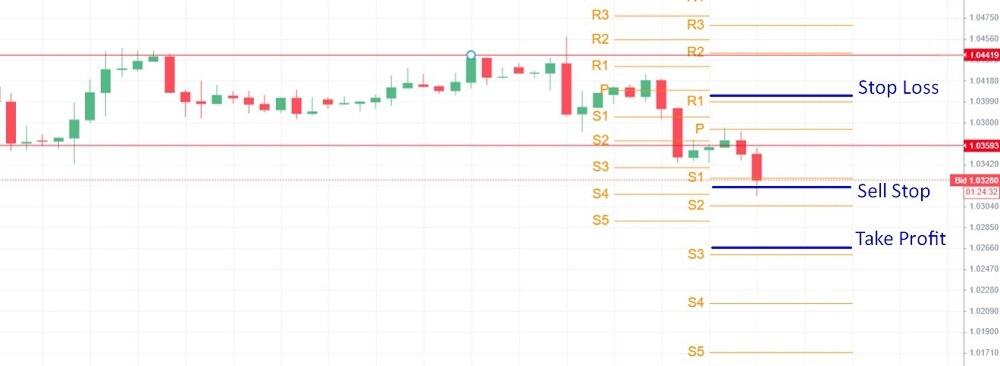
The price is trading in a sideways channel. At some point, a downward breakout occurs. Place a sell stop pending order (buying at a lower price than the current one) just below the S1 level. If the breakout of the flat boundary is false, the price cannot breach even the first support level S1. If the price pierces it, it may indicate the beginning of a downtrend. Thus, one may open a short trade with a take-profit order set below the S3 level and a stop order above the R1 level.
3. Trading in a strong trend. If the price breaks through the distant levels, the current trend is strong. Therefore, one may open a trade after a breakout according to its direction.
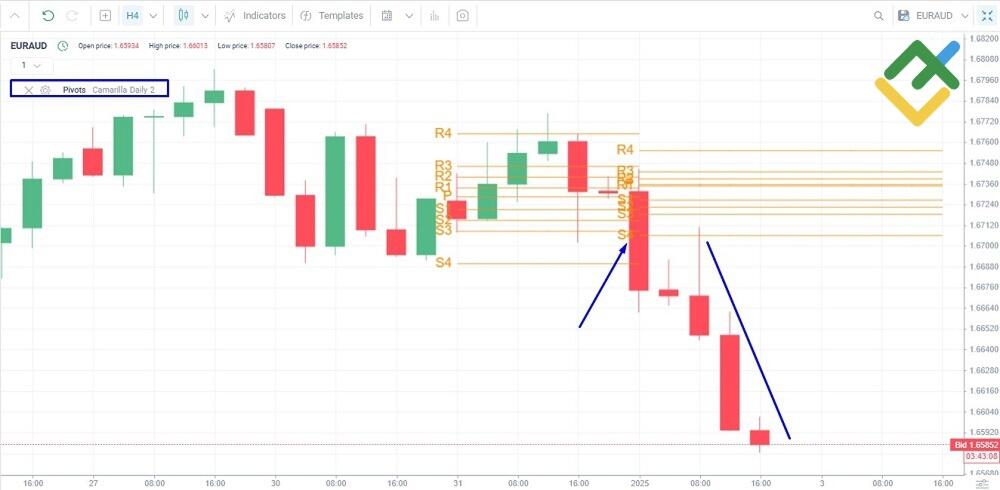
The levels are built according to the last two daily candlesticks: the last closed candlestick and the candlestick of the previous period. The first candlestick from the six candlesticks of the last period (H4 time frame) breaks through the current and previous S4 levels. Afterward, the downtrend continues.
4. Trading within a sideways channel. If the price cannot break through the resistance R1–R2 and support S1–S2 several times, it can be a sideways channel. You can trade within this channel or wait until the price breaches the channel boundaries, starting a new trend.
5. Setting stop and take-profit orders. Pivot levels can be psychologically perceived as potential points of trend reversal. Traders may decide to set a take-profit order at the level where the price reversed previously. In order to avoid pending order accumulation zones, a take-profit order should be placed just before the key level, while a stop-loss order should be set slightly beyond it.
Another option for setting stop-loss and take-profit orders:
1. Stop-loss:
- placed slightly below S4 for long trades opened at S3;
- placed slightly above R4 for short trades opened at R3.
2. Take-profit:
- set at R3 or R4 for long trades;
- set at S3 or S4 for short trades.
You can use a trailing stop instead of a stop order. When one of the pivot levels is reached, a trade can be shifted to the breakeven point and secured with a trailing stop.
You can also use pivot points to gauge the level of volatility and determine the moments of its abnormal growth. For example, when the price moves steadily between R3 and S3, the volatility is average. A breakout of R4 or S4 indicates a sharp increase in volatility. This can be an opportunity to open a short-term trade in the trend direction or consider exiting the market, as a spike in volatility comes with higher risks.
Camarilla Pivot Trading Strategies
The overall concept of strategies based on price behavior appears to be as follows:
- Price movement between R1 and S1 indicates a flat trend. It is better to refrain from trading, as you can incur losses because of the spread.
- Price movement between R3 and S3 suggests trading within the range.
- R4/S4 breakout implies trading along the trend.
- The zone between R3 and R4 or S3 and S4 is a reversal area. Trades can be opened here only in case of price reversal to the central line.
Trend Trading Strategy Using Camarilla Points
If bulls or bears are so strong that the price easily breaks through all levels, it means that there is a strong trend in the Forex market.
Example. Trading setup: currency pair is the EURNZD cross rate. Cross rates are characterized by higher volatility, so it is easier to identify trends on their charts. In the settings of the Camarilla indicator, the time frame is set to daily, and the number of reverse values is four, meaning that pivot levels are calculated based on the previous four daily candlesticks. The chart itself is displayed on the H1 time frame.
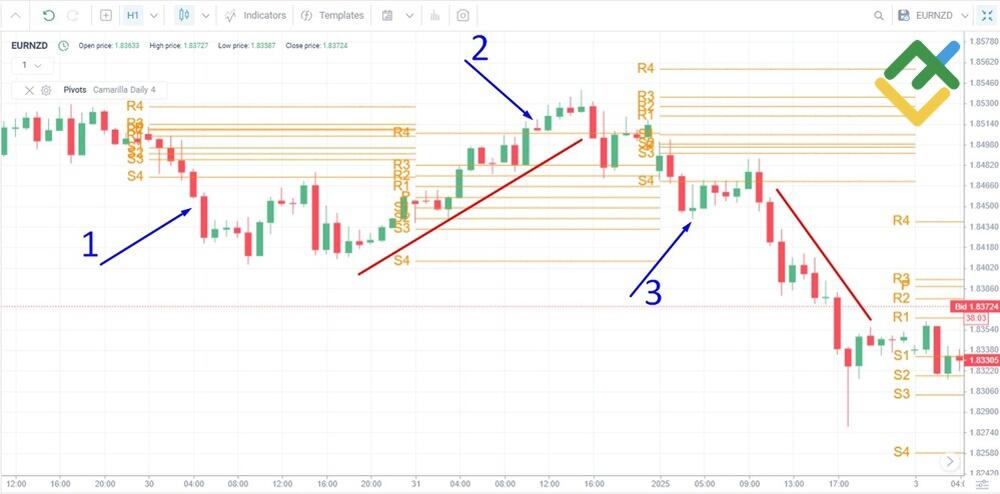
You can initiate a trade as soon as the candlestick breaks through S4, or you can wait for it to close and open a position on the next one. A trade opened on candlestick 1 would bring profit, albeit small, about 15–18 pips (when using four-digit quotes).
Afterward, it is possible to trade from S4 to R4 along the recently established uptrend. S2 and R2 can be intermediate targets, where a part of the trade can be closed. The second breakout at point 2 is weak, meaning the trade would close at the breakeven at best.
The short trade opened after the breakout of S4 at point 3 would have been very profitable since the downtrend is strong. However, the price almost triggered a stop-loss order, which is usually placed behind the opposite level (below S3).
Range Trading Strategy Using Camarilla Points
Distant pivot levels form strong resistance and support. The breakout of R1 and S1 indicates the absence of a sideways movement and highlights the strength of the trend, moving between the R3 and S3 levels.
Example. Trading setup: EURUSD currency pair. In the indicator settings, the time frame is set to daily, while the chart time frame is M30. Thus, there would be a relatively large number of candlesticks within the trading period.
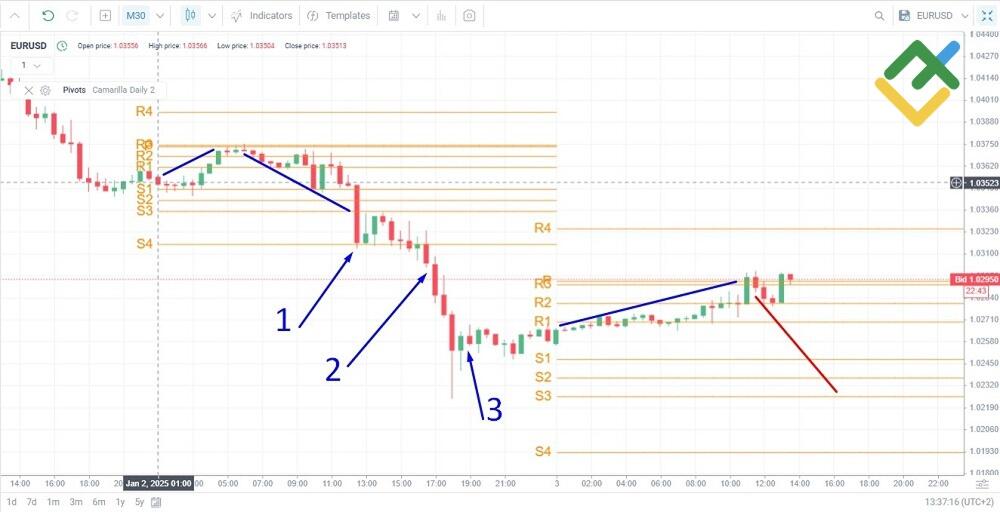
Calculations of the last two closed daily candlesticks are plotted on the chart.
In the first section, the price quickly starts to rise. After the breakout of R1, a long trade is opened with a take-profit order set at R3. In the anticipated scenario, the price should continue to climb to R4 or reverse. In this case, the reversal occurs. Thus, a short trade is initiated with a take-profit order placed at S3. Eventually, both trades yield profits.
There are two possible scenarios at S3. In case of an upward reversal, a long trade can be opened within the range. If a downward breakout takes place, the price will fall further. Since the price reverses at S4 and a downtrend seems to lose strength, a long trade is opened at point 1. However, the trade ultimately proves unprofitable, and the price starts to drop after hitting S3.
A breakout of S4 indicates a strong trend. A short trade is opened at point 2 and closed at point 3 when the first upward reversal candlestick appears.
In the second section, the strategy is similar. A long trade is initiated at R1 and closed at R3, and a short position is opened at R3 and closed at S3.
This example highlights the significance of flexibility in trading. A trader should blend multiple strategy options. If you observe that the range movement starts turning into a trend, consider initiating trades along the trend.
Intraday Trading Using Advanced Camarilla Levels
You do not have to limit yourself to the existing distant levels R4/S4 within the trading day. You can extend them further, for example, to R6/S6. The standard indicator does not include these levels, so you will need either a version with extended levels or apply them manually using a calculator specifically designed for Camarilla pivot points.
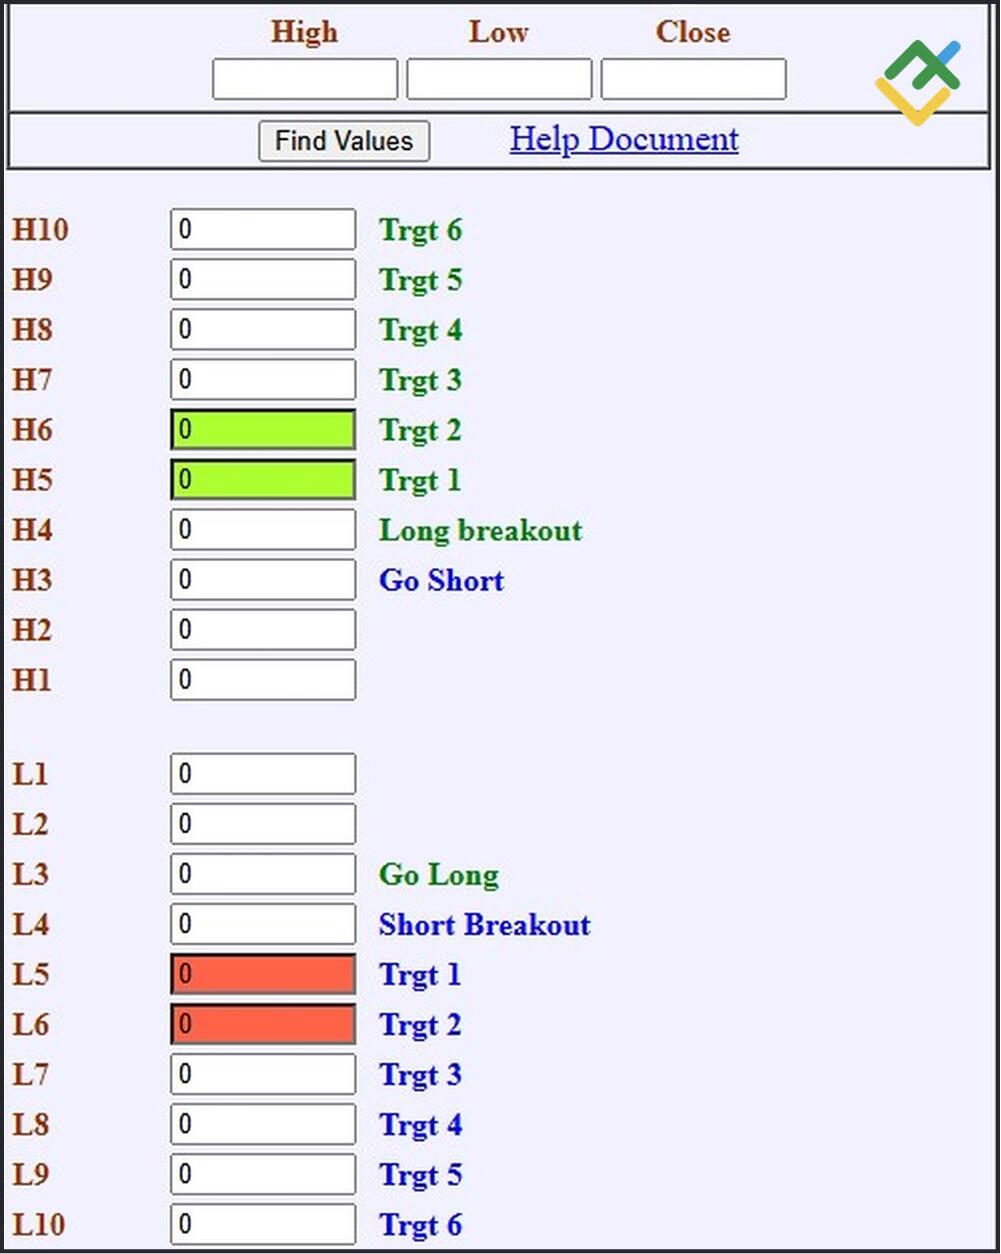
Trading strategy options:
- If the price climbs above R4, a long trade can be opened above this level with the target at R6. If the price drops below S4, a short trade can be initiated with the target at S6.
- If the price reverses in any zone above R4, a short trade can be opened. If it reverses below S4, consider long trades.
It is essential to match the volatility of each asset to the levels at which the reversal occurs most often. If the volatility is low, reversals are more likely to occur at R3–R4/S3–S4, while for more volatile assets—at R6/S6 and higher.
Combining Camarilla Pivot Points with Other Indicators
Camarilla Pivot Points are effective for identifying reversals and confirming trends when used in combination with trend indicators and oscillators:
- Moving averages: when the price crosses the MA from below, it signals an uptrend, while a crossing from above indicates a downtrend. If there is a breakout of R4/S4, it confirms the trend.
- Volume indicators: Volume growth at R3/S3 indicates a likely movement towards R4/S4.
- Oscillators (RSI, MACD, Stochastic): An overbought condition with a rebound from R3 gives a sell signal, an oversold indicator with a rebound from S3 generates a buy signal.
- Channel indicators: A breakout of R3/S3 confirms range expansion.
- Volatility indicators (ATR): High volatility increases the likelihood of a breakout of pivot levels.
Your setup of indicators and settings should be based on the asset and its volatility. It is essential to backtest your indicators on a demo account. The pivot levels are well-suited for grid strategies and automated trading with pending orders.
Pros and Cons of Camarilla Pivot Points
Camarilla Pivot Points have unique features that make them a powerful tool, but like any indicator, they have limitations, which are outlined in the table below.
Advantages | Disadvantages |
Pivot levels can be easily found with a calculator or indicator using the High, Low, and Close prices of the last candlestick. | In strong trends, R4/S4 levels are often violated, and the price does not reverse. |
It is applicable for currencies, stocks, and cryptocurrencies in intraday trading on M30–H1 time frames. | Only the data of the last candlestick is taken into account, disregarding news, trading volume, and previous trends. |
It serves as a tool for charting price movements and identifying entry/exit points, as well as stop-loss and take-profit levels. | On M5–M15, price noise can become a problem, and on H4 and higher time frames, signals are less accurate. |
It validates signals generated by other indicators (RSI, MACD), thereby improving the accuracy of trading decisions. | Multiple levels can overcrowd the chart, requiring time to interpret. |
Conclusion
The Camarilla Pivot Points indicator is an indispensable tool for intraday trading, helping traders identify key support and resistance levels, predict trend reversals, assess flat or trending markets, and set stop-loss and take-profit orders precisely.
Camarilla can be combined with oscillators (RSI, MACD) or moving averages to increase the accuracy of signals, taking into account volatility. Remember to test your strategies on a demo account to refine them for optimal performance in a specific market.
Despite its straightforward appearance, the indicator requires a comprehensive understanding of the market, as it does not take into account fundamental factors. You can master Camarilla to improve the accuracy of your entries and minimize risks, but always confirm signals with other technical analysis tools.
Camarilla Pivot Points FAQs
The accuracy of the indicator depends on the actual market conditions and asset volatility. Each method of pivot point calculation comes with its own advantages and disadvantages. Therefore, it is advisable to assess the indicator's accuracy in different scenarios by trying it out in a tester or on a demo account.
The indicators differ in the calculation formula. The Camarilla formula takes into account the closing price and the multiplier from 1.1 / 2 to 1.1 / 12. Fibonacci pivot points use the value of the central pivot level and multipliers defining the Fibonacci retracement levels instead of the closing price.
Camarilla pivot points consist of four resistance and support levels. To calculate the first resistance level, you use the formula: (H - L) × 1.1 / 12 + C. For the support level, the formula is C - (H - L) × 1.1 / 12, where C is Close (closing price), H stands for High (highest candlestick price), and L represents Low (lowest candlestick price). The calculations are based on the data from the most recently closed candlestick. Further levels are calculated similarly but with a different multiplier in the denominator. Instead of 12 for levels 2, 3, and 4, multipliers 6, 4, and 2 are used.
Signal accuracy depends on the market situation, including the current volatility level and fundamental factors. None of the pivot point tools guarantees a 100% effective signal. Therefore, it makes sense to use several calculation methods and look for signal confirmation by other indicators to make more precise trading decisions.
The Camarilla pivot point indicator helps traders identify potential support and resistance levels based on previous price data. Its main purpose is to predict intraday price movements. The further the price moves away from the central level, the greater the probability of a price reversal.
Yes, Camarilla pivot points can help confirm key price levels formed by swing highs and lows, making them useful for breakout and reversal setups. When a pivot level aligns with the support or resistance level, it strengthens the signal for a potential price movement. Additionally, these levels can also be used to set take-profit and stop-loss orders.
Yes, this indicator is used in day trading, but only as an additional tool. Camarilla pivot points do not factor in fundamental factors, market psychology, and market makers' actions. However, in calm markets, they can indicate potentially strong levels where the price can stall for some time.
The success rate varies depending on the situation and can be assessed using the strategy tester. Prepare several different trading strategies with Camarilla pivot points and test them on at least one year of price history on the H1–H4 time frame or on 300 trades in the MT4 tester. After testing, the profitability percentage will show how effective the strategy is.
Yes, this is another tool for analyzing and forecasting the market in the arsenal. However, pivot points should be employed only in conjunction with other indicators, patterns, market volumes, etc.

The content of this article reflects the author’s opinion and does not necessarily reflect the official position of LiteFinance broker. The material published on this page is provided for informational purposes only and should not be considered as the provision of investment advice for the purposes of Directive 2014/65/EU.
According to copyright law, this article is considered intellectual property, which includes a prohibition on copying and distributing it without consent.