The world of trading offers a wide range of indicators and strategies for analyzing market movements. One such concept is the Inverse Fair Value Gap (IFVG), which originated in institutional trading and has become increasingly popular among retail traders.
An IFVG forms when a Fair Value Gap (FVG) fails and reverses its role, signaling a shift in market sentiment. In this scenario, a former support area can turn into resistance, or vice versa, creating potential trading opportunities. Understanding IFVGs helps traders identify reversals, anticipate corrections, and find high-quality entry points.
This article explores how to identify IFVGs on a chart, distinguish them from false breakouts, and use them in your trading strategy.
The article covers the following subjects:
Major Takeaways
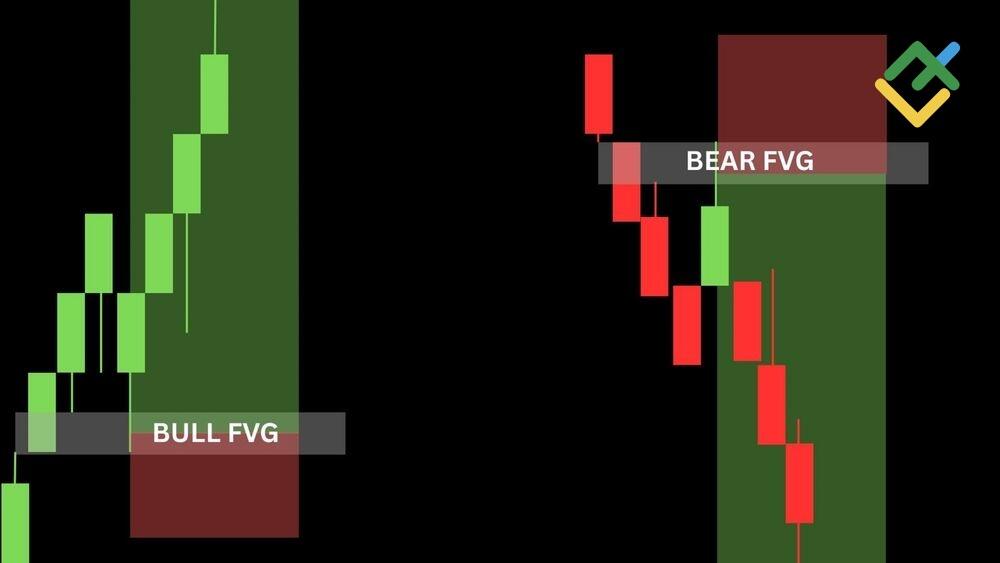
A Fair Value Gap (FVG) is a price imbalance that forms when the market moves rapidly, leaving an area where price has not fully traded. This three-candlestick zone represents an inefficiency that the market often revisits to restore balance and seek liquidity.
An Inverse Fair Value Gap (IFVG) is a reversed version of the FVG that forms during a trend reversal. It marks the area where price retraces, breaks through the imbalance, and establishes a new market structure. An IFVG signals a potential reversal and confirms the strength of the opposing move.
An IFVG forms when, after a strong price movement, the market returns to the FVG and breaks it in the opposite direction. The pattern consists of three candles: the first creates the imbalance, the second tests the zone, and the third closes beyond it. This indicates that previous momentum has been absorbed and a new trend is emerging.
A bullish IFVG forms in a downtrend when the price breaks through a bearish FVG, signaling a potential bullish reversal. A bearish IFVG appears in an uptrend when the price pierces a bullish FVG, indicating a shift in market sentiment. Both patterns can provide entry opportunities in the direction of the new trend.
To identify an IFVG, look for three candlesticks where the middle one overlaps the range of the adjacent candles. Then confirm that the price has broken through the FVG in the opposite direction. If the third candle closes beyond the imbalance zone after the retest, an IFVG has formed. No indicators are required—chart analysis and key levels are sufficient.
Trade the IFVG after confirmation: wait for the third candle to close outside the zone, then enter on a pullback to the IFVG area. Place the stop-loss beyond the opposite boundary of the zone and target the next significant level or a retest of the area. For greater precision, use time frames from 15 minutes to 1 hour.
What is FVG in Trading?
Before exploring Inverse Fair Value Gaps, it is important to understand the concept of a Fair Value Gap (FVG).
A Fair Value Gap is a price imbalance that forms when the market moves too quickly, leaving an area where price has not traded efficiently. On a chart, an FVG appears as a gap between three consecutive candlesticks, where the middle candle does not fully overlap with the surrounding candles. This imbalance reflects a temporary dominance of buyers or sellers, which is characteristic of smart money: large players leave such zones only to return to them later to grab liquidity.
FVGs usually form after strong impulses and can be either bullish or bearish depending on the direction of the move. When price returns to an FVG, traders may look for potential entry opportunities based on the market reaction in that zone. According to the ICT framework, these imbalances are linked to institutional order flow: large market participants place trades and create price imbalances, which are later resolved.
For effective trading, FVGs should be analyzed across multiple time frames to determine the overall directional bias. Single-time-frame signals are possible, but their reliability increases when multiple levels align. FVGs that coincide with key support and resistance areas carry greater significance. Imbalances are an important part of technical analysis and can help traders anticipate future price movements after the pattern has formed.
Traders who follow smart money concepts use FVGs to identify potential entry points with minimum risk. Liquidity sweeps often occur in these zones, where many retail stop loss orders are placed. Price action helps determine whether the market is likely to fill the gap. However, an FVG does not guarantee a breakout—it only creates a potential scenario.
Market structure helps confirm the importance of an FVG. If the price moves through the zone without a pullback, it may signal strong momentum. The direction of the initial move often influences future price behavior, as previous imbalances can later act as support or resistance. Effective use of FVGs requires practice and careful analysis.
What Is an Inverse Fair Value Gap (IFVG)?
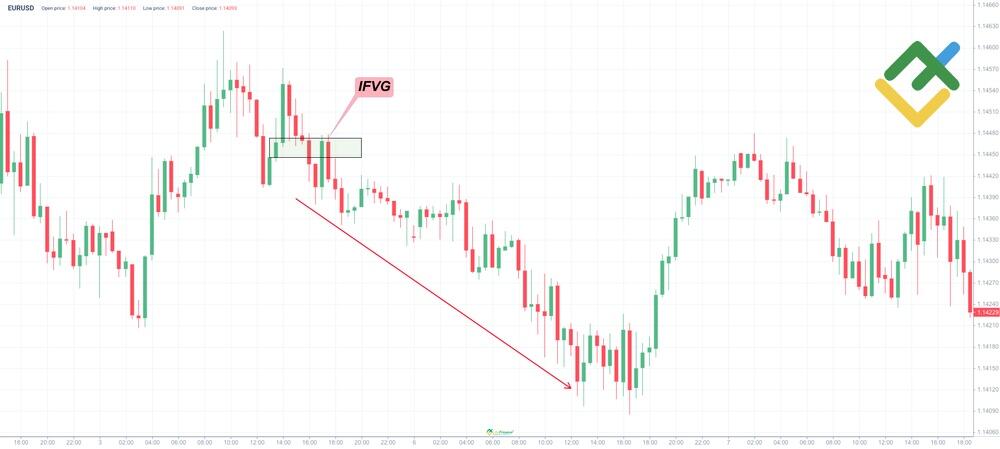
An Inverse Fair Value Gap (IFVG) is an advanced trading pattern that forms when a Fair Value Gap (FVG) is broken in the opposite direction of the initial momentum. In simple terms, an IFVG acts as a mirror image of an FVG and signals a potential shift in market sentiment.
While an FVG reflects an imbalance in the direction of the trend, an IFVG indicates the beginning of a possible new move. It forms when price breaks through the FVG zone and closes beyond its boundaries, showing a clear shift in the balance of power.
This pattern is valuable because it allows traders to enter the market at the very beginning of a reversal. At the same time, IFVG trading requires an understanding of market structure and smart money concepts. IFVGs often appear after liquidity is grabbed from the opposite side, confirming that institutional order flow may have changed direction.
After formation, the IFVG zone often becomes an area of interest where price returns for a retest before continuing the new trend.
An IFVG develops from a three-candlestick imbalance structure, where the middle candle does not fully overlap with the surrounding candles, followed by a breakout through the imbalance zone.
The IFVG trading model is a useful tool for intraday trading, as it often appears before significant price movements. Smart money uses IFVGs to identify potential entries when retail traders have not yet recognized the trend reversal. The typical structure includes a strong impulse move, a pullback, and a breakout through the FVG zone.
Price action around an IFVG is often accompanied by increased volume and volatility. Key levels, such as support, resistance, supply, and demand zones, may align with the IFVG boundaries, strengthening the signal. Strong buying or selling pressure during the breakout adds further confirmation.
Sell side and buy side liquidity often accumulates around these areas as retail traders place stop-loss orders near obvious levels. The original FVG becomes the foundation of the inverted pattern, and older, well-established imbalances may provide stronger signals.
How Does an IFVG Form?
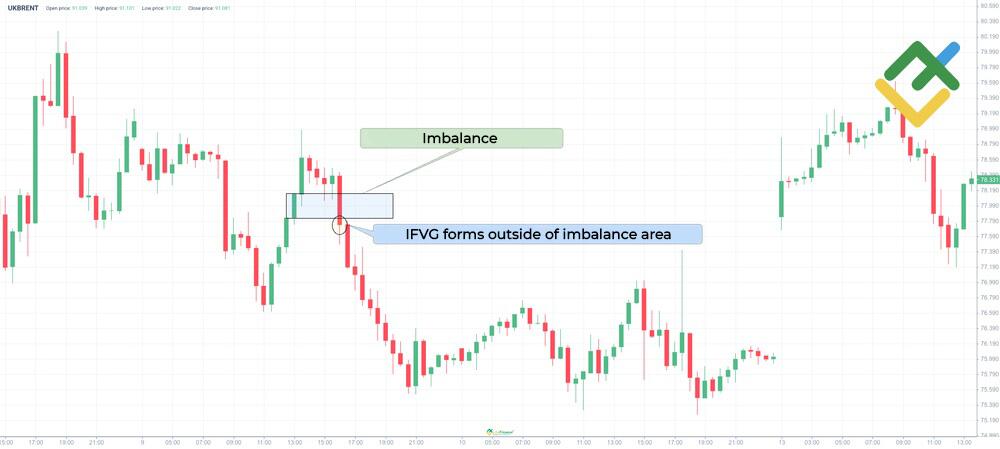
The formation of an IFVG begins with the appearance of a standard Fair Value Gap (FVG) on the chart. The pattern consists of three consecutive candlesticks, with the middle candle creating a clear imbalance because its range is not fully overlapped by the adjacent candles. This imbalance reflects a temporary mismatch between supply and demand, often driven by institutional order flow.
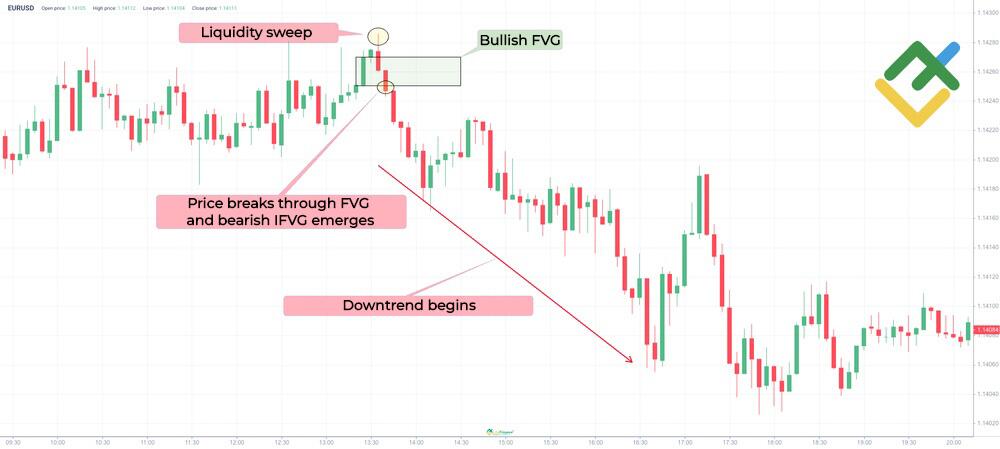
The price should then return to the FVG and break through it in the opposite direction. An IFVG is confirmed when a candlestick closes beyond the original imbalance, signaling a meaningful shift in market sentiment. Ideally, this should be accompanied by a clear change in market structure, such as a break of structure or a trend reversal.
An inversion Fair Value Gap forms when strong buying or selling pressure fully absorbs the previous imbalance. Before an IFVG develops, liquidity is often swept as price briefly moves beyond a nearby key level before reversing sharply. This shift is typically accompanied by rising volume and increased momentum, confirming the change in market sentiment.
Analysis on a single time frame can provide an initial signal, but higher time frames are often used to confirm the directional shift. The higher timeframe bias should align with the IFVG direction. The previous imbalance acts as the foundation of the pattern, while the price moving away from the IFVG zone creates a new market imbalance.
In ICT concepts, this process is viewed as part of smart money activity, where institutional traders may exploit retail positioning. A stop-loss is typically placed beyond the IFVG zone, making it a useful tool for risk management.
Bullish vs Bearish IFVG
In IFVG trading, there are two main types: bullish and bearish IFVGs. Each signals a potential shift in market sentiment and indicates the direction of the new move.
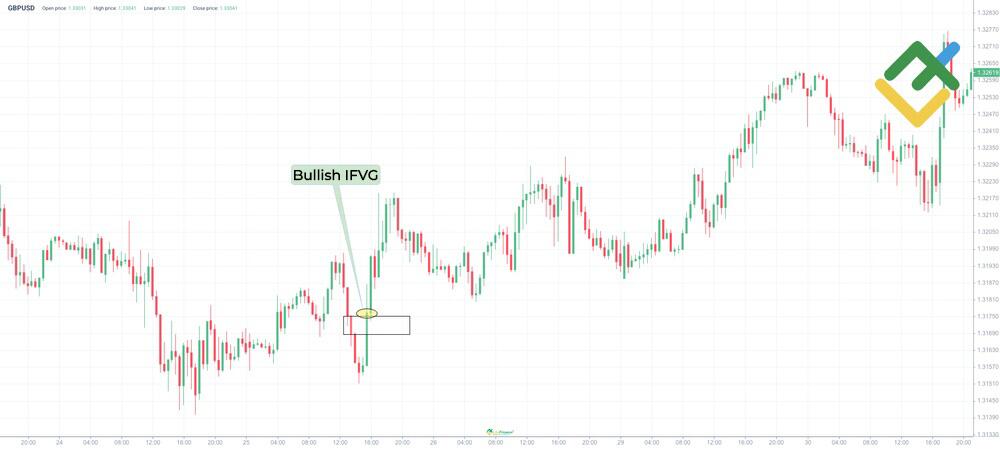
A bullish Inverse Fair Value Gap forms when a bearish FVG, created during a downtrend, is broken through from below. This suggests that selling pressure has weakened and buyers are gaining control, creating a demand zone. In market structure, a bullish IFVG often appears after a false breakout of a low, when sell-side liquidity is swept, and the price reverses sharply.
A bearish Inverse Fair Value Gap is the opposite pattern: a bullish Fair Value Gap formed during an uptrend is pierced from top to bottom, creating a supply zone. A bearish IFVG often appears after buy-side liquidity is taken above a previous high, followed by a sharp reversal in price.
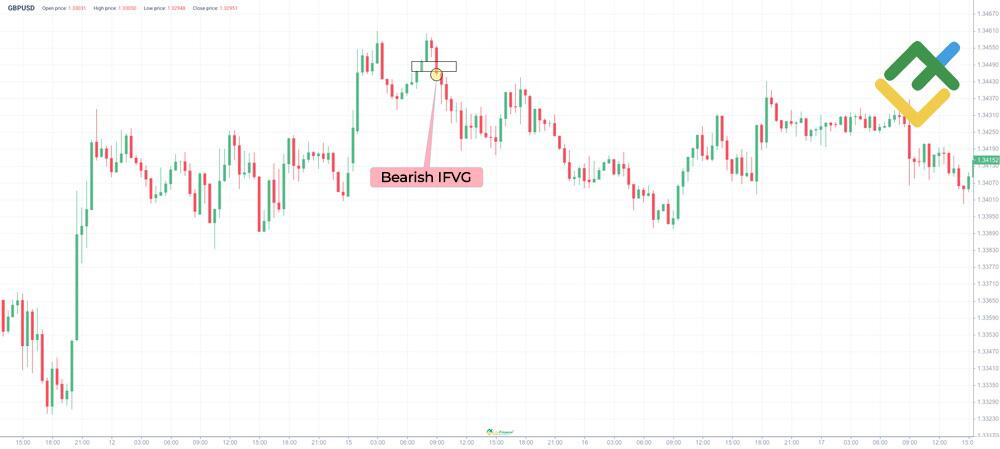
An Inverse Fair Value Gap of any type confirms a significant shift in the balance between supply and demand. In smart money concepts, bullish and bearish IFVGs can serve as entry zones because they indicate a shift in institutional order flow.
A bullish IFVG is typically accompanied by strong buying pressure after the breakout, while a bearish IFVG reflects aggressive selling. The entry signal appears when price returns to the IFVG zone and reacts after the breakout. The new imbalance created during the move provides additional confirmation.
How to Identify an IFVG
Identifying Inverse Fair Value Gaps requires a systematic approach and a clear understanding of market structure:
Locate an FVG on the chart. It appears as an imbalance between three consecutive candlesticks, where the middle candle does not overlap with the adjacent candles.
Wait for the price to return to the FVG zone. Ideally, the retest should occur with the candle closing within or near the imbalance area.
Monitor whether the price breaks through the FVG boundary in the opposite direction of the original move. If the breakout is decisive and the candle closes beyond the FVG, an Inverse Fair Value Gap is formed. Price action helps assess the strength of the signal.
Confirm the pattern using market structure. A clear shift, trend reversal, or prior liquidity sweep strengthens the IFVG setup. Use higher time frames to confirm the directional bias, which should align with the IFVG direction.
Pay attention to key levels: resistance or demand zones near the IFVG can strengthen the setup. Institutional activity is often confirmed by rising volume during the breakout. SMT divergence between correlated instruments can also provide an additional filter. For example, if one instrument breaks below a previous low while the other fails to do so and forms a bullish IFVG, the divergence can increase the reliability of the signal.
The preceding imbalance also plays an important role: the older the FVG, the more significant the IFVG may become. The accumulation of sell-side or buy-side liquidity before the IFVG confirms potential smart money involvement. An order block often defines the boundary of the IFVG zone.
Asset correlation is particularly useful when analyzing currency pairs. For example, if the EUR/USD reaches a new low while the GBP/USD fails to confirm the move and instead forms a bullish IFVG, this creates a strong divergence signal that may indicate a potential reversal.
How to Trade the IFVG
Trading using the IFVG strategy requires a clear plan and an understanding of the IFVG trading model:
The first step is to identify an Inverse Fair Value Gap on the chart using the ICT concept. After finding an IFVG, wait for confirmation: the candle must close beyond the zone, followed by a retest. The entry trigger occurs when price returns to the IFVG boundary and rebounds from it.
For a bullish IFVG, a long position is opened with a stop-loss below the lower boundary of the zone. For a bearish IFVG, a short position is opened with a stop-loss above the upper boundary. The profit target is usually the next key level, such as a previous high or low, or a support/resistance zone.
Risk management is essential: the stop-loss distance should not exceed the size of the IFVG zone. Market structure should support the trade direction, with higher time frames used to determine the overall trend.
IFVGs are most effective for intraday trading on 15-minute to 1-hour charts. Liquidity sweeps before the pattern often trigger retail stop-losses, so traders should be prepared for false breakouts. Strong buying or selling pressure at the entry point provides additional confirmation.
An order block near the IFVG can strengthen the significance of the price level. An imbalance created after the breakout confirms trend momentum, while sell-side liquidity in a bearish IFVG and buy-side liquidity in a bullish IFVG provide additional validation. Correlated trading instruments can also improve confidence: when their signals align, the probability of a successful setup increases. Avoid trading every IFVG—focus only on patterns that match the higher-timeframe directional bias.
Key levels, such as a demand zone for long trades or a supply zone for short trades, should be clearly visible on the chart. A previous imbalance can also serve as a target. The price often moves away from the IFVG by a distance comparable to the size of the gap, but market structure should ultimately guide profit-taking decisions.

Let's review an example of IFVG trading on the 30-minute chart for the GBP/USD pair:
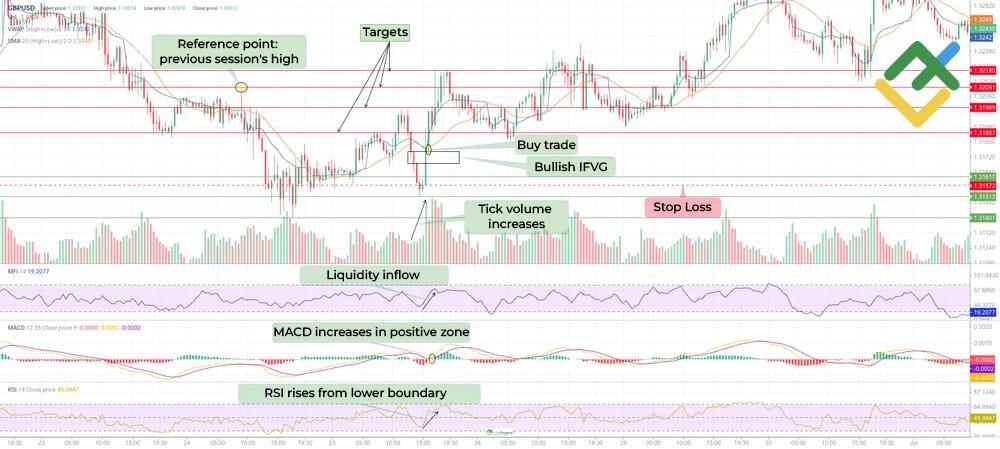
Analysis and trading algorithm:
Identify key support and resistance levels on the chart.
Locate a bearish Fair Value Gap in the area of swing lows and monitor how the price moves there.
In this case, an imbalance formed, and the price reversed. The imbalance was covered by a high-volume green candle, and the FVG zone turned into a bullish IFVG. The structure was broken.
Additional confirmation comes from technical indicators: tick volume rises sharply on the bullish candle, RSI reverses upward from the lower boundary, MACD begins to strengthen in the positive zone, and the MFI shows a strong inflow of liquidity into the asset.
A buy trade can be considered on the next candle after the IFVG zone is retested near 1.3175.
A stop-loss may be placed below the nearest support level around 1.3157.
Take-profit targets can be set at the nearest resistance levels: 1.3185, 1.3198, 1.3209, and 1.3218. The previous trading session's high can also serve as a reference point.
Conclusion
Inverse Fair Value Gaps (IFVG) represent a powerful tool for traders who understand smart money concepts and price action. The IFVG trading model helps identify shifts in market sentiment and potential entry points with minimum risk. Unlike a standard Fair Value Gap (FVG), an IFVG signals a possible change in market direction and the beginning of a new trend.
Successful IFVG trading requires patience, discipline, and a solid understanding of market structure. ICT concepts provide clear guidelines for identifying and using this pattern, while practice and analysis help improve execution. Price imbalances—whether traditional FVGs or inverse FVGs—remain important elements of modern technical analysis.
Inverse Fair Value Gap (IFVG) FAQs
FVG reflects a price imbalance in the direction of the existing trend, while IFVG forms when that imbalance is broken in the opposite direction, signaling a potential reversal. FVG shows market inefficiency, whereas IFVG confirms that the imbalance has been absorbed and control has shifted between buyers and sellers.
The IFVG trading model is a strategy that involves entering a trade in the opposite direction upon a breakout of the FVG. It involves identifying an inverse FVG, waiting for a retest of the IFVG zone, and entering on the pullback with a stop-loss placed outside the zone's boundaries.

The content of this article reflects the author’s opinion and does not necessarily reflect the official position of LiteFinance broker. The material published on this page is provided for informational purposes only and should not be considered as the provision of investment advice for the purposes of Directive 2014/65/EU.
According to copyright law, this article is considered intellectual property, which includes a prohibition on copying and distributing it without consent.