Have you ever watched price hit your stop-loss before reversing in the direction you originally predicted? If so, you may have been caught in a liquidity sweep, a common feature of institutional price action.
A liquidity sweep occurs when price briefly breaks a key level, triggering a cluster of stop-loss and pending orders, before reversing. These orders create the liquidity that large market participants may use to enter positions, often at the expense of retail traders whose stop-losses are triggered.
What does a liquidity sweep look like? How is it different from a liquidity grab, and how can the Smart Money concept improve your trading? Let's explore these questions through practical examples.
The article covers the following subjects:
Major Takeaways
- A liquidity sweep is considered a form of market manipulation in which larger participants trigger clusters of retail traders' stop-loss orders before pushing the price in the opposite direction.
- A liquidity grab is a broader concept that refers to the absorption of pending orders, including limit orders and stop-loss orders.
- Buyside liquidity accumulates above swing highs and resistance zones, while sellside liquidity forms below support levels.
- A false breakout marked by a long wick and a rapid price reversal may signal a liquidity sweep.
- The Smart Money concept involves analyzing liquidity zones and the behavior of major market participants in order to identify potential entry points.
- The best time frames for detecting liquidity sweeps and liquidity grabs are H1 and H4. Signals on the daily chart tend to be more reliable, though they appear less frequently.
What Is a Liquidity Sweep and Liquidity Grab?
Liquidity refers to the market's ability to accommodate large orders without causing sharp price movements. A market is considered more liquid when there are plenty of buy and sell orders available near the current price.
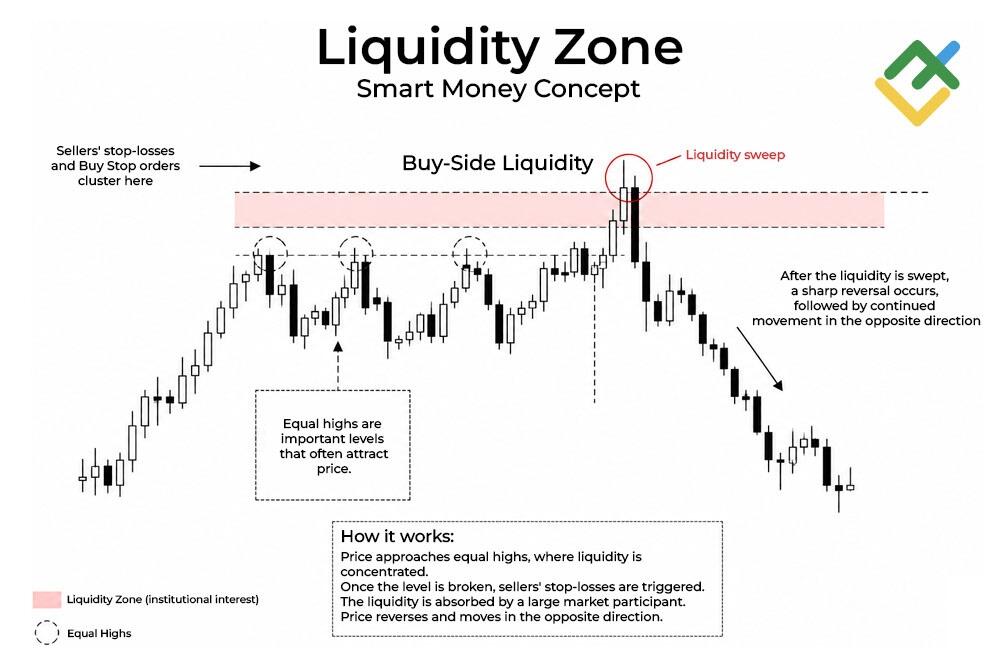
A liquidity sweep happens when price briefly crosses a level where stop-loss orders are concentrated. Retail traders often place their stops just beyond the most recent high or low, creating a liquidity pool. Larger market participants recognize this pattern and may push price beyond the level to collect those orders, build their positions, and then drive the market in the opposite direction.
A liquidity grab is a related concept, but it is broader than a liquidity sweep. A grab can involve any type of pending order and may unfold over a longer period, whereas a sweep typically targets stop-loss orders in a brief price move. A bullish liquidity grab occurs below a support zone, while a bearish grab occurs above a resistance level.
A Smart Money Concept focuses on how different market participants interact, particularly around high-liquidity areas. Large market participants cannot always enter a sizable position with a single order, as doing so may cause significant price swings. They need enough opposing orders to fill their trades, and may seek that liquidity by driving price toward clusters of stop-loss orders. Imagine a hunt: a major participant anticipates a group of stop orders above a key level and gradually pushes price toward it using smaller orders. Once those stops are taken, the participant can access the available liquidity, enter a position, and eventually exit, leaving many retail traders stopped out and often at a loss.
These moves reflect normal market mechanics, not a conspiracy. The market is an ecosystem where retail traders provide liquidity and institutional traders absorb it. The goal is to stop being the liquidity and start trading alongside those who take it. Liquidity sweeps occur every day in every market.
Retail traders often behave predictably. They place stop-losses near key levels, buy on breakouts, and sell in panic. Larger participants can exploit these patterns, creating false breakouts. Professional traders look beyond the breakout itself and focus on liquidity zones, waiting for the crowd to get trapped where larger positions are being built.
Why Liquidity Sweeps Happen
A liquidity sweep usually happens when a major player needs trading volume. Imagine a hedge fund that wants to buy $100 million worth of Bitcoin. If it places a market order, the price will skyrocket before the order is fulfilled. Slippage will wipe out all potential profits.
The solution is to wait for the price to approach a liquidity zone where retail traders' stop-loss orders are accumulated. A larger participant then pushes the price just below support or above resistance, taking out those stops and closing traders' positions. The resulting order flow provides the opposing liquidity needed to build a position with minimal slippage at a favorable price.
This is a routine part of how markets operate. Large orders require liquidity, and liquidity tends to concentrate where stop-loss and pending orders are placed. Round numbers, previous highs and lows, and range boundaries often become key liquidity zones because traders commonly place stops around them. Market makers are aware of these habits and may target such levels. The longer the price remains near a key level, the more orders accumulate around it, creating the liquidity needed to execute large positions.
Buyside vs Sellside Liquidity
Buyside liquidity is a concentration of sellers' stop-loss orders above the current market price. When the price breaks through a resistance level, short sellers are forced to close their positions, triggering buy orders that can accelerate the upward move. The more stop-loss orders resting above that level, the stronger the rally may be once those positions are closed.
Sellside liquidity is a cluster of buyers' stop-loss orders below the key support level. Price breaks below the level, triggering stop-loss orders and closing long trades. The more stop-loss orders there are, the stronger the downward momentum will be.
A buyside liquidity sweep occurs when the price moves toward a previous high, briefly breaks above it, triggers sellers' stop-loss orders, and then reverses downward. This is generally considered a bearish signal. A sellside liquidity sweep is the opposite: the price dips below a previous low, triggers buyers' stop-loss orders, and then reverses upward. Once the price moves back above the swept low, traders may consider opening long positions. The stop-loss is typically placed below the false-breakout low, with the nearest buyside liquidity zone as the target.
Let's look at an example of a liquidity sweep. Suppose Bitcoin is trading between $60,000 and $62,000, with $62,000 acting as resistance. Many retail traders place their stop-loss orders around $62,200. The price then rallies to $62,250, triggers those stops, and quickly falls back to $60,000. A large player sells the asset at the highest price, using this burst of buying liquidity. The sweep typically leaves a clear footprint on the chart: a candlestick with a long upper wick. Although the move itself may last only a few minutes, its impact can persist much longer, with the price often traveling hundreds of pips in the opposite market direction. One well-timed trade can potentially make up for several losing positions.
How to Identify a Liquidity Sweep
Here are the key signs of a liquidity sweep:
- A false breakout of a key level. Price quickly pierces the support or resistance level and turns back. The move typically leaves a long candlestick wick, signaling possible smart-money activity. When you spot this pattern, keep it in mind.
- Low volume during the breakout and high volume during the reversal. A large market participant pushes the price beyond a key level with relatively little effort, then enters with significant volume once stop-loss orders are triggered. Real-time order-flow analysis and footprint charts can help reveal this setup.
- Price behavior after a breakout. If the price does not stay above the broken level but quickly reverses, this is a liquidity sweep.
- A shift in market structure. A liquidity sweep often comes before a trend reversal. This final push for liquidity drives the price beyond a recent high or low, triggering stop-loss orders before the market reverses sharply.
Feature | Liquidity Sweep | True Breakout |
Price settles beyond the key level | No | Yes |
Candlestick wick | Long | Short |
Volume during the breakout | Low | High |
Price action after the breakout | Quick reversal | Possible consolidation before the prevailing market trend resumes |
Market structure | Trend reversal | Trend continuation |
The H1 and H4 charts are generally the most useful for trading liquidity sweeps. Lower time frames tend to produce more noise, while the daily chart offers far fewer signals. However, M15–M30 charts are valuable for identifying more precise entry points.
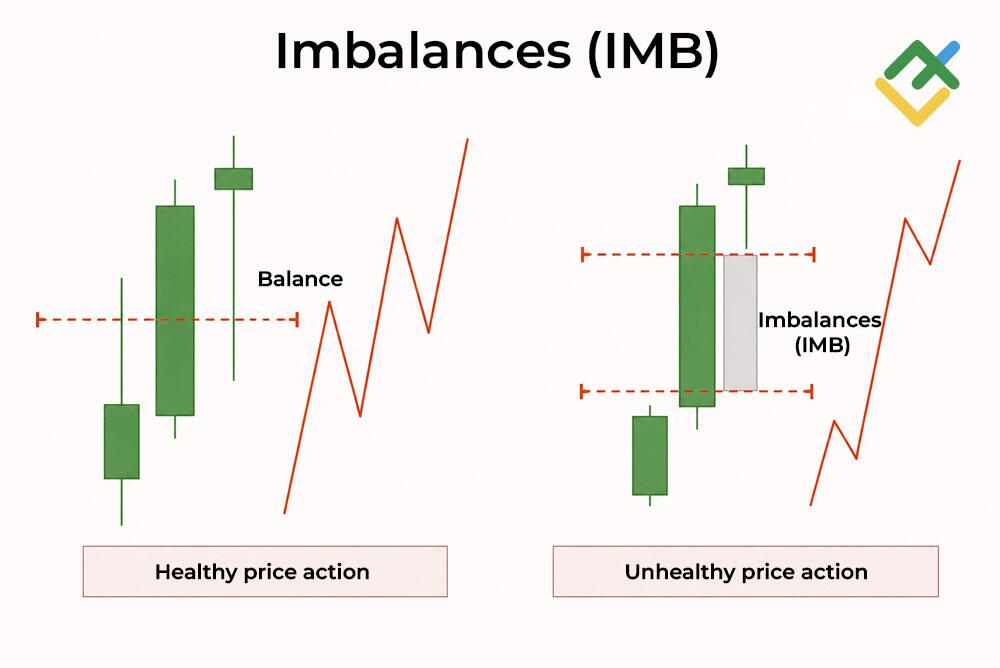
After a liquidity sweep, the price often moves rapidly in the opposite direction. This can leave behind an imbalance, also known as a Fair Value Gap (FVG). Both terms describe an area where the price moved so quickly that there was little trading between buyers and sellers, leaving part of the range almost untouched. Market makers may later push the price back into this gap to rebalance the market.
The price often returns to retest the imbalance, creating a potential entry point. This may be where large market participants open their positions, so traders following the ICT strategy can look for trades in the same direction.
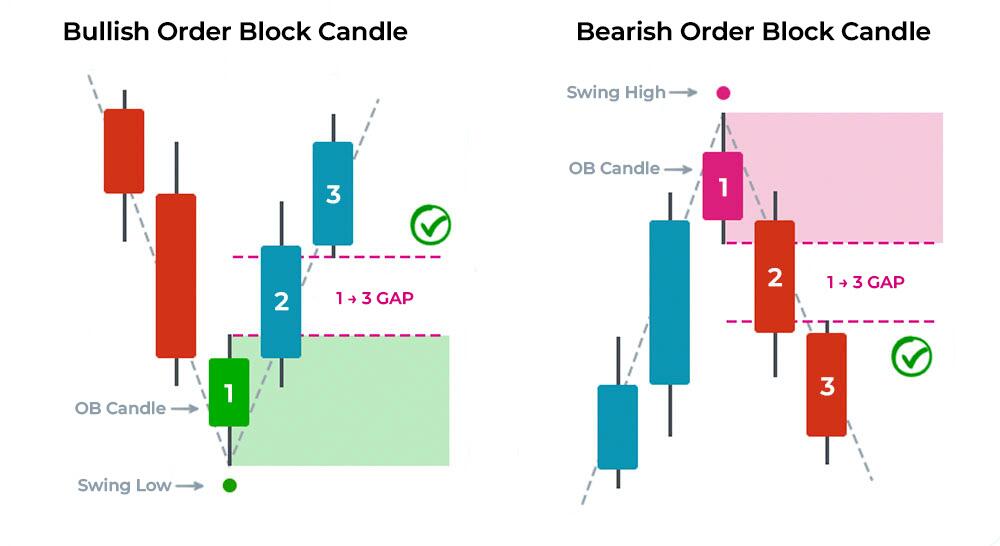
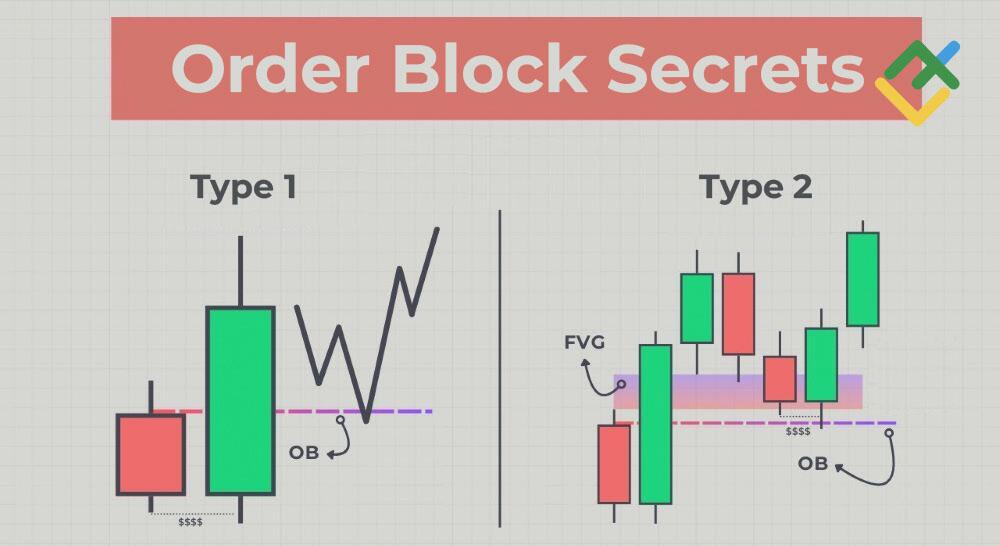
Another important element of the Smart Money Concept is the order block (OB). It is the last bullish or bearish candlestick before a trend reversal. The price often returns to this level to collect additional liquidity.
Beginners often confuse order blocks with support and resistance levels. However, an order block must meet specific criteria. First, it should be followed by a strong impulsive move that leaves an imbalance on the chart. Second, this move should ideally lead to a trend reversal and create a clear reversal pattern.
How to Trade Liquidity Sweeps
Liquidity sweeps are among the clearest and most logical trading signals in the Smart Money Concept. The key rule is not to predict a sweep, but to wait until it is complete. After a large market participant builds a position, the price often returns to their area of interest, creating a potential entry point.
The most common beginner mistake is misidentifying a liquidity sweep. Retail traders often read too much into price movements, but not every break of a key level is a false breakout. Always assess the broader market context and look for confirmation before entering a trade.
Risk Management
Risk management is essential when trading liquidity sweeps. Never fight the market or try to prove it wrong. If you take a loss, accept it and wait for clear confirmation of the market structure before entering another trade.
Rule 1: Place your stop-loss beyond the breakout extreme, leaving a small buffer. Avoid setting it directly at the key level, where a liquidity sweep could trigger it. Professional traders typically place their stop-loss beyond the order block's high or low, with an additional 5–10 pips to allow for spread and slippage. This reduces the risk of being stopped out by a minor price spike.
Rule 2: Risk no more than 1% of your account balance per trade. The lower the risk, the better. A liquidity sweep is a probability-based setup, so not every trade will be profitable. However, a risk-to-reward ratio of 1:3 or higher can make the trading strategy profitable over time. At this ratio, one winning trade can offset three losing trades.
Rule 3: Wait for confirmation. A small candle body with a long wick can be a good signal, but it is better to wait for the next candle to close. Do not enter at the first sign of a setup or try to catch every move. Missing a trade is better than taking a loss. Quality matters more than quantity.
Conclusion
A liquidity sweep is not a conspiracy but a natural market mechanism through which large market participants find the liquidity they need to manage positions. Understanding how it works can improve your trading results. Liquidity sweeps are a fundamental concept, and the same principles apply across cryptocurrencies, gold, and currency pairs.
The Smart Money Concept can offer valuable clues. It helps traders identify where stop-loss orders are likely clustered and anticipate the levels where large market participants may drive the price. This allows them to trade alongside institutional players instead of against them. A more advanced approach is to place a pending limit order in anticipation of a liquidity sweep by a large market participant or market maker.
Every day, retail traders lose money on false breakouts. Your goal is to avoid becoming one of them. However, not every breakout is false. Do not rush into a trade. Wait for the price to return to the range.
Want to practice? Open a LiteFinance demo account. Try to spot a false breakout, identify liquidity zones, and place your first trade using the Smart Money Concept.
Liquidity Sweep FAQs
A liquidity sweep triggers stop-loss orders before the price moves in the expected direction. A liquidity grab is a broader term for absorbing pending orders of any kind. Unlike a sweep, it does not necessarily lead to an immediate reversal, making it harder to identify.
H1 and H4 are generally the most effective because they offer a clear view of market structure with less noise. The daily chart provides reliable but less frequent signals. Combine higher time frames with lower ones for more accurate market entries.

The content of this article reflects the author’s opinion and does not necessarily reflect the official position of LiteFinance broker. The material published on this page is provided for informational purposes only and should not be considered as the provision of investment advice for the purposes of Directive 2014/65/EU.
According to copyright law, this article is considered intellectual property, which includes a prohibition on copying and distributing it without consent.