ZigZag is a technical indicator that links major swing highs and lows on a chart with straight lines. It highlights major reversals and corrections, filters out market noise, and helps you focus on the most significant price movements.
ZigZag is also useful for spotting support and resistance levels. This article covers the signals it produces, how to incorporate it into a trading strategy, and its main strengths and weaknesses.
The article covers the following subjects:
Major Takeaways
- The ZigZag indicator is a built-in tool on most trading platforms. It shows significant swing highs and lows while ignoring small corrections and noise. The indicator does not predict future price movements. It simply reveals the structure behind past price movements.
- ZigZag identifies major market trends and leaves out random price fluctuations. It also marks the points needed to draw key support and resistance levels and helps outline wave patterns in Elliott Wave analysis.
- Advantages: It filters out minor price movements, helps you quickly identify price trends, and allows you to assess the amplitude of price fluctuations at a glance.
- Disadvantages: ZigZag does not predict price movements. Until the price reverses enough to confirm a new high or low, the latest part of the indicator keeps shifting.
- ZigZag can be used in a few trading strategies. One is to place pending orders just outside the patterns and levels built with the indicator. Another is to trade breakouts of the previous swing high or low in the direction of the trend. ZigZag also helps confirm reversals at Fibonacci levels and, together with oscillators, adds confirmation to trend indicator signals.
What Is the Zig Zag Indicator?
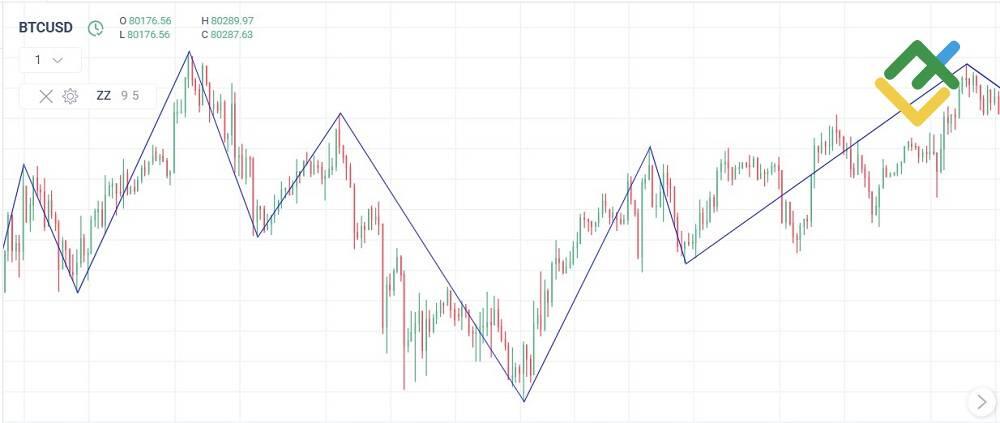
The ZigZag indicator is a technical tool that filters out minor price fluctuations and connects significant swing highs and swing lows with lines. It ignores price noise and highlights major price movements on the chart.
Advantages of the ZigZag indicator:
- Market noise filter. Filters out minor price swings and displays only significant turning points and price movements.
- Clear trend direction. Allows you to quickly identify key highs and lows across historical data.
- Flexible settings. Deviation parameters (expressed as a percentage) adapt to any time frame and asset volatility.
- Technical analysis tool. Helps you easily draw resistance/support levels and Elliott waves.
Disadvantages of the ZigZag indicator:
- Lag and repainting. The last leg of ZigZag can change or disappear as new price data comes in.
- No predictive power. ZigZag cannot predict future trends. It only reflects past price action.
- No standalone signals. The indicator is not designed to generate entry points on its own, so it is usually combined with other tools.
- Sensitivity to settings. If the Depth and Deviation values are set incorrectly, the indicator gives a distorted view of trend changes.
This indicator does not forecast where the market will go. Instead, it gives a clear picture of the main trend moves in historical data. Longer and steeper Zig Zag lines point to stronger price swings, so you can judge how volatile the market was in different parts of the chart. The swing highs and lows help identify classic chart patterns as well as support and resistance levels. ZigZag is also popular for Elliott Wave analysis, though perfectly formed waves are uncommon.
The Zig Zag Formula Explained
There is no single formula behind ZigZag. The indicator works through an algorithm that screens out market noise and picks out swing highs and lows based on three key settings.
Below is how the classic ZigZag with the Depth, Deviation, and Backstep settings is calculated:
1. Potential swing high:

Potential swing low:

2. Calculating the reversal condition. For a reversal from a high:
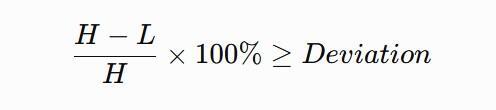
For a reversal from a low:
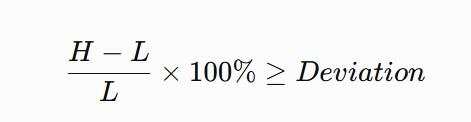
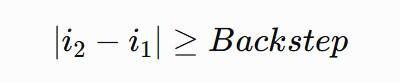
3. The Backstep parameter also sets a minimum distance between two consecutive highs or two consecutive lows:
If the price makes a higher high before the reversal is confirmed, the new high replaces the previous one, and the ZigZag line is extended. Lows work the same way. This is why the latest leg of ZigZag repaints. Until a swing in the opposite direction is confirmed, a new high or low can still shift the end point of the line.
Zig Zag Indicator Settings
Since ZigZag is part of the default toolkit on most trading platforms, its parameters are fairly uniform. There can be slight differences from one platform to another, but they are not significant.
The ZigZag indicator settings on the LiteFinance platform:
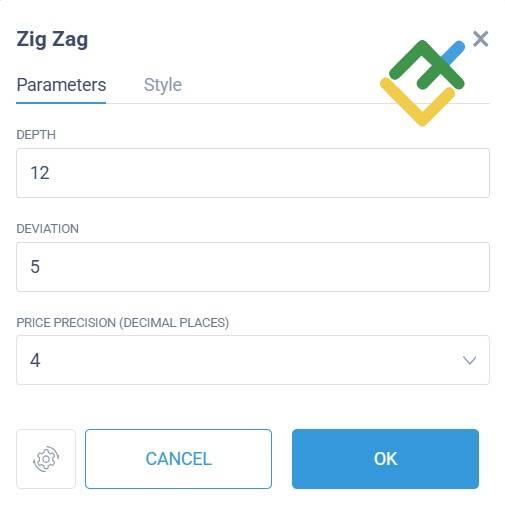
- Depth (default 12). The minimum number of candlesticks the indicator uses to identify swing highs and lows, provided the price moves by at least the Deviation percentage. The higher the value, the larger the price swings ZigZag shows, while minor local highs and lows are filtered out.
- Deviation (default 5). The minimum percentage price change needed to form a new ZigZag segment. For example, with a value of 5, a new high or low appears only when the price moves at least 5% away from the last high or low.
- Price Precision (decimal places). The number of decimal places shown on the price scale.
Here is how to set up the ZigZag indicator in MT4 with an additional parameter:
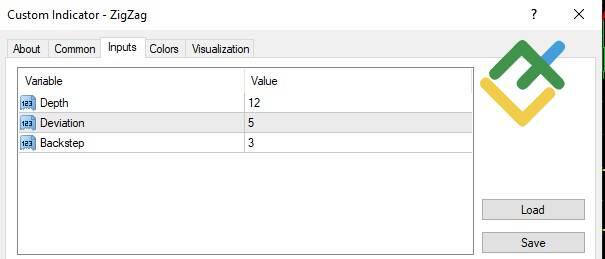
Backstep. The minimum number of candles between consecutive swing highs or lows. This parameter helps filter out extreme price points that are too close together. If a higher high or a lower low appears within this interval, the earlier point may be removed.
Here is how the classic Zig Zag indicator works:
- Step 1 (Depth). The indicator analyzes a set number of candles, for example, 12, and identifies the highest high and the lowest low in that range.
- Step 2 (Deviation). When the price breaks above the previous high, the indicator checks whether the move is large enough in percentage terms. If so, the ZigZag line extends upward. If the price then pulls back by more than the Deviation value specified in the settings, the indicator draws a reversal line.
- Step 3 (Backstep). If a higher peak forms on the current or a nearby candle (within the last 3 candles), the indicator removes the previous point and connects the line to the new high instead.
Tip: Learn the general principle behind the indicator, but do not rely on fixed settings. Formulas can vary between platforms, so it is best to fine-tune the step size and how the indicator filters out minor swings through trial and error.
How the Zig Zag Indicator Works
A key feature of the algorithm is that the Zig Zag indicator does not connect every visible swing high and low. It first identifies extreme points based on the specified conditions and may then erase some of them or replace them with stronger ones. As a result, some highs and lows may be left out. The higher the settings, the more extremes the indicator ignores.
Keep in mind that the final segment of the Zig Zag can still change. While the current move continues, the most recent high or low keeps shifting. This is what traders call ZigZag repainting.
Let's see how the Zig Zag indicator works using the BTCUSD pair on the H1 time frame as an example:
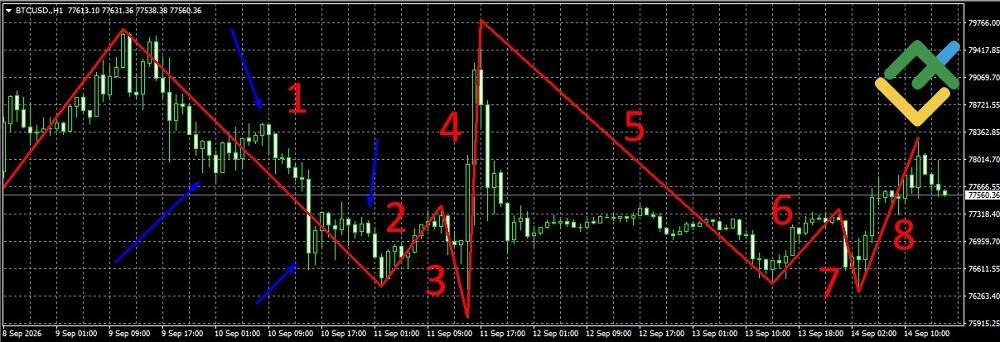
- After peaking on September 9, 2026, the price forms a sequence of lower highs and lower lows. Minor pullbacks are too short to count as reversals (Depth of 12 candles), so the ZigZag indicator draws one continuous downward line all the way to a significant low around September 11.
- Rise. After the prolonged decline, the price rebounds from the swing low by more than the Deviation threshold, and the indicator draws a new upward trend line.
- Sharp decline. A strong bearish impulse pushes the price well below the previous swing low.
- Sharp upward impulse.
- After the September 11 high, the price drifts lower. Many small fluctuations occur along the way, but they do not create major highs and lows that the ZigZag could connect. The indicator stays anchored to the latest swing low.
- Clear rebound. The price forms a minor uptrend that is strong enough for the indicator to draw a new line.
- Pullback of a similar size.
- Another rise. A strong rally begins from the low and carries the price to around $78.3K. This upward line is still preliminary. If the price climbs higher and sets a new high before a confirmed opposite extreme forms, the ZigZag will extend the line further up.
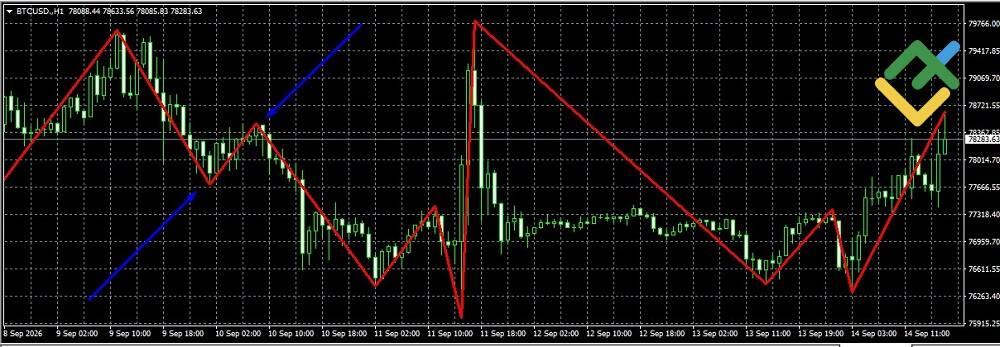
The ZigZag ignores the corrections in section 1 (marked with blue arrows) because the Depth setting is too high. Let's see what happens if Depth is reduced from 12 to 9. As the chart below shows, the lookback period becomes shorter, and the indicator now picks up the first correction. The second one is still ignored because it does not exceed the Deviation percentage threshold.
How to Read the ZigZag on a Price Chart
The ZigZag indicator does not generate buy or sell signals on its own. It does not predict future price action, but simply presents past market data in a clearer way. Its main purpose is to filter out market noise and connect the most significant swing highs and lows with straight lines. Traders can use this structure to find potential entry points.
Indirect trading signals from the ZigZag indicator:
- Uptrend. If the ZigZag indicator consistently forms higher highs (HH) and higher lows (HL), it points to a bullish market structure. If the HH-HL-HH sequence continues, the signal is confirmed.
- Downtrend. A series of lower highs (LH) and lower lows (LL) indicates a bearish market structure. A continuing LL-LH-LL sequence confirms the signal.
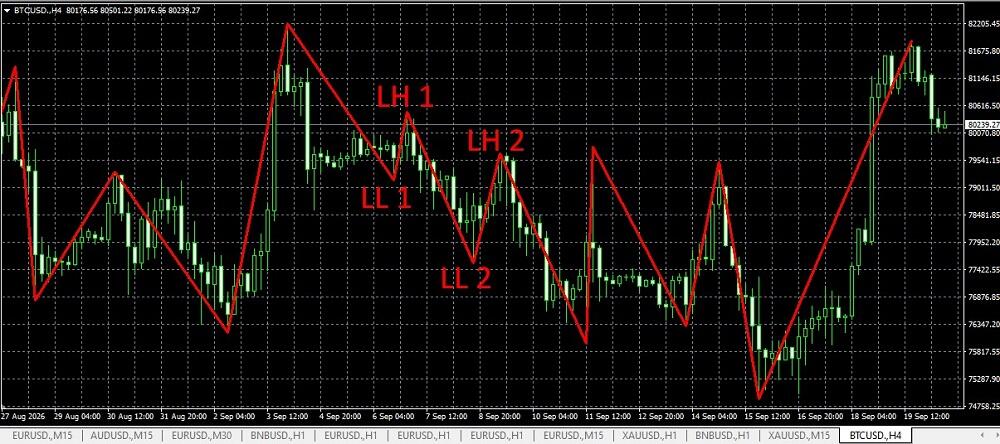
Possible trend reversal. When the established pattern of highs and lows is broken, it may signal an early reversal. For example, after an HH-HL sequence, the price forms an LH and then drops below the previous HL.
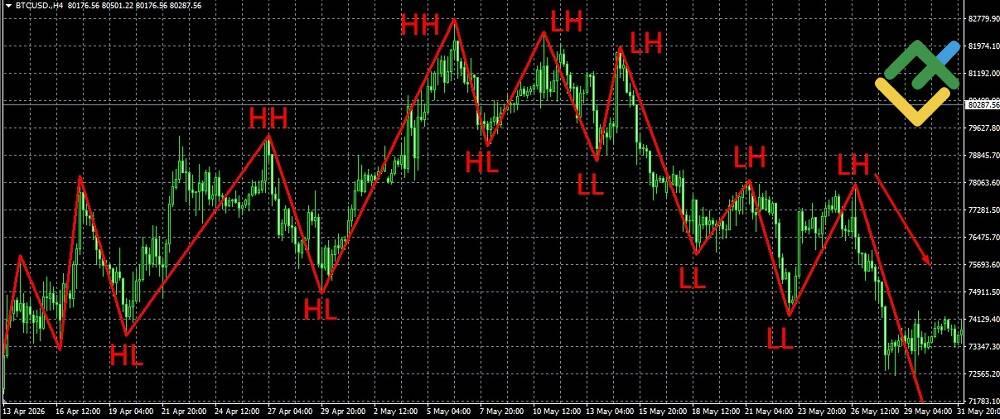
After the second HH, a lower high (LH) forms, indicating that the uptrend is weakening. Next, the price makes a lower low (LL). The break below the previous low confirms the trend reversal.
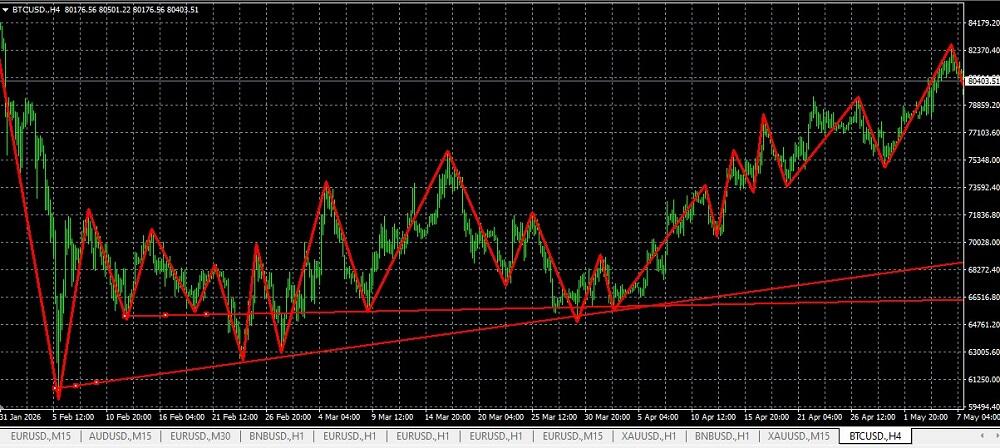
- Chart patterns. ZigZag points make it easier to identify chart patterns such as Double Tops, Double Bottoms, Head and Shoulders, Triangles, and others.
- Elliott Wave Theory. The ZigZag indicator is used to automate Elliott wave counting. It shows where one wave ends and the next one, such as a corrective wave, begins. A new corrective wave indicates that the price is moving against the previous impulse wave.
- Reversals at key levels. ZigZag highs and lows help identify strong support and resistance zones. When the price reverses more than once near a previous extreme price point, this may indicate a bounce off that level and a potential trend reversal.
Zig Zag Indicator Strategy
Each ZigZag trading strategy described below provides a basis for using the indicator together with other tools. You can develop them into full-fledged trading systems, but on their own they are only ideas. A complete trading system is designed for a specific asset, takes into account its volatility across different trading sessions and time frames, and includes risk management.
1. Breakout trading along the trend
This Zig Zag strategy is similar to swing trading. In an uptrend, the ZigZag indicator plots a series of higher highs and higher lows. A Buy Stop pending order is placed just above the most recent high. In a downtrend, a Sell Stop order is set just below the most recent low. A trailing stop protects the position and locks in part of the profit if the trend reverses.
Example:
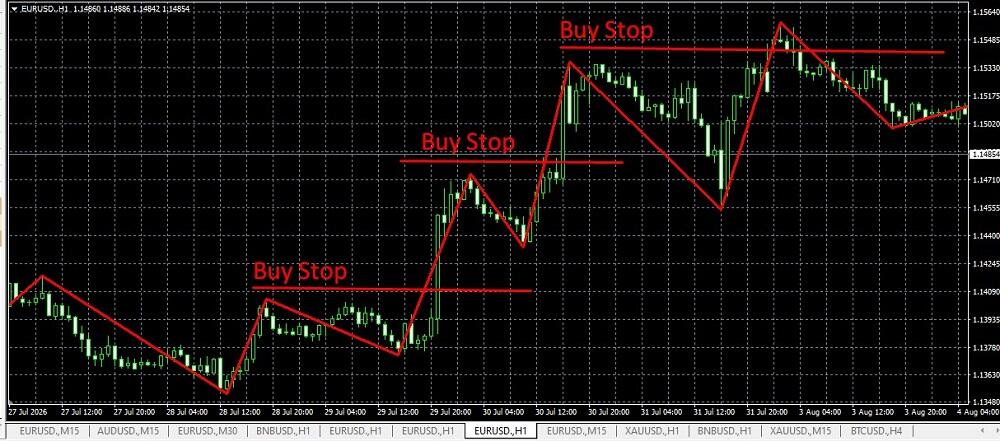
A pending order is placed just above the high. A lower high signals a weakening trend, and if the price reverses downward, the order is not triggered. If the high is broken, the trend is likely to continue. The price chart above shows that only the third Buy Stop order results in a loss. You determine the stop-loss level yourself, placing it below the most recent high.
2. Pattern trading
This strategy also uses pending orders, but breakout levels here are based on chart patterns. For example, a Triangle forms when the price range narrows, and candlestick bodies get smaller. The price then breaks out of the pattern in one direction. Buy Stop and Sell Stop pending orders are placed outside the Triangle.
For a Triangle to form, the ZigZag indicator should show two highs and two lows, with the second high lower than the first and the second low higher than the first.
Example:
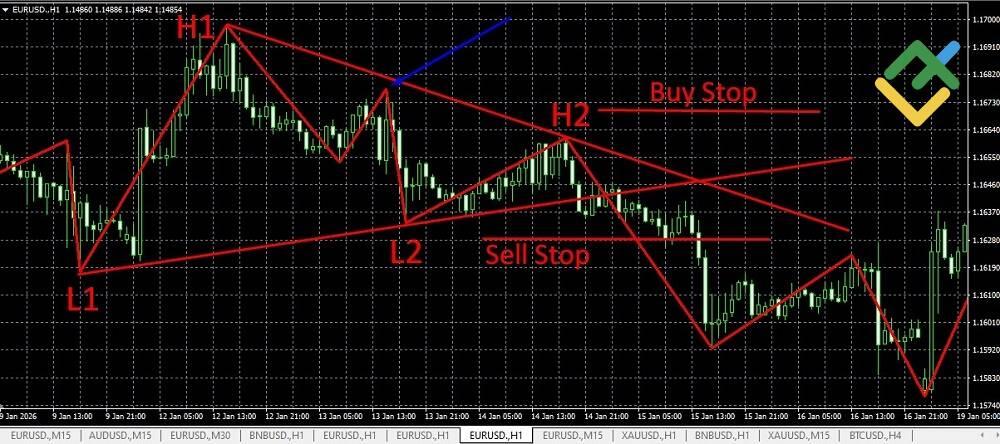
Even when zoomed out, the Triangle is almost impossible to spot here without the ZigZag indicator. The high marked with the blue arrow is not part of the pattern because it forms before the second low (L2). You decide how far from the Triangle's boundaries to place the pending orders. The orders on the chart are shown schematically.
3. ZigZag and Fibonacci levels
Trading with Fibonacci levels involves opening a trade after the price bounces off one of the levels during a correction. The Fibonacci grid is drawn over the trend move, and a correction is expected. If the price retraces more than 50%, the trend has most likely reversed. If the price bounces off the 23.6% or 38.2% level, the trend continues, and a trade can be opened in its direction. The ZigZag indicator confirms the signal.
Example:
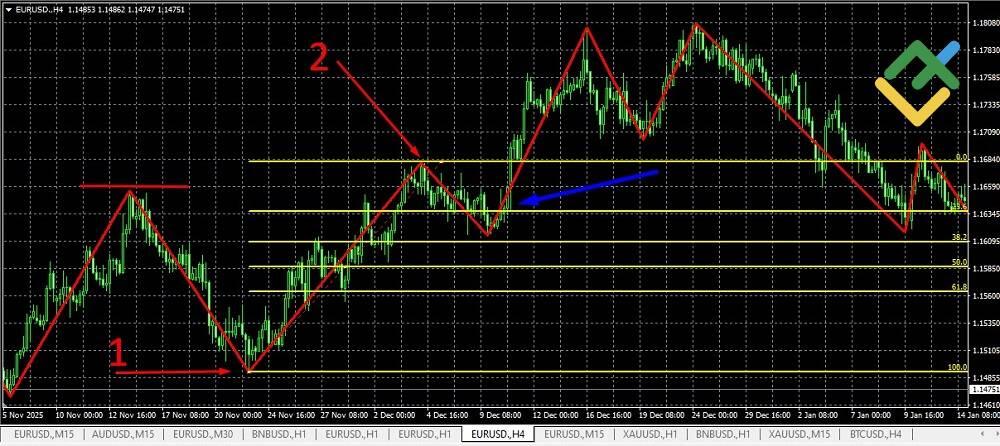
After the decline, the price starts an uptrend and breaks above the previous high (red horizontal line). When the correction begins, the Fibonacci grid is drawn between points 1 and 2. The price rebounds from the 38.2% level, and the ZigZag plots a new upward line. Although this segment may still repaint, a long position can be opened once the price breaks above the 23.6% level (blue arrow). A stop-loss can be placed at the 50% level.
One rule applies to any strategy: as long as the current candle is forming and the price continues to make new highs or lows, the last ZigZag point keeps shifting with it. The line is confirmed only when the price reverses by the distance set in the Deviation parameter. So do not open a trade just because the ZigZag line seems to have changed direction on the current candle.
Conclusion
The ZigZag indicator displays the most significant highs and lows on the chart, filtering out minor corrections. It does not predict future price trends but helps analyze past price movements. The ZigZag line clearly highlights strong trends on the price chart, and the length and slope of its segments can help you gauge an asset's volatility.
You can use ZigZag reversal points to draw key support and resistance levels and price channels. The indicator works for intraday, medium-term, and long-term strategies and is often combined with trend indicators, oscillators, and momentum indicators.
It takes practice to learn how to use the ZigZag effectively and interpret its signals correctly. Open a LiteFinance demo account and try placing a few trades using this indicator. Wishing you successful trading!
Get access to a demo account on an easy-to-use Forex platform without registration
ZigZag Indicator FAQs
It depends on several factors, including the time frame, the asset, market volatility, the trading session, current market conditions, and the ZigZag settings. Test the settings on historical data for your asset and time frame, and confirm the signals with other analysis tools.
There is no universal ZigZag setting that works in every case. It depends on the asset, time frame, volatility, and trading style. Since fundamental factors can cause sharp price movements, the settings often need to be adjusted while trading.
It is a simple three-wave corrective pattern labeled A-B-C that moves against the primary trend. A zigzag is a deep, sharp correction that usually follows a strong impulse. A more complex version is the double zigzag, which consists of two zigzags connected by a corrective wave X.
The content of this article reflects the author’s opinion and does not necessarily reflect the official position of LiteFinance broker. The material published on this page is provided for informational purposes only and should not be considered as the provision of investment advice for the purposes of Directive 2014/65/EU.
According to copyright law, this article is considered intellectual property, which includes a prohibition on copying and distributing it without consent.