The GBPUSD pair is one of the most popular major currency pairs in the Forex market, representing the exchange rate of the British pound against the US dollar. This pair is highly sought after by traders, investors, and hedge fund managers globally.
This article reviews the history and features of the trading instrument, providing technical and fundamental analysis and examining long-term forecasts from reputable analytical agencies. The analysis provides insights into the factors influencing the GBPUSD rate, optimal timing for transactions, and the potential value of adding the currency pair to your trading portfolio.
The article covers the following subjects:
- Major Takeaways
- GBPUSD Real-Time Market Status
- GBPUSD Price Forecast for 2026 Based on Technical Analysis
- Analysts' GBPUSD Price Projections for 2027
- Analysts' GBPUSD Price Projections for 2028
- Analysts' GBPUSD Price Projections for 2029
- Analysts' GBPUSD Price Projections for 2030
- Analysts' GBPUSD Price Projections until 2050
- GBPUSD Market Sentiment on Social Media
- GBPUSD Price History
- GBPUSD Price Fundamental Analysis
- More Facts About GBPUSD
- How We Make Forecasts
- Conclusion: Is GBPUSD a Good Investment?
- GBPUSD Price Prediction FAQs
Major Takeaways
- The current price of the GBPUSD pair is $1.32507 as of 25.09.2026.
- The GBPUSD pair reached its all-time high of $2.4546 on 04.11.1980. The pair's all-time low of $1.052 was recorded on 26.02.1985.
- The GBPUSD is one of the major currency pairs and is distinguished by its high liquidity and volatility.
- The GBPUSD rate is shaped by both UK and US economic indicators, interest rates of central banks, and political events.
- The currency pair demonstrates notable trading activity during the European and US trading sessions, coinciding with market hours in London and New York.
- The GBPUSD pair tends to have a negative correlation with USDCHF and a positive correlation with EURUSD.
GBPUSD Real-Time Market Status
The GBPUSD currency pair is trading at $1.32507 as of 25.09.2026.
When analyzing the GBPUSD pair, it is essential to closely monitor the interest rate decisions made by the Bank of England and the US Federal Reserve, along with key economic indicators such as UK and US inflation rates and employment data. Historical lows and highs can be used to identify key support and resistance levels. Meanwhile, technical analysis can help identify optimal entry and exit points, enhancing the effectiveness of your trading strategies.
Indicator | Value |
Bank of England interest rate | 3.75% |
US Federal Reserve interest rate | 3.75% |
UK inflation rate | 2.6% |
US inflation rate | 3.5% |
All-time low | $1.052 |
All-time high | $2.4546 |
Price change over the last 12 months | +1.25% |
GBPUSD Price Forecast for 2026 Based on Technical Analysis
To forecast the GBP/USD rate for the coming year, let's conduct a technical analysis on the weekly chart.
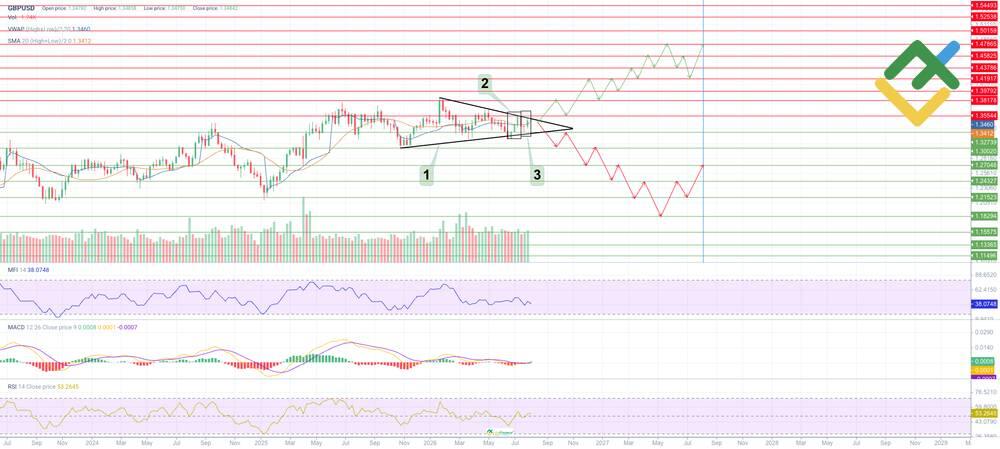
Since mid-July 2026, the trading instrument has been recovering. Technical indicators and candlestick patterns continue to point to a predominantly bullish outlook:
A large Symmetrical Triangle (1) chart pattern is forming, from which the price could break out in either direction. Additionally, within the $1.3273–$1.3554 range, Three White Soldiers (2) and Morning Star Doji (3) patterns have emerged, signaling a potential price increase in the near future.
MACD is moving sideways near the zero line. This indicates a lack of momentum, and a temporary consolidation continues.
The RSI indicator remains at 53 and may rise further.
The MFI is moving horizontally in the middle range; there are no clear buy or sell signals.
The VWAP and SMA20 are both below the market price, indicating that the bulls have the upper hand in the market.
Below are the projected values for the GBP/USD exchange rate over the next 12 months:
Month | Minimum, $ | Average, $ | Maximum, $ |
August 2026 | 1.3290 | 1.3413 | 1.3537 |
September 2026 | 1.3511 | 1.3664 | 1.3817 |
October 2026 | 1.3562 | 1.3702 | 1.3843 |
November 2026 | 1.3528 | 1.3830 | 1.4132 |
December 2026 | 1.3817 | 1.4008 | 1.4200 |
January 2027 | 1.3800 | 1.3995 | 1.4191 |
February 2027 | 1.3945 | 1.4115 | 1.4285 |
March 2027 | 1.4191 | 1.4276 | 1.4361 |
April 2027 | 1.4259 | 1.4446 | 1.4633 |
May 2027 | 1.4344 | 1.4561 | 1.4778 |
June 2027 | 1.4370 | 1.4582 | 1.4795 |
July 2027 | 1.4089 | 1.4369 | 1.4650 |
Long-Term Trading Plan for GBPUSD for 2026
The technical analysis conducted has identified key support and resistance levels that can be used in a trading strategy for the coming year.
Yearly Trading Plan
The price is highly likely to break through the upper boundary of the Symmetrical Triangle pattern in the near future.
Key support levels: $1.3273; $1.3002; $1.2704; $1.2432; $1.2152; $1.1829; $1.1557; $1.1336; $1.1149.
Key resistance levels: $1.3554; $1.3817; $1.3979; $1.4191; $1.4378; $1.4582; $1.4786; $1.5015; $1.5253; $1.5449.
Main scenario: Open long positions above the key resistance level of $1.3554 on increased volume, with potential targets in the $1.3817–$1.5449 range.
Alternative scenario: Open short positions below the key support level of $1.3273 on increased volume, with targets in the $1.3002–$1.1149 range.
Analysts' GBPUSD Price Projections for 2026
Analysts expect the GBP/USD pair to decline in the second half of 2026. The price may be influenced by the policies of the Bank of England and the Federal Reserve, inflation, economic growth rates in the UK and the US, and labor market conditions.
LongForecast
Price range: $1.3170–$1.3980.
According to LongForecast, GBP/USD quotes will likely trade mixed during the second half of the year. In August, the closing price could be $1.3500, and by October, it could rise to $1.3770. By the end of the year, the price could correct to $1.3430.
Month | Open, $ | Min–Max, $ | Close, $ |
August | 1.3480 | 1.3170–1.3820 | 1.3500 |
September | 1.3500 | 1.3320–1.3840 | 1.3550 |
October | 1.3550 | 1.3550–1.3980 | 1.3770 |
November | 1.3770 | 1.3380–1.3780 | 1.3580 |
December | 1.3580 | 1.3230–1.3630 | 1.3430 |
WalletInvestor
Price range: $1.3000–$1.3900.
WalletInvestor anticipates the GBP/USD exchange rate to gradually decline after a slight rise. The average price in August will be $1.3600, then fall to $1.3400 by October. By the end of the year, the exchange rate could drop to $1.3000.
Month | Average, $ | Minimum, $ | Maximum, $ |
August | 1.3600 | 1.3300 | 1.3700 |
September | 1.3500 | 1.3300 | 1.3900 |
October | 1.3400 | 1.3200 | 1.3600 |
November | 1.3400 | 1.3200 | 1.3600 |
December | 1.3300 | 1.3000 | 1.3600 |
CoinCodex
Price range: $1.3100–$1.3600.
According to CoinCodex, the GBPUSD pair will continue to exhibit a moderate downtrend. In August, the average price could reach $1.3400. No significant changes are expected through November, and in December, prices could fall to a low of $1.3100.
Month | Minimum, $ | Average, $ | Maximum, $ |
August | 1.3300 | 1.3400 | 1.3600 |
September | 1.3200 | 1.3400 | 1.3500 |
October | 1.3300 | 1.3400 | 1.3600 |
November | 1.3300 | 1.3400 | 1.3600 |
December | 1.3100 | 1.3300 | 1.3400 |
Analysts' GBPUSD Price Projections for 2027
Analysts expect mixed trends for the GBP/USD in 2027. The currency pair may be driven by the monetary policies of the Bank of England and the Federal Reserve, as well as inflation, economic growth rates, and the state of the UK labor market.
Note: The price ranges reflect the asset's expected volatility throughout the year. Lows and highs may not be shown in the summary tables.
LongForecast
Price range: $1.3140–$1.4100.
According to LongForecast, the GBP/USD rate will gradually strengthen in the first half of the year. In the second quarter, the price could reach a high of $1.4100. After that, the uptrend may slow down. In the fourth quarter, the rate could stand at $1.3820.
Quarter | Open, $ | Min–Max, $ | Close, $ |
Q1 | 1.3430 | 1.3140–1.4020 | 1.3340 |
Q2 | 1.3340 | 1.3340–1.4100 | 1.3890 |
Q3 | 1.3890 | 1.3340–1.4050 | 1.3840 |
Q4 | 1.3840 | 1.3220–1.4030 | 1.3820 |
WalletInvestor
Price range: $1.2900–$1.4700.
WalletInvestor expects the GBP/USD pair to continue its uptrend. In the first quarter, the average price could reach $1.3400, and in the second quarter, it could rise to $1.3900. Prices are expected to peak at $1.4700 by December.
Quarter | Average, $ | Minimum, $ | Maximum, $ |
Q1 | 1.3400 | 1.2900 | 1.3900 |
Q2 | 1.3900 | 1.3000 | 1.4300 |
Q3 | 1.3900 | 1.3200 | 1.4400 |
Q4 | 1.4100 | 1.3500 | 1.4700 |
CoinCodex
Price range: $1.2200–$1.3500.
According to CoinCodex, GBP/USD quotes will likely trade around $1.3100 in the first half of the year. In the third quarter, the average price could rise to $1.3300. A correction will follow, and the price could fall to around $1.2600.
Quarter | Minimum, $ | Average, $ | Maximum, $ |
Q1 | 1.3000 | 1.3100 | 1.3500 |
Q2 | 1.3000 | 1.3100 | 1.3400 |
Q3 | 1.3000 | 1.3300 | 1.3500 |
Q4 | 1.2200 | 1.2600 | 1.3100 |
Analysts' GBPUSD Price Projections for 2028
Analysts differ in their forecasts for GBP/USD in 2028. The price may be influenced by central bank policy, the pace of economic growth in the UK, inflation, and changes in global demand for the US dollar.
LongForecast
Price range: $1.3610–$1.5060.
LongForecast expects the GBP/USD to remain in an uptrend. In the second quarter, the closing price could reach $1.4250. The rally will then continue. By December, the exchange rate could reach a high of $1.5010.
Quarter | Open, $ | Min–Max, $ | Close, $ |
Q1 | 1.3820 | 1.3820–1.5060 | 1.4840 |
Q2 | 1.4840 | 1.4040–1.4910 | 1.4250 |
Q3 | 1.4250 | 1.3610–1.4600 | 1.4380 |
Q4 | 1.4380 | 1.4280–1.5010 | 1.4790 |
WalletInvestor
Price range: $1.2500–$1.4400.
According to WalletInvestor, the GBP/USD rate may surge in the first half of the year. In the second quarter, the average price could reach $1.3600. A gradual decline is then expected. In the fourth quarter, the average price could be around $1.3100.
Quarter | Average, $ | Minimum, $ | Maximum, $ |
Q1 | 1.3400 | 1.2900 | 1.4400 |
Q2 | 1.3600 | 1.2700 | 1.4200 |
Q3 | 1.3400 | 1.2800 | 1.4200 |
Q4 | 1.3100 | 1.2500 | 1.4000 |
CoinCodex
Price range: $1.2100–$1.3700.
According to CoinCodex, the GBP/USD is expected to see moderate growth. In the first quarter, the average price could reach $1.2500, and in the third quarter, it could rise to $1.3400. The annual high is expected by the end of the year at $1.3700.
Quarter | Minimum, $ | Average, $ | Maximum, $ |
Q1 | 1.2100 | 1.2500 | 1.2800 |
Q2 | 1.2500 | 1.2900 | 1.3100 |
Q3 | 1.2900 | 1.3400 | 1.3700 |
Q4 | 1.3200 | 1.3500 | 1.3700 |
Analysts' GBPUSD Price Projections for 2029
Analysts expect mixed trends for the GBP/USD in 2029. The currency pair could be influenced by the state of the UK economy, Bank of England decisions, inflation, and demand for the US dollar as a safe-haven asset.
LongForecast
Price range: $1.4160–$1.5310.
LongForecast projects that the GBP/USD exchange rate may strengthen in the first half of the year. In the second quarter, the price could reach a high of $1.5310. A correction is then expected. In the fourth quarter, the exchange rate could recover to $1.4690.
Quarter | Open, $ | Min–Max, $ | Close, $ |
Q1 | 1.4790 | 1.4350–1.4860 | 1.4570 |
Q2 | 1.4570 | 1.4300–1.5310 | 1.5080 |
Q3 | 1.5080 | 1.4160–1.5250 | 1.4380 |
Q4 | 1.4380 | 1.4320–1.5060 | 1.4690 |
WalletInvestor
Price range: $1.2200–$1.4900.
WalletInvestor suggests that the GBP/USD price could rise to a high of $1.4900 in the second quarter. A gradual decline is then expected. In the fourth quarter, the average price could be around $1.3400.
Quarter | Average, $ | Minimum, $ | Maximum, $ |
Q1 | 1.3800 | 1.2800 | 1.4500 |
Q2 | 1.4200 | 1.3100 | 1.4900 |
Q3 | 1.3500 | 1.2800 | 1.4600 |
Q4 | 1.3400 | 1.2200 | 1.4100 |
CoinCodex
Price range: $1.2600–$1.4500.
CoinCodex predicts that the average GBP/USD price could reach $1.4100 at the start of the year. A gradual decline is then expected. In the fourth quarter, the exchange rate could fall to a low of $1.2600.
Quarter | Minimum, $ | Average, $ | Maximum, $ |
Q1 | 1.3600 | 1.4100 | 1.4400 |
Q2 | 1.3200 | 1.3400 | 1.4500 |
Q3 | 1.2800 | 1.3200 | 1.3400 |
Q4 | 1.2600 | 1.2800 | 1.3400 |
Analysts' GBPUSD Price Projections for 2030
Analysts are divided on the outlook for GBP/USD quotes in 2030. The currency pair could be influenced by central bank policies, the state of the UK and US economies, inflation, and global capital flows.
WalletInvestor
Price range: $1.2500–$1.4700.
According to WalletInvestor, the GBP/USD price is expected to strengthen gradually. In the second quarter, the average price could reach $1.3700, and in the second half of the year, around $1.3900. The maximum price is forecast to be $1.4700.
Quarter | Average, $ | Minimum, $ | Maximum, $ |
Q1 | 1.3200 | 1.2500 | 1.4300 |
Q2 | 1.3700 | 1.2500 | 1.4500 |
Q3 | 1.3900 | 1.2800 | 1.4700 |
Q4 | 1.3900 | 1.2900 | 1.4700 |
CoinCodex
Price range: $1.2100–$1.3600.
CoinCodex predicts that the GBP/USD exchange rate will decline in the first half of the year. In the second quarter, the average price will be $1.2800, and in the third quarter, it will likely fall to $1.2500. In the fourth quarter, the exchange rate may rebound to $1.3200.
Quarter | Minimum, $ | Average, $ | Maximum, $ |
Q1 | 1.2700 | 1.3300 | 1.3400 |
Q2 | 1.2600 | 1.2800 | 1.3300 |
Q3 | 1.2100 | 1.2500 | 1.2700 |
Q4 | 1.2300 | 1.3200 | 1.3600 |
Gov Capital
Price range: $1.2024–$1.5555.
Gov Capital anticipates high volatility for the GBP/USD in 2030. Following a moderate decline in the first half of the year, the average price could rebound to $1.4032 by the fall. In the fourth quarter, the exchange rate will stabilize at $1.3507.
Quarter | Average, $ | Least possible price, $ | Best possible price, $ |
Q1 | 1.3968 | 1.2522 | 1.5540 |
Q2 | 1.3943 | 1.2477 | 1.5555 |
Q3 | 1.4032 | 1.2339 | 1.5466 |
Q4 | 1.3507 | 1.2024 | 1.5412 |
Analysts' GBPUSD Price Projections until 2050
Long-term GBP/USD forecasts should be treated with caution. The exchange rate is influenced by numerous factors, including economic growth in the UK and the US, interest rates, inflation, commodity prices, geopolitical developments, and shifts in the global financial system.
Forecasting becomes increasingly uncertain over longer time horizons, as structural changes—such as climate-related risks, technological advances, and the transition to alternative energy—can reshape economic conditions. As a result, professional analysts typically provide detailed forecasts for the next 1–5 years, while longer-term outlooks are presented as broad scenarios rather than precise price targets.
GBPUSD Market Sentiment on Social Media
Media sentiment reflects the overall market outlook for the GBP/USD pair based on news, analyst commentary, and investor discussions. Positive economic developments in the UK can support the currency pair, while negative sentiment may increase downward pressure. Monitoring market sentiment helps identify short-term price trends and serves as a valuable complement to analysis when making trading decisions.
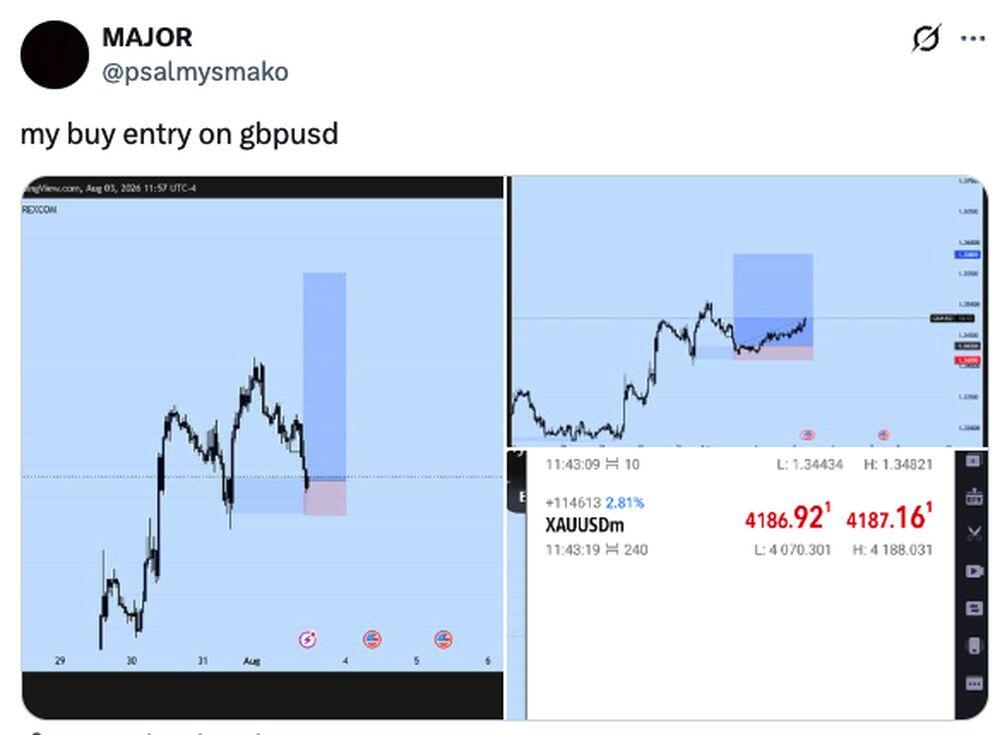
User @psalmysmako predicts that the GBP/USD pair will rise to $1.3558 in the short term.
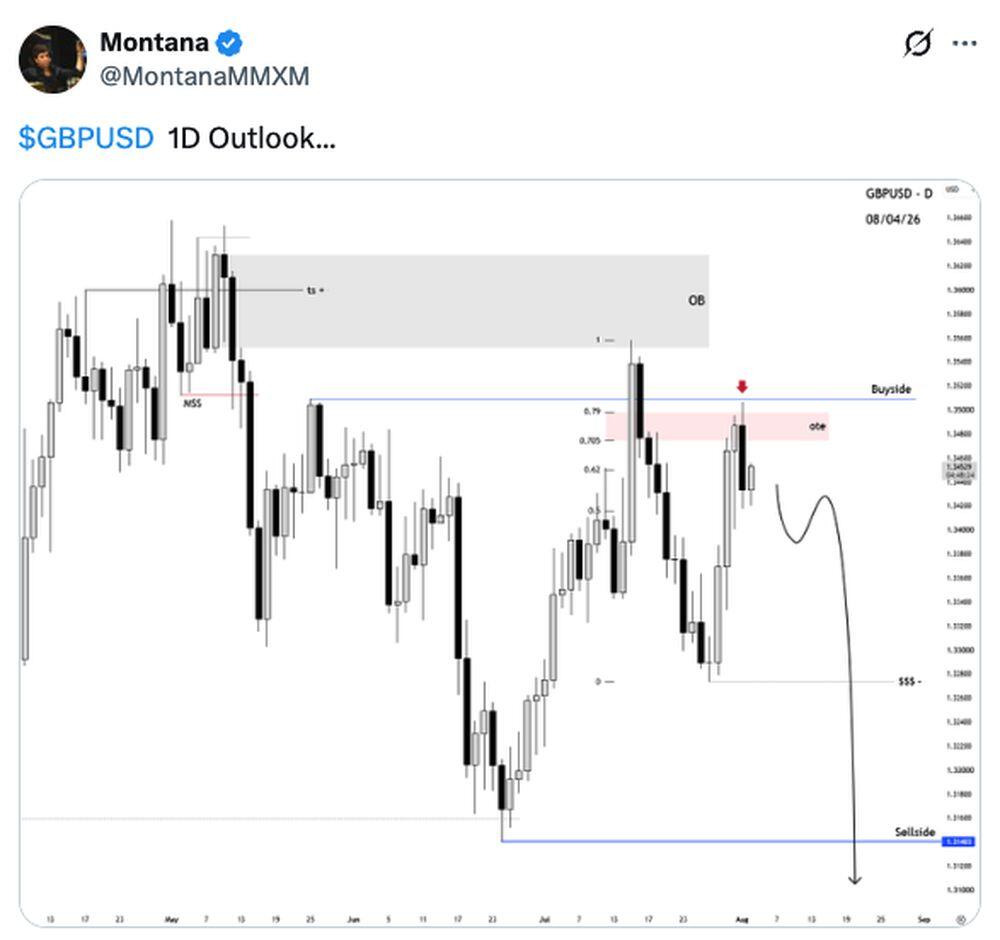
Independent trader @MontanaMMXM, on the other hand, expects the GBP/USD price to fall to $1.3140 in the medium term.
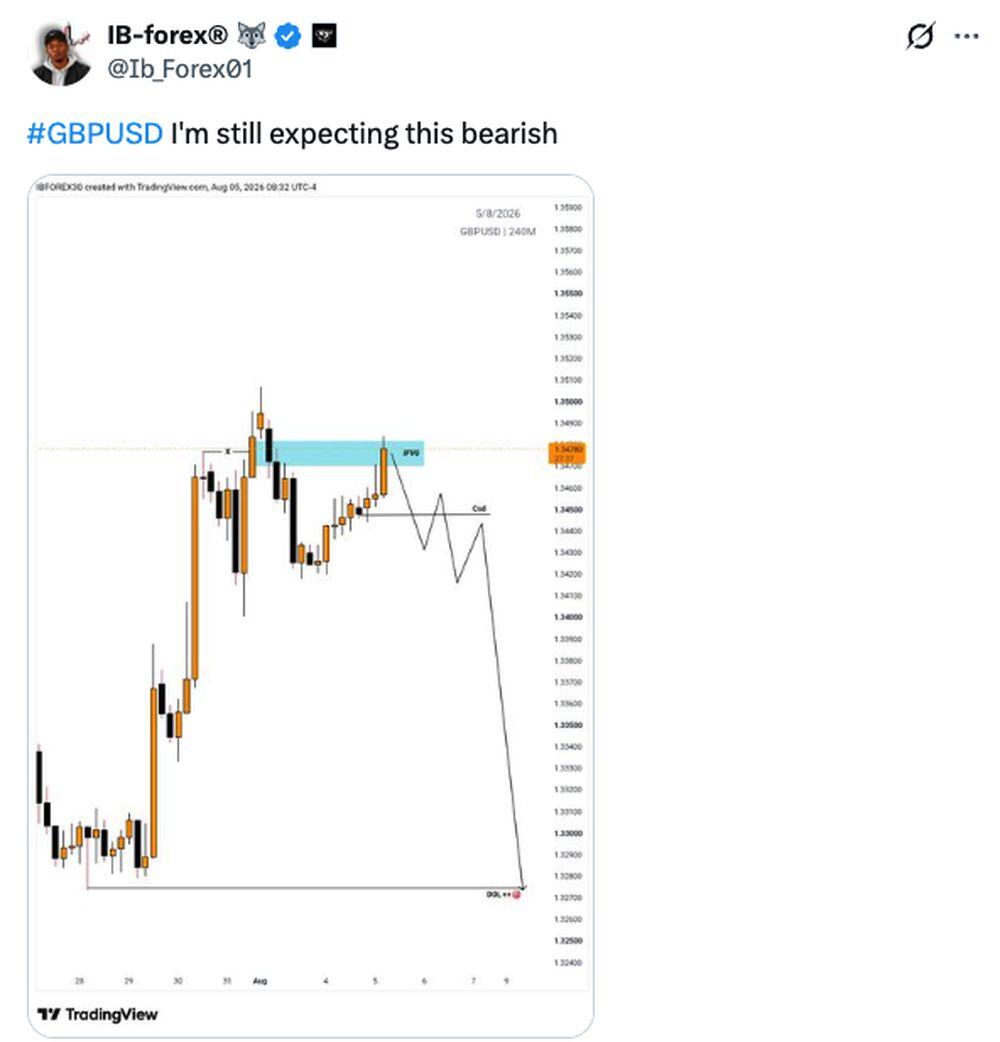
Expert @Ib_Forex01 also predicts that the GBP/USD rate will fall to $1.3270 in the near future.
Most traders and investors expect the GBP/USD pair to decline. However, before making trading or investment decisions, it is important to conduct technical and fundamental analysis and review the latest expert analysis.
GBPUSD Price History
The GBPUSD pair reached its all-time high of $2.4546 on 04.11.1980.
The lowest price of the GBPUSD pair was recorded on 26.02.1985 and reached $1.052.
Below is a chart showing the GBPUSD pair's performance over the last ten years. It is important to evaluate historical data to make predictions as accurate as possible.
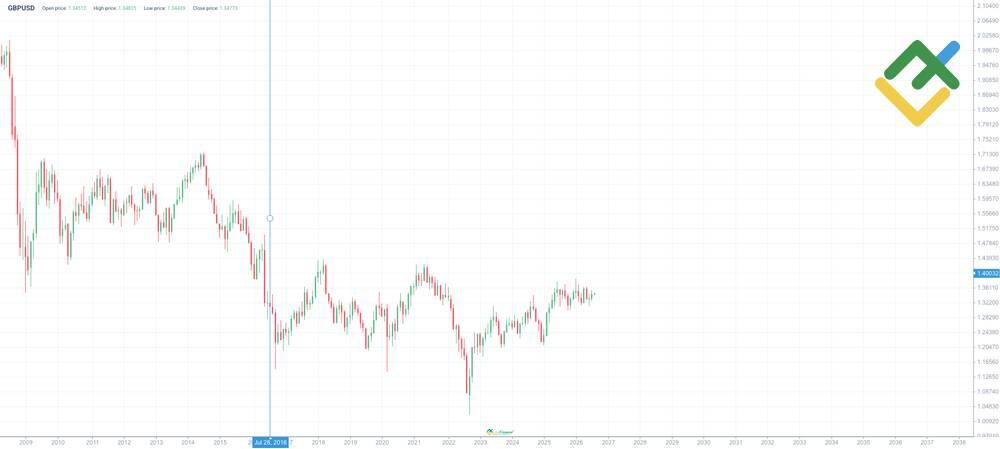
The GBPUSD pair has experienced substantial changes over the past two decades due to various economic and political events.
- Between 2007 and 2009, the pair experienced notable volatility. During the global financial crisis, the British pound dropped from 2.00 to 1.40, reflecting a decline in investor confidence in the UK economy.
- In 2016, the GBPUSD rate fluctuated due to external market factors. The referendum on the UK's withdrawal from the EU (Brexit) in June 2016 led to a sharp decline in GBPUSD quotes from 1.50 to 1.32 and then to 1.20 in October 2016.
- In 2020, the GBPUSD pair fluctuated due to the global pandemic. The pair saw significant market volatility, with the value of the pound falling to 1.15 in March but then recovering to 1.35 by the end of the year due to stimulus measures.
- In September of 2022, GBPUSD quotes slid to 1.07, reflecting a market reaction to the announcement of a major tax cut in the UK.
- In 2024, the pound strengthened and reached 1.33 in September due to the Bank of England's decision to keep interest rates unchanged amid declining inflation.
- In 2025, the British pound soared, hitting a high of 1.37 on July 1 amid a weaker US dollar and prospects of the Fed's more dovish policy.
- In 2026, between January and April, the pair was trading within a range of 1.38 to 1.31. In May and June, the price fell sharply to 1.31 amid weak UK GDP data. In early August, the pound stabilized at 1.34.
These fluctuations underscore the sensitivity of the GBPUSD rate to global economic developments, domestic policies, and market sentiment.
GBPUSD Price Fundamental Analysis
The GBPUSD pair is sensitive to shifts in the UK and US economies. Analyzing these factors helps to determine long-term trends and predict possible fluctuations in the exchange rate.
What Factors Affect the GBPUSD Pair?
The GBP/USD rate is influenced by the following fundamental factors:
- Interest rate differential between the Bank of England and the US Federal Reserve.
- Inflation and unemployment rate.
- Economic growth rate (GDP).
- Political stability and statements of officials.
- Export/import volumes and trade balance.
- The labor market and the level of consumer spending.
- Geopolitical risks and global crises.
- Investor expectations and financial market sentiment.
More Facts About GBPUSD
The pound sterling (GBP) is one of the world's oldest currencies. It appeared back in the 8th century in Anglo-Saxon England as a monetary unit equal to the weight of a pound of silver. Over time, the currency became the backbone of trade and finance of the British Empire, and today it is one of the key reserve currencies, playing a key role in international trade and investment.
The GBP/USD pair is one of the most liquid and actively traded currency pairs on Forex, reflecting the relative strength of the UK and US economies. Widely used by traders and investors for speculation, hedging, and diversification, its high liquidity and narrow spreads emphasize its importance in the global financial markets.
Advantages and Disadvantages of Investing in GBPUSD
The GBP/USD pair is quite popular on Forex due to its high liquidity. However, like any trading asset, it has its pros and cons, which are important to consider when making trading decisions.
Advantages
- High liquidity and narrow spreads on Forex.
- Wide availability for traders worldwide.
- Long history and predictability of price movements.
- Responds promptly to macroeconomic data and news.
- Suitable for both short-term and long-term trading.
- Backed by major banks and institutional investors.
- Often used in arbitrage strategies and hedging.
- Wide range of analytical and technical tools.
Disadvantages
- Increased sensitivity to political events in the UK and the US.
- May face high volatility when economic statistics are released.
- May require deep fundamental analysis for more accurate forecasts.
- Exposure to statements by the Bank of England or Fed officials.
- Price gaps and spikes during market uncertainty.
- Dependence on global risk and risk appetite.
- Requires active position control in short-term trading.
- May entail losses when trading with high leverage.
The GBPUSD currency pair is a prominent instrument in the foreign exchange market, characterized by high liquidity, accessibility, and extensive exposure to analysis. However, it is crucial for investors to acknowledge inherent risks, including elevated volatility, geopolitical shifts, and the impact of unexpected macroeconomic events. When approached with a balanced strategy, the GBPUSD pair can become a reliable component of a diversified investment portfolio.
How We Make Forecasts
The forecasts are based on a combination of technical and fundamental analysis.
For estimates with a time horizon of several days to a week, the application of technical analysis is predominant. Price patterns, support and resistance levels, MACD, the RSI, and moving average indicators are employed. In addition, price behavior on different time frames is assessed.
Medium-term forecasts for 1–3 months rely on macroeconomic indicators, interest rates, inflation, and central bank decisions.
Long-term forecasts extending over a period of 6–24 months are informed by economic cycles, geopolitical factors, and global market trends. The seasonal patterns, historical levels, and the perspectives of reputable investment funds are integral to the refinement of these forecasts. Such a comprehensive approach enables us to assess the current price movement and the future trajectory of the analyzed currency pair.
Conclusion: Is GBPUSD a Good Investment?
GBPUSD presents moderate upside potential amid consistent volatility cycles. The forecasts are mixed: some experts anticipate sideways movement, while others expect a rally toward multi-year highs. However, a bearish trend cannot be ruled out.
This asset is suitable for short-term trading and hedging. Long-term investors should follow risk management rules and regularly reassess their positions, considering how sensitive the GBPUSD pair is to decisions made by the Fed and the Bank of England.
GBPUSD Price Prediction FAQs
The current price of the GBPUSD pair is $1.32507 as of 25.09.2026.
According to the short-term forecast, the pound is expected to weaken. UK macroeconomic data is weaker than expected, while the dollar remains strong. Through the end of 2026, the GBP/USD may fluctuate between $1.3430 and $1.3300, provided the trade balance improves.
The average forecast among leading analysts places the GBP/USD in the 1.3300–1.3430 range by the end of 2026. However, downside risks remain, driven by political uncertainty in the UK and the Bank of England's relatively more dovish monetary policy compared with the Federal Reserve.
The outlook for 2027 is optimistic, with forecasts placing GBP/USD quotes in the 1.3820–1.4100 range. Improving UK economic activity, easing inflation, and expectations of a weaker US dollar are expected to support further gains in the currency pair.
The GBP/USD pair is expected to fluctuate between $1.2024 and $1.5555. The pound may appreciate due to steady growth in UK GDP, an increase in service exports, and a reduction in the current account deficit.
The optimal entry point may come after a technical rebound from the strong $1.3000–$1.2700 support zone. A sharp decline in Treasury yields could also provide a bullish signal. Long positions are best considered once the upward trend has been confirmed.
Over the past month, the pound has declined 0.5% against the dollar, while trading in a sideways range. Its undervaluation based on purchasing power parity suggests potential for a 3–5% gain over six months. However, sustained GBP strength remains uncertain as downward pressure persists.
There is no perfect exchange rate. The pair reached a high of $2.4546 on 04.11.1980, while the all-time low was recorded on 26.02.1985 when the price declined to $1.052. The most favorable entry point depends on the individual's investment horizon and the economic situation.
Price chart of GBPUSD in real time mode
The content of this article reflects the author’s opinion and does not necessarily reflect the official position of LiteFinance broker. The material published on this page is provided for informational purposes only and should not be considered as the provision of investment advice for the purposes of Directive 2014/65/EU.
According to copyright law, this article is considered intellectual property, which includes a prohibition on copying and distributing it without consent.