Investors have long been attracted to Netflix stock because of its high volatility and liquidity. The company is listed on the major US stock exchange, Nasdaq, and is included in the calculation of the Nasdaq-100 index. In recent periods, the stock has demonstrated significant appreciation, often reaching gains of 100% or more, followed by rapid corrections.
This review presents an in-depth analysis of Netflix from 2026 to 2050, examining likely market development scenarios, technological progress, and the company's financial health. The goal of this analysis is to create informed predictions about Netflix's future path.
The article covers the following subjects:
- Major Takeaways
- NFLX Real-Time Market Status
- NFLX Stock Price Forecast for 2026 Based on Technical Analysis
- Analysts' NFLX Price Projections for 2027
- Analysts' NFLX Price Projections for 2028
- Analysts' NFLX Price Projections for 2029
- Analysts' NFLX Price Projections for 2030
- Analysts' NFLX Price Projections until 2050
- Market Sentiment for NFLX (Netflix) on Social Media
- NFLX Price History
- NFLX Shares Fundamental Analysis
- More Facts About Netflix (NFLX)
- How We Make Forecasts
- Conclusion: Is NFLX a Good Investment?
- NFLX Stock Price Prediction FAQs
Major Takeaways
- The current price of NFLX is $N/A as of 24.10.2026.
- The NFLX price reached its all-time high of $N/A on N/A. The stock's all-time low of $N/A was recorded on N/A.
- According to the consensus forecast, Netflix shares will trade between $67.10 and $100.44 through the end of 2026. Some experts anticipate an uptrend in the autumn, while others expect a decline by December.
- Most experts predict that NFLX will rise in 2027. The stock price is projected to range between $67.22 and $138.68. Significant corrections throughout the year are possible.
- Forecasts for the period from 2028 to 2030 vary significantly. The price may reach $202.17 in 2028. However, in 2030, the asset may decline to $61.13.
- Long-term forecasts up to 2050 are mostly positive, but vary widely in terms of growth rates. The price is expected to range from $220.11 to $1,043.24 in 2035 and may reach $1,618.49 in 2050.
NFLX Real-Time Market Status
The NFLX stock is trading at $N/A as of 24.10.2026.
It is crucial for investors to monitor the following key metrics of the Netflix stock to ensure profitable investing:
- Price change. Monitoring price changes over different periods (e.g., last year, month, or week) allows you to assess the primary trends and volatility.
- Trading volume. It indicates the level of demand for the stock. When the price increases on high volume, it usually signals a trend continuation, while low trading volume can signal waning demand, a trend reversal, or an impending correction.
- Market capitalization. This indicator allows you to compare companies based on their size. Large companies tend to be more resilient, but smaller firms have more growth potential.
- Price-to-Earnings ratio. This indicator reflects how valued the company is compared to its earnings. A high value may indicate that the company is overvalued or has great growth prospects. A low value may signal that the company is undervalued, but also that it is facing financial headwinds.
- Shares outstanding. It indicates the number of shares in circulation. When analyzing, it is important to take into account supply (e.g., when shares were repurchased or new shares were issued).
- Analyst expectations and consensus forecasts. Expert opinions and forecasts can affect the stock price and the overall attractiveness of a company among investors.
- Free cash flow. This indicator helps to determine how much cash a company has left over after all expenses are covered.
- Market sentiment and news background. It is important to consider not only technical and fundamental indicators, but also market sentiment, which can be gauged through news, social media, analyst reports, and industry trends.
Indicator | Value |
Price change over the last 12 months | -31.7% |
Trading volume | 29.4 million shares |
Market capitalization | $342.4 billion |
Earnings per share (EPS) | $3.26 |
Book value per share | $7.24 |
Revenue | $48.371 billion |
NFLX Stock Price Forecast for 2026 Based on Technical Analysis
After a strong rally, the NFLX price has entered a correction phase. The price has rebounded above the SMA50, but remains below the SMA200, indicating continued bearish pressure in the medium term. The SMA50 is beginning to turn upward, indicating weakening downward momentum.
The MACD lines have crossed upward, and the histogram has moved into the green zone, indicating that buyers are gaining strength. The RSI is around 62, with no signs of overbought conditions. The nearest resistance zone is located at $88–$92, with the next resistance zone slightly higher at $98–$103. Key support zones are at $73–$74 and $68–$69.
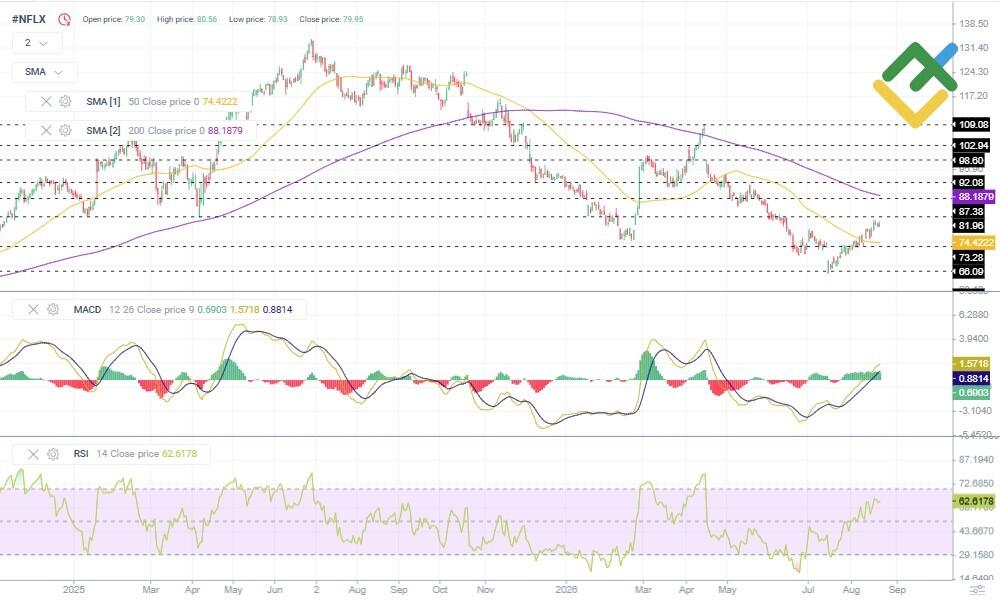
Below are the projected values for Netflix (#NFLX) shares for the next 12 months.
Month | Minimum, $ | Average, $ | Maximum, $ |
September 2026 | 74 | 82 | 90 |
October 2026 | 76 | 85 | 94 |
November 2026 | 78 | 88 | 98 |
December 2026 | 80 | 91 | 102 |
January 2027 | 82 | 94 | 105 |
February 2027 | 84 | 97 | 108 |
March 2027 | 86 | 100 | 112 |
April 2027 | 88 | 103 | 115 |
May 2027 | 90 | 106 | 118 |
June 2027 | 92 | 109 | 121 |
July 2027 | 94 | 112 | 124 |
August 2027 | 96 | 115 | 127 |
Long-Term Trading Plan for #NFLX for 2026
Base strategy: Open long trades at support of $73–$74 when technical indicators confirm upward momentum. The first profit target is the $88–$92 range. If the price settles above this level, the rally may continue toward the key resistance zone of $98–$103.
Should the price fall below the support level, it may drop to $68–$69. Consider long trades near this zone, provided there are confirming reversal signals. The main strategy is to use pullbacks to gradually build up long positions and take profits gradually as the price rises toward key levels.
Analysts' NFLX Price Projections for 2026
Experts' forecasts for 2026 vary significantly. The company's financial results, growth in its advertising business, its audience monetization strategy, and changes in investor expectations may all affect the stock price.
CoinCodex
Price range: $80.26–$87.04.
According to CoinCodex, Netflix's price is predicted to grow moderately. The average price is projected to be around $82.00 in September and October, and may advance to $86.11 in November. By year-end, a slight decline to $85.26 is expected.
Month | Minimum, $ | Average, $ | Maximum, $ |
September | 80.26 | 81.94 | 83.57 |
October | 80.38 | 82.01 | 84.28 |
November | 83.56 | 86.11 | 87.04 |
December | 83.58 | 85.26 | 86.36 |
WalletInvestor
Price range: $72.79–$90.14.
WalletInvestor predicts that Netflix's stock price may drop after rising in early autumn. The average price is estimated to reach $82.67 in September and may advance to $85.53 in October. Afterward, the NFLX price is expected to retreat, potentially falling to a low of $72.79 by December.
Month | Minimum, $ | Average, $ | Maximum, $ |
September | 78.08 | 82.67 | 87.45 |
October | 79.81 | 85.53 | 90.14 |
November | 74.32 | 81.53 | 86.01 |
December | 72.79 | 76.52 | 81.54 |
LongForecast
Price range: $67.10–$100.44.
LongForecast expects prices to rise in early autumn and then decline. The average price is predicted to reach $87.86 in September and $89.00 in October. After that, the asset is projected to decrease to a low of $67.10 by December.
Month | Minimum, $ | Average, $ | Maximum, $ |
September | 75.27 | 87.86 | 100.44 |
October | 81.88 | 89 | 96.12 |
November | 69.60 | 79.30 | 89 |
December | 67.10 | 72.93 | 78.76 |
Analysts' NFLX Price Projections for 2027
Most analysts expect Netflix's stock price to rise in 2027. However, forecasts vary significantly in terms of both growth rates and volatility.
Note: The price ranges below reflect the expected volatility of the asset over a year. The minimum and maximum prices may not be displayed in the tables.
CoinCodex
Price range: $81.21–$102.89.
CoinCodex believes that Netflix's stock price will mostly go up. The average price is expected to reach $83.78 in Q1 and climb to $91.42 by Q2. After a slight correction in Q3, the price may resume its growth, hitting a high of $102.89 in Q4.
Quarter | Minimum, $ | Average, $ | Maximum, $ |
Q1 | 81.21 | 83.78 | 87.06 |
Q2 | 86.45 | 91.42 | 95.43 |
Q3 | 85.73 | 89.96 | 93.43 |
Q4 | 93.10 | 96.85 | 102.89 |
WalletInvestor
Price range: $75.14–$124.52.
WalletInvestor forecasts an increase in the stock price in the first half of 2027. The average value is predicted to reach $89.80 in Q1 and climb to $111.84 in Q2. In Q3, the NFLX stock price may peak at $124.52. By December, the average value may decline to $94.79.
Quarter | Minimum, $ | Average, $ | Maximum, $ |
Q1 | 75.14 | 89.80 | 111.09 |
Q2 | 105.44 | 111.84 | 121.67 |
Q3 | 85.52 | 102.78 | 124.52 |
Q4 | 83.24 | 94.79 | 103.17 |
LongForecast
Price range: $67.22–$138.68.
According to LongForecast, Netflix's stock price may rise in 2027. The average price is projected to reach $81.13 in Q1 and increase to $89.94 by Q2. In Q3, the asset is expected to appreciate to $94.87. By year-end, the price may hit a high of $138.68.
Quarter | Minimum, $ | Average, $ | Maximum, $ |
Q1 | 67.22 | 81.13 | 93.23 |
Q2 | 82.21 | 89.94 | 97.99 |
Q3 | 84.12 | 94.87 | 105.67 |
Q4 | 96.45 | 114.97 | 138.68 |
Analysts' NFLX Price Projections for 2028
Analysts generally expect Netflix shares to trend upward in 2028. However, experts differ in their estimates of the growth rate.
CoinCodex
Price range: $101.33–$134.45.
According to CoinCodex, Netflix's stock price may continue to rise. The average price is expected to reach $105.06 in Q1, climb to $109.01 by Q2, and increase to $112.78 in Q3. By the end of the year, the price is projected to reach a high of $134.45.
Quarter | Minimum, $ | Average, $ | Maximum, $ |
Q1 | 101.33 | 105.06 | 107.77 |
Q2 | 105.93 | 109.01 | 112.19 |
Q3 | 105.44 | 112.78 | 118.21 |
Q4 | 117.37 | 126.78 | 134.45 |
WalletInvestor
Price range: $86.99–$118.00.
WalletInvestor believes that Netflix's stock price will move in different directions. The average price is predicted to reach $97.98 in Q1 and may drop to $94.31 in Q2. In the second half of the year, the stock price is forecast to rebound, hitting a high of $118.00 by Q4.
Quarter | Minimum, $ | Average, $ | Maximum, $ |
Q1 | 87.07 | 97.98 | 108.08 |
Q2 | 88.66 | 94.31 | 101.37 |
Q3 | 92.70 | 106.52 | 117.02 |
Q4 | 86.99 | 102.48 | 118 |
LongForecast
Price range: $111.85–$202.17.
LongForecast expects Netflix's stock price to rise dramatically and then enter a correction phase. The average price is projected to reach $125.63 in Q1 and advance to $150.22 in Q2. In Q3, the asset may peak at $202.17. By December, the price is estimated to retreat to $157.48.
Quarter | Minimum, $ | Average, $ | Maximum, $ |
Q1 | 111.85 | 125.63 | 144.45 |
Q2 | 123.68 | 150.22 | 178.77 |
Q3 | 153.33 | 177.75 | 202.17 |
Q4 | 126.96 | 157.48 | 182.18 |
Analysts' NFLX Price Projections for 2029
Forecasts for 2029 are mixed. The stock price may be influenced by subscriber growth rates, advertising revenue, content expenses, and the market's reaction to the company's financial results.
CoinCodex
Price range: $65.31–$162.22.
CoinCodex believes that Netflix's stock price will continue to rise in the first half of the year. The average price is expected to reach $133.81 in Q1 and $152.98 in Q2. After that, NFLX may start to decline, reaching a low of $65.31 by December.
Quarter | Minimum, $ | Average, $ | Maximum, $ |
Q1 | 125.44 | 133.81 | 143.47 |
Q2 | 144.12 | 152.98 | 162.22 |
Q3 | 148.09 | 152.41 | 156.46 |
Q4 | 65.31 | 92.69 | 154.8 |
WalletInvestor
Price range: $90.81–$130.44.
WalletInvestor forecasts that Netflix's stock price will increase in the first half of the year. The average value may grow to $116.04 by Q2. In Q3, the price is anticipated to reach a high of $130.44. By year-end, it may drop to $105.42.
Quarter | Minimum, $ | Average, $ | Maximum, $ |
Q1 | 102.08 | 111.90 | 125.91 |
Q2 | 101.76 | 116.04 | 127.06 |
Q3 | 112.35 | 122.01 | 130.44 |
Q4 | 90.81 | 105.42 | 118.34 |
LongForecast
Price range: $90.95–$164.04.
According to LongForecast, Netflix's stock price is expected to decrease. The average price is estimated to be $137.72 in Q1 and could slide to $124.52 in Q2. By year-end, the price is projected to plummet to a low of $90.95.
Quarter | Minimum, $ | Average, $ | Maximum, $ |
Q1 | 121.51 | 137.72 | 164.04 |
Q2 | 105.16 | 124.52 | 151.89 |
Q3 | 97.37 | 108.48 | 119.21 |
Q4 | 90.95 | 106.48 | 121.86 |
Analysts' NFLX Price Projections for 2030
Analysts predict different scenarios for Netflix's stock in 2030. Some pullbacks are possible. Revenue growth rates, new product launches, and major releases could affect the stock price.
CoinCodex
Price range: $61.13–$87.15.
Based on CoinCodex's calculations, the average price will be $65.26 in Q1 and $65.13 in Q2. In Q3, the price is predicted to fall to a low of $61.13. However, an uptrend is expected after that, and the price may reach a high of $87.15 by year-end.
Quarter | Minimum, $ | Average, $ | Maximum, $ |
Q1 | 64.30 | 65.26 | 66.15 |
Q2 | 63.98 | 65.13 | 66.75 |
Q3 | 61.13 | 65.58 | 73.02 |
Q4 | 66.56 | 77.24 | 87.15 |
WalletInvestor
Price range: $93.95–$155.11.
WalletInvestor suggests that after a decline in the first half of the year, Netflix's stock price will rally. The average price is expected to reach $122.44 in Q1 and decline to $108.82 in Q2. In Q3, the asset is expected to rebound to $134.46. By December, the price may reach a high of $155.11.
Quarter | Minimum, $ | Average, $ | Maximum, $ |
Q1 | 112.43 | 122.44 | 134 |
Q2 | 93.95 | 108.82 | 128.88 |
Q3 | 126.49 | 134.46 | 143.52 |
Q4 | 125.17 | 141.02 | 155.11 |
Analysts' NFLX Price Projections until 2050
Long-term forecasts for Netflix remain speculative due to high market uncertainty. The stock price may be affected by developments in streaming services, competition, new business segments, content expenses, and the state of the global economy. Such estimates should be viewed as possible scenarios rather than precise target levels.
According to StockScan, Netflix's stock price may rise. The average price is expected to reach $1,043.24 by 2035 and $1,618.49 by 2050.
CoinPriceForecast offers a more conservative forecast, predicting that the price could reach $201.57 by the end of 2033 and $220.11 by 2035.
Year | StockScan, $ | CoinPriceForecast, $ |
2033 | – | 201.57 |
2035 | 1,043.24 | 220.11 |
2040 | 1,140.51 | – |
2050 | 1,618.49 | – |
Market Sentiment for NFLX (Netflix) on Social Media
Media sentiment regarding NFLX can influence the stock's short-term price movements. Traders' expectations can amplify momentum and shift the mood of market participants as the stock approaches key levels. Social media discussions help determine whether the market is ready to drive the stock higher or if a correction is likely.
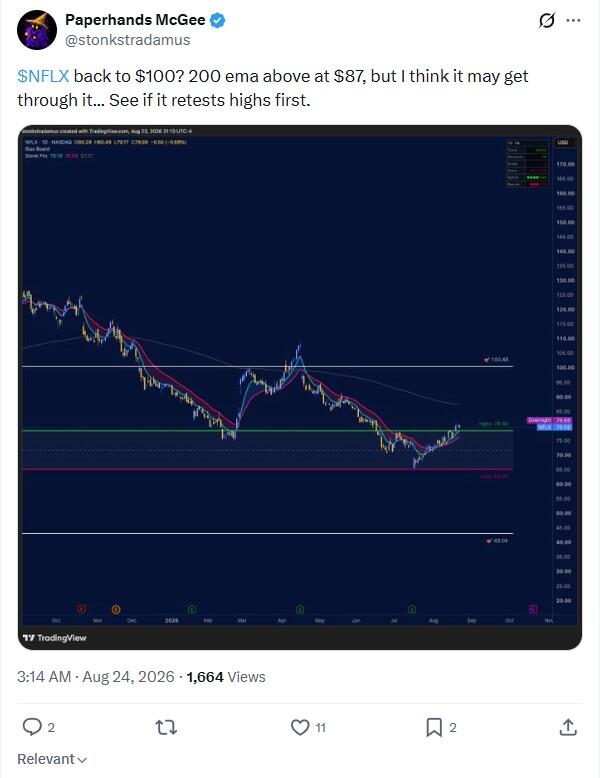
User @stonkstradamus shares an upbeat outlook, expecting NFLX to rebound to higher levels. The user notes that further gains depend on whether the price can break through the nearest resistance level.
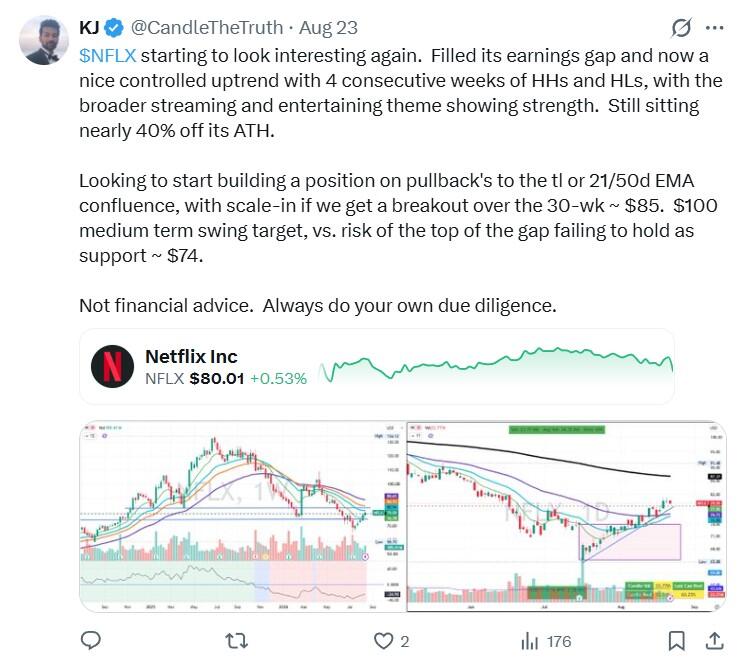
User @CandleTheTruth also expects prices to rise. They suggest using pullbacks to add to long positions.
Overall, sentiment toward NFLX remains moderately positive. Users expect the stock to continue rising once the correction ends. However, before making any trading or investment decisions, it is crucial to conduct technical and fundamental analysis and review the latest expert insights.
NFLX Price History
Netflix (NFLX) reached its all-time high of $N/A on N/A.
The lowest price of Netflix (NFLX) was recorded on N/A when the stock declined to $N/A.
Below is a chart showing the performance of #NFLX shares over the last ten years. In this connection, it is important to evaluate historical data to make predictions as accurate as possible.
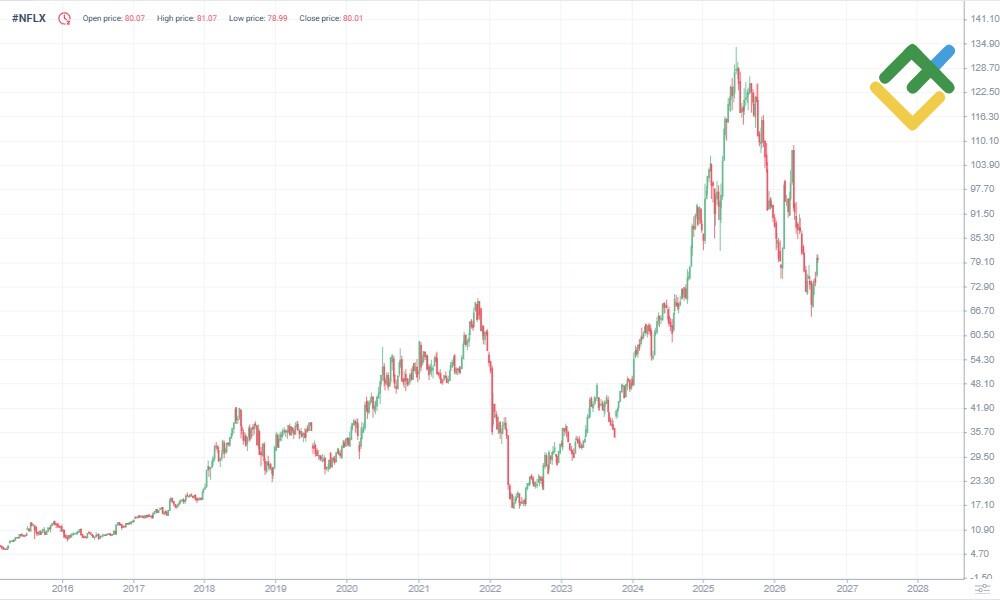
- 2018 — correction. After a long period of growth, Netflix shares faced profit-taking and investor concerns about rising content production costs, leading to a prolonged sideways trend and a moderate decline.
- 2020 — growth. The pandemic drove a surge in the subscriber base. The closure of movie theaters and the rise of online content consumption led to a sharp jump in shares, making this one of the most successful periods for the company.
- 2022 — decline. Reports of declining subscriber figures, growing competition, and a review of monetization strategies triggered a significant drop in the share price.
- 2025 — all-time high. Strong financial results and growth in the advertising segment drove the stock to an all-time high of $134.10. After that, a correction set in, and the price declined to $102.86 by the end of November. On November 17, Netflix completed a 10-for-1 stock split.
- 2026 — decline and consolidation. From early January through mid-February, the price fell to $75.21. In April, the stock climbed to $107.83. However, the trend subsequently turned bearish again, and the price dropped to $79.36 by the end of August.
NFLX Shares Fundamental Analysis
The price of Netflix stock is influenced by a number of factors, particularly financial performance such as revenue, earnings, and debt, broader economic conditions, and market supply and demand. Company news, industry shifts, and competitor developments also play an important role. Investors also consider the political environment, the Fed's key interest rates, and analysts' forecasts.
What Factors Affect the NFLX Stock?
The following are the factors that determine Netflix's stock price.
- Financial Performance. Revenue, profit, and subscriber growth directly influence stock prices. For example, the company added 5.1 million subscribers in the third quarter of 2024, exceeding analysts' forecasts. As a result, NFLX's stock price increased.
- Competition. The actions of competitors such as Disney+, Amazon Prime Video, Apple TV+, and other streaming services can negatively affect Netflix's market share and, accordingly, its stock price.
- Innovation and Content. Investments in original content and technological innovations attract new users and retain existing ones, positively impacting stock prices.
- Macroeconomic Conditions. Overall economic trends, including changes in interest rates and inflation, can influence investment decisions and stock prices.
- Regulation and Legal Issues. Changes in legislation, tax investigations, or other legal problems can negatively affect NFLX's stock price. For example, in November 2024, Netflix's offices in France and the Netherlands were raided as part of an investigation into suspected tax fraud.
- Overall Stock Market Conditions. It is important to be aware of the current cycle of the US stock market. If stock indices rise over a long period, it indicates an upward trend, likely supporting NFLX's stock price growth. If the stock market declines, the company's shares may fall.
- Market Trends and Consumer Behavior. Changes in consumer psychology, such as reduced screen time or a shift to alternative forms of entertainment, can affect demand and the price of Netflix's stock.
- Expansion into New Markets. Netflix is expanding into new markets and growing its subscriber base internationally. This factor is crucial in shaping the future price of NFLX shares. Success in various countries can lead to an increase in stock prices.
More Facts About Netflix (NFLX)
Netflix was founded in 1997 by Marc Randolph and Reed Hastings. Initially, it was a DVD-by-mail service, but in 2007, the company made a key move by transitioning to video streaming. This format allowed Netflix to become a pioneer in the online entertainment market, ensuring steady growth for the company.
A major factor behind Netflix's growth is its investment in original content. In 2013, the company released its first exclusive series (House of Cards, Orange Is the New Black), which immediately set it apart from competitors and reduced its reliance on licenses from other studios. The release of the hit series "Stranger Things" in 2016 was a breakthrough, particularly in terms of NFLX's growth.
The second major milestone was its international expansion: Netflix became available almost everywhere in the world. The COVID-19 pandemic also contributed to a sharp increase in subscribers and strengthened the company's market position.
Today, Netflix operates in several key areas: streaming video, original content creation, and technology. AI-based recommendation algorithms help personalize content selection for each user.
Netflix's popularity among traders is due to the high volatility of its stock, especially after releases of quarterly reports. These reports contain subscriber numbers and financial performance data, which influence the stock price dynamics.
Netflix's journey from a DVD rental service to a global streaming platform and production studio demonstrates how innovation and market adaptation can make a company a leader in the entertainment industry.
Advantages and Disadvantages of Investing in #NFLX
Investing in Netflix shares has advantages and disadvantages that should be considered when making investment decisions. Let's start with the pros:
- Market Leadership in Streaming. Netflix is one of the largest video streaming platforms with a global audience, ensuring a steady income stream.
- Original Content. The company actively invests in producing its own films and series, attracting new subscribers and reducing reliance on third-party content.
- International Expansion. Netflix continues to expand its presence in international markets, discovering new growth opportunities.
- Innovative Technology. Using advanced technologies and recommendation algorithms improves service quality and retains customers.
- Sector Popularity. The entertainment industry is currently on the rise and is popular among investors. Netflix's unconventional approach to content consumption has been appreciated by common people who prefer watching movies and series at home rather than in theaters. The benefits of this approach were particularly recognized during the COVID-19 pandemic.
- High Liquidity. NFLX is traded on the NASDAQ in the US, as well as on the London Stock Exchange (ticker: 0QYI) and the Frankfurt Stock Exchange (ticker: NFLO).
- High Volatility. The stock can rise sharply or fall, allowing for quick profits from price fluctuations.
Now, let's look at the cons:
- High Competition. The streaming service market is becoming increasingly saturated with players like Disney+, Amazon Prime Video, Apple, and others, which may limit Netflix's growth.
- Dependence on Content. The constant need to invest significant funds in new content creation can put pressure on the company's profitability. Moreover, not every TV show becomes successful.
- Stock Volatility. Netflix shares are subject to significant fluctuations, especially after quarterly reports, which increases trading and investment risks. This point could be seen as both a pro (due to the potential for quick profits) and a con.
- Regulatory Risks. Changes in legislation and tax policies in different markets could negatively impact the company's operations.
How We Make Forecasts
When making price predictions, we take many factors into account. Within the framework of fundamental analysis, our focus is primarily on the state of the global economy, US GDP growth rates, and the overall situation in the stock market and its sectors. An important element is the analysis of a company's financial indicators: financial statements, key growth metrics, revenue and profit, the number of outstanding shares, etc.
A combination of technical and fundamental analysis is used to draw up short-term, medium-term, and long-term forecasts. The first step is to determine the current trend on large time-frame charts. Next, key support and resistance levels are identified, and the current price position relative to these levels is analyzed.
In addition, indicators such as EMA, RSI, MACD, Ichimoku, and others are applied to determine favorable entry and exit points precisely. An individual approach is applied to each instrument.
We get general insights into the asset's trading prospects based on the collected information. Then, approximate levels for buying and selling are defined, and a long-term forecast is drawn up.
Conclusion: Is NFLX a Good Investment?
Netflix remains an attractive asset for a long-term investment portfolio, despite persistent volatility. The company has successfully shifted its focus from subscriber growth to increasing revenue per user through its advertising model and the expansion of its gaming division.
A strong content library and global presence support the business's stability. At the same time, investors should consider the high level of competition and signs of market saturation. The advertising segment has not yet fully realized its potential, and the gaming segment has not yet achieved sustainable profitability.
In the short term, the stock may face a correction. However, over a 5–10-year horizon, Netflix remains attractive to investors, especially if the company succeeds in developing new areas, including sports content and live streaming.
NFLX Stock Price Prediction FAQs
The current NFLX share price is $N/A as of 24.10.2026.
The outlook for Netflix stock is uncertain. Both periods of growth and pronounced corrections are likely. In the long term, experts predict an uptrend, though estimates vary widely. Strong volatility is possible in certain years.
In 2027, Netflix shares are expected to trade between $67.22 and $138.68. Most experts anticipate an uptrend, but their estimates of the growth rate vary.
In 2030, Netflix shares are predicted to trade between $61.13 and $155.11. Forecasts vary widely: some experts forecast a decline with a possible recovery by December, while others predict a steady uptrend.
Netflix's stock price may rise in the long term, but sharp declines are possible. Some experts anticipate periods of sideways movement. Thus, even if the uptrend continues, investors should be mindful of high volatility and market uncertainty.
Netflix shares can be an appealing option for investors counting on the company's future growth. However, before buying, it is important to consider the company's current valuation, potential corrections, market volatility, and to define an acceptable risk level.
Netflix's stock can be considered a good long-term investment. Most experts anticipate significant growth in the NFLX share price. However, estimates vary widely, and long-term forecasts for 2040–2050 are highly uncertain. The actual share price will depend on a variety of factors.
Follow the company's financials and evaluate the popularity of its content to assess the potential of the NFLX stock. Monitor the introduction of innovations, the release of new series and movies, and competitors. Opinions about the company on social media can also offer insight into investment prospects.
Price chart of #NFLX in real time mode
The content of this article reflects the author’s opinion and does not necessarily reflect the official position of LiteFinance broker. The material published on this page is provided for informational purposes only and should not be considered as the provision of investment advice for the purposes of Directive 2014/65/EU.
According to copyright law, this article is considered intellectual property, which includes a prohibition on copying and distributing it without consent.