This article provides a comprehensive overview of the USCRUDE trading instrument, addressing crucial components such as the current state of the oil market, influential factors affecting oil price shifts, and future forecasts. The outlook for oil prices employs a multifaceted approach, encompassing fundamental and technical analysis to provide a nuanced and informed market assessment.
In addition, the article offers a detailed long-term trading strategy, empowering investors to accurately identify optimal entry and exit points, thereby minimizing risk while maximizing returns. Furthermore, the article draws upon the insights of industry experts and examines prevailing sentiments on social media concerning crude oil prices, offering a well-rounded and informed analysis of the current and future state of the oil market.
The article covers the following subjects:
- Major Takeaways
- Oil Real-Time Market Status
- Oil Weekly Price Forecast as of 27.07.2026
- Oil Price Forecast for 2026 Based on Technical Analysis
- Analysts' Oil Price Projections for 2027
- Analysts' Oil Price Projections for 2028
- Analysts' Oil Price Projections for 2029
- Analysts' Oil Price Projections for 2030
- Analysts' Oil Price Projections until 2050
- Market Sentiment for Crude Oil on Social Media
- Oil Price History (USCrude)
- Oil Price Fundamental Analysis (USCrude)
- More Facts About Oil
- How We Make Forecasts
- Conclusion: Is Oil a Good Investment?
- Oil Price Prediction FAQs
Major Takeaways
- The current price of oil is $85.028 as of 02.08.2026.
- Oil reached its all-time high of $147.27 on 11.07.2008. Oil's all-time low of $-40.32 was recorded on 20.04.2020.
- Oil represents one of the most liquid assets in global markets, traded in US dollars.
- The leading oil exporters are Saudi Arabia, Russia, and the US, which provide a significant share of global supply.
- Oil reserves in strategic storage facilities of OECD countries remain an essential factor affecting crude oil price performance.
- Forecasts for crude oil prices in 2026 vary widely. Pessimistic forecasts predict a decline to $75.69 by the end of the year, while optimistic ones suggest a rise to $174.00.
- Forecasts for 2027 are also mixed. Some analysts believe that the price of oil could rise to $221.00. Other analysts predict a decline to around $70.47.
- Looking ahead to 2028–2030, the divergence among forecasts widens. Some estimates point to a market downturn, with the price declining to $64.55 by August 2030. At the same time, some analysts consider the possibility of a rise above $260.00 by the end of 2030.
- It is extremely difficult to forecast oil prices for 2040–2050. The energy transition, technological advancements, shifts in global demand, and the geopolitical landscape could significantly impact the market. Therefore, long-term estimates should be viewed as possible scenarios rather than precise price benchmarks.
- USCrude: According to technical analysis, oil prices have shifted to a medium-term uptrend.
Oil Real-Time Market Status
Oil is trading at $85.028 as of 02.08.2026.
To make informed decisions, it is essential to closely monitor key indicators that reflect the current oil price landscape, including historical trends and investment potential. By leveraging this comprehensive data set, you can assess market trends, identify correlations with macroeconomic factors, and forecast price changes.
Indicator | Value |
All-time low | $-40.32 |
All-time high | $147.27 |
Price change over the last 12 months | +20.1% |
US crude production (bpd) | 13.86 million |
Oil Weekly Price Forecast as of 27.07.2026
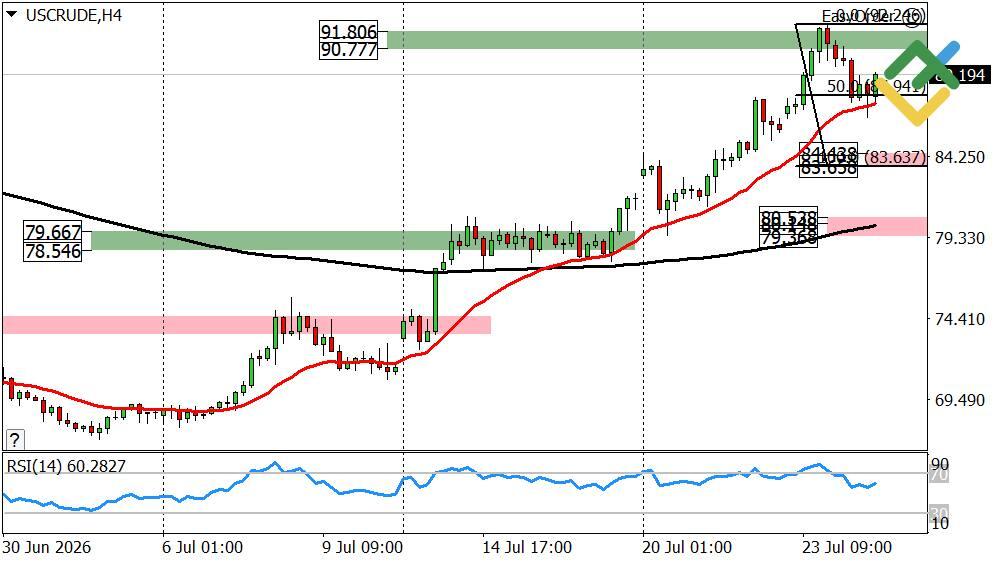
Last week, the oil price reversed its medium-term trend, rising to the Target Zone 2, 91.80–90.77. Once this zone was reached, a downward correction started. If the correction continues this week, the asset may slide to support A of 84.43–83.65. Consider long trades near it, with the first target at 87.94 and the second one around 92.24.
If the price of oil breaks and settles above the Target Zone 2, the next bullish target will be the Target Zone 3 of 99.31–98.61.
USCrude Trading Ideas for the Week:
Buy near support A of 84.43–83.65. TakeProfit: 87.94, 92.24. StopLoss: 81.64.
Technical analysis based on the margin zones methodology is presented by an independent analyst, Alex Rodionov.
Oil Price Forecast for 2026 Based on Technical Analysis
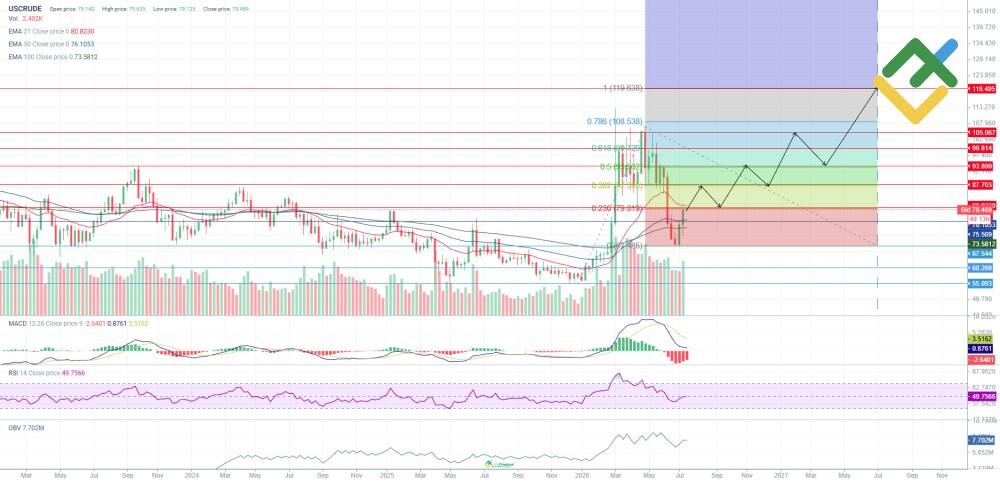
In spring, USCrude hit a yearly high, and a deep correction followed. The price is attempting to recover, holding near 79.56 above the EMA50 (76.11) and EMA100 (73.58) and remaining below the EMA21 (80.83). The outlook remains neutral, with a moderate bullish bias.
The nearest support zone is between 73.58 and 76.11, with lower support levels at 67.54 and 60.27.
The first resistance zone is at 79.83–80.83. If the price breaks through this level, it may climb further to Fibonacci extension targets at 87.70, 93.89, 99.81, 108.63, and 119.77.
MACD remains below the signal line for now, but the bearish momentum is weakening. The RSI is hovering around 50, indicating that buyer and seller strength are roughly equal. The OBV is recovering after a decline, and recent candlesticks are forming a support area above the moving averages.
If the price consolidates above 80.83, the uptrend will likely continue. Conversely, a move below 73.58 will bring back selling pressure, pushing prices to 67.54.
Below is a 12-month price forecast for USCrude.
Month | Minimum, $ | Maximum, $ |
July 2026 | 73.58 | 80.83 |
August 2026 | 75.57 | 84.00 |
September 2026 | 76.11 | 87.70 |
October 2026 | 78.00 | 90.00 |
November 2026 | 80.00 | 93.89 |
December 2026 | 82.00 | 96.00 |
January 2027 | 84.00 | 99.81 |
February 2027 | 86.00 | 102.00 |
March 2027 | 87.70 | 105.07 |
April 2027 | 90.00 | 108.63 |
May 2027 | 93.89 | 114.00 |
June 2027 | 99.81 | 119.77 |
Long-Term Trading Plan for #USCrude for 2026
The outlook for USCRUDE over the next 12 months remains neutral, with a possible shift to a bullish trend.
The main scenario assumes that the price will hold within the 76.11–73.58 range and consolidate above the resistance zone of 79.83–80.83. An entry can be considered after a decisive breakout of this zone and confirmation from the MACD, RSI, and OBV.
The first target will be the Fibonacci extension level at 87.70. Further targets are located at 93.89, 99.81, 108.63, and 119.77. A partial closure is possible near each subsequent target if momentum weakens or reversal candlesticks appear.
A drop below 73.58 would invalidate the bullish scenario and open the way to 67.54.
A sustained move above 99.81 would reinforce the long-term uptrend and increase the likelihood of a move toward 108.63, and then to 119.77 in the second half of the forecast period.
Analysts' Oil Price Projections for 2026
Forecasts for oil prices in the second half of 2026 vary significantly. Some experts anticipate continued high volatility, while others expect prices to gradually decline by the end of the year. Some figures point to a significant increase.
LongForecast
Price range: $61.40–$93.37.
According to LongForecast, volatility will remain high in July and August. In August, crude prices could rise to $93.37, after which a correction is likely in the fall. The price of oil is expected to recover to $86.32 by December.
Month | Min–Max, $ | Close, $ |
July | 67.04–90.17 | 83.73 |
August | 61.40–93.37 | 88.92 |
September | 79.24–88.92 | 83.41 |
October | 74.33–83.41 | 78.24 |
November | 77.22–85.34 | 81.28 |
December | 81.28–90.64 | 86.32 |
WalletInvestor
Price range: $73.35–$80.41.
According to WalletInvestor, oil prices will gradually decline in the second half of 2026. The closing price in July will be $77.88, and by December, it will likely drop to $75.69. The price is expected to reach a yearly low of $73.35 at the end of the year.
Month | Open, $ | Close, $ | Minimum, $ | Maximum, $ |
July | 78.14 | 77.88 | 75.62 | 80.41 |
August | 77.87 | 77.44 | 75.12 | 80.20 |
September | 77.42 | 77.01 | 75.32 | 79.13 |
October | 77.00 | 76.57 | 73.81 | 79.77 |
November | 76.55 | 76.14 | 74.54 | 78.16 |
December | 76.12 | 75.69 | 73.35 | 78.48 |
Coin Price Forecast
Price range: $136.00–$174.00.
Coin Price Forecast expects oil prices to grow in 2026. According to the forecast, the price could reach $136.00 by mid-2026 and rise to $174.00 by the end of the year. This is the most optimistic scenario among the sources reviewed.
Year | Mid-Year, $ | Year-End, $ |
2026 | 136.00 | 174.00 |
Analysts' Oil Price Projections for 2027
The outlook for 2027 remains mixed. Some analysts expect wide fluctuations, with periods of growth and correction. Others anticipate a gradual decline in prices. Some forecasts point to a significant strengthening of oil prices.
Note: The price ranges reflect the asset's expected volatility throughout the year. Lows and highs may not be shown in the summary tables.
LongForecast
Price range: $75.06–$98.53.
According to LongForecast, the strongest growth will occur in the first quarter, with prices rising to $98.53. A gradual decline is likely in the spring and summer, but oil prices may rebound in the fourth quarter. The average price by the end of the year is expected to be around $89.75.
Quarter | Minimum, $ | Average, $ | Maximum, $ |
Q1 | 83.94 | 91.43 | 98.53 |
Q2 | 80.02 | 86.37 | 92.96 |
Q3 | 75.06 | 84.01 | 93.57 |
Q4 | 82.86 | 89.75 | 97.63 |
WalletInvestor
Price range: $68.15–$77.80.
According to WalletInvestor, oil prices will gradually decline in 2027. The average price is expected to fall from $74.84 in the first quarter to $70.91 in the fourth. The low is projected for the end of the year, when prices are expected to drop to $68.15.
Quarter | Minimum, $ | Average, $ | Maximum, $ |
Q1 | 72.10 | 74.84 | 77.80 |
Q2 | 70.99 | 73.54 | 77.37 |
Q3 | 69.06 | 72.22 | 74.95 |
Q4 | 68.15 | 70.91 | 74.11 |
Coin Price Forecast
Price range: $174.00–$221.00.
Coin Price Forecast expects oil prices to rise sharply. By mid-2027, prices could be around $174.00, and by the end of the year, they could rise to $221.00.
Year | Mid-Year, $ | Year-End, $ |
2027 | 174.00 | 221.00 |
Analysts' Oil Price Projections for 2028
Forecasts for 2028 vary significantly. Some estimates point to significant volatility and a gradual decline in oil prices in the second half of the year. At the same time, some platforms offer a more bullish scenario.
LongForecast
Price range: $71.95–$96.17.
According to LongForecast, crude prices will rise to $96.17 in the first quarter, then likely fluctuate between $81.20 and $95.68, after which the market will probably begin to decline. The low is expected in the fourth quarter at $71.95, but by December, oil prices may rebound to around $77.77.
Quarter | Minimum, $ | Average, $ | Maximum, $ |
Q1 | 80.17 | 87.57 | 96.17 |
Q2 | 81.20 | 88.35 | 95.68 |
Q3 | 73.42 | 79.64 | 85.54 |
Q4 | 71.95 | 77.77 | 84.41 |
WalletInvestor
Price range: $78.47–$144.52.
WalletInvestor anticipates oil prices to rise sustainably in 2028. After fluctuating between $78.47 and $119.33 early in the year, prices could rise to $125.90 by summer. High volatility is expected to persist in the second half of the year, and by December, the price of oil could approach $136.74. The maximum forecast level is $144.52.
Quarter | Minimum, $ | Average, $ | Maximum, $ |
Q1 | 78.47 | 94.80 | 119.33 |
Q2 | 101.66 | 114.60 | 131.42 |
Q3 | 113.43 | 125.90 | 136.74 |
Q4 | 117.03 | 130.10 | 144.52 |
Coin Price Forecast
Price range: $233.00–$233.00.
CoinPriceForecast projects oil prices to rise to $233.00 by mid-2028. The projection remains at that level through the end of the year. This means that after a strong rally, prices may stabilize.
Year | Mid-Year, $ | Year-End, $ |
2028 | 233.00 | 233.00 |
Analysts' Oil Price Projections for 2029
Most forecasts for 2029 point to a strong upward trend, with growth accelerating in the second half of the year. However, some analysts suggest that prices may trade within a narrow range without a sustained long-term trend.
LongForecast
Price range: $69.49–$92.55.
According to LongForecast, oil prices will rise to $92.55 in the first quarter, then likely decline in the spring. The annual low is expected in May at around $69.49. Prices may recover in the second half of the year, with the average price in December likely to be $82.74.
Quarter | Minimum, $ | Average, $ | Maximum, $ |
Q1 | 78.84 | 84.76 | 92.55 |
Q2 | 69.49 | 76.28 | 83.15 |
Q3 | 75.45 | 83.90 | 92.33 |
Q4 | 78.14 | 82.74 | 87.93 |
WalletInvestor
Price range: $130.75–$245.92.
WalletInvestor suggests that oil will likely trade in a range of $130.75 to $170.92 in early 2029. Growth could accelerate in the spring, and average estimated values could approach $185.00 in the summer. The upward trend may continue in the fourth quarter, reaching a yearly high of $245.92 in December.
Quarter | Minimum, $ | Average, $ | Maximum, $ |
Q1 | 130.75 | 147.72 | 170.92 |
Q2 | 148.50 | 170.95 | 194.82 |
Q3 | 160.09 | 184.57 | 206.70 |
Q4 | 176.24 | 207.87 | 245.92 |
Coin Price Forecast
Price range: $244.00–$252.00.
Coin Price Forecast expects oil prices to rise moderately throughout 2029. By mid-year, the price could reach $244.00, and by December, it could rise to $252.00.
Year | Mid-Year, $ | Year-End, $ |
2029 | 244.00 | 252.00 |
Analysts' Oil Price Projections for 2030
Most analytical platforms are optimistic about the future of oil prices. Many analysts believe that the asset may reach fresh all-time highs. However, if a bearish scenario unfolds, US Crude could drop sharply.
LongForecast
Price range: $61.32–$83.97.
According to LongForecast, the average oil price will remain around $79.00 in the first quarter. Selling pressure is expected to intensify in the spring, with the downward trend continuing into the summer. By August, the closing price is likely to fall to $64.55.
Quarter | Minimum, $ | Average, $ | Maximum, $ |
Q1 | 74.58 | 79.00 | 83.97 |
Q2 | 69.70 | 75.08 | 82.13 |
Q3 | 61.32 | 66.69 | 73.37 |
WalletInvestor
Price range: $184.66–$262.57.
WalletInvestor anticipates that in early 2030, the asset's price will trade within a wide range of $184.66 to $250.28. A recovery is expected in the second quarter, followed by accelerated growth during the summer. The maximum price of $262.57 is expected in the third quarter. A correction is likely in the fall, after which prices could drop to $212.30 by the end of December.
Quarter | Minimum, $ | Average, $ | Maximum, $ |
Q1 | 184.66 | 206.30 | 231.06 |
Q2 | 188.92 | 220.00 | 250.28 |
Q3 | 193.60 | 229.00 | 262.57 |
Q4 | 191.98 | 212.30 | 230.98 |
Coin Price Forecast
Price range: $258.00–$267.00.
Coin Price Forecast expects a moderate increase in oil prices throughout 2030. By mid-year, crude prices could reach $258.00, and by December, they could rise to $267.00.
Year | Mid-Year, $ | Year-End, $ |
2030 | 258.00 | 267.00 |
Analysts' Oil Price Projections until 2050
Forecasting oil prices through 2040–2050 carries considerable uncertainty. The market can be influenced by a variety of factors: the development of renewable energy, the proliferation of electric vehicles, changes in the structure of global demand, technological shifts in production, decisions by OPEC+ countries, geopolitical conflicts, and the environmental policies of major nations. It is difficult to accurately assess all these factors over such a long time horizon. Therefore, long-term forecasts should be viewed as approximate scenarios rather than exact predictions.
Nevertheless, expert assessments retain practical value. Comparing different scenarios helps us understand how the oil market might change in the event of rising demand, supply constraints, or an accelerated energy transition. This allows us to envision possible price trends and form a more comprehensive picture of the long-term outlook for the commodities market. However, the further out the forecast horizon, the higher the probability that the actual price will deviate significantly from the projected values.
According to Coin Price Forecast, oil could reach $279.00 by the end of 2031. Analysts expect the upward trend to continue, with prices potentially rising to $299.00 by the end of 2033, $326.00 by the end of 2035, and approximately $359.00 by the end of 2037.
Year | Coin Price Forecast, $ |
2031 | 279.00 |
2033 | 299.00 |
2035 | 326.00 |
2037 | 359.00 |
Market Sentiment for Crude Oil on Social Media
Media sentiment helps assess which scenarios market participants consider most likely and often amplifies short-term movements in oil prices.
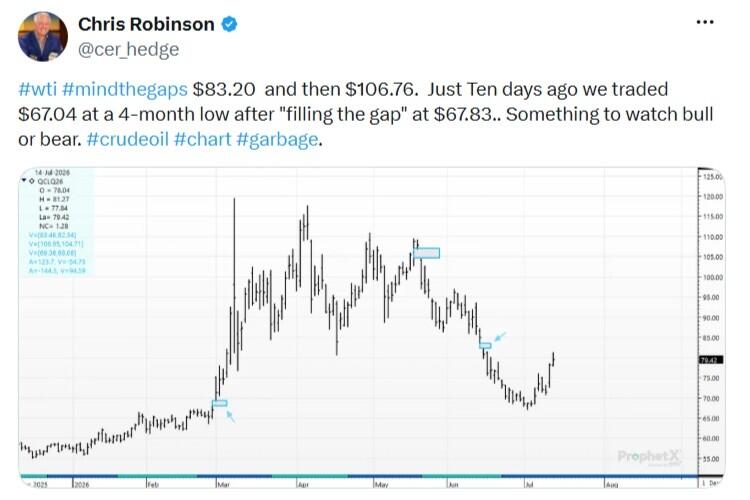
For example, a user on social media platform X (formerly Twitter) with the username Chris Robinson notes WTI's recovery from a low of $67.04 and cites $83.20 and $106.76 as possible upside targets. The post reflects a cautiously bullish outlook and the expectation that the rally will continue once the price gap closes.
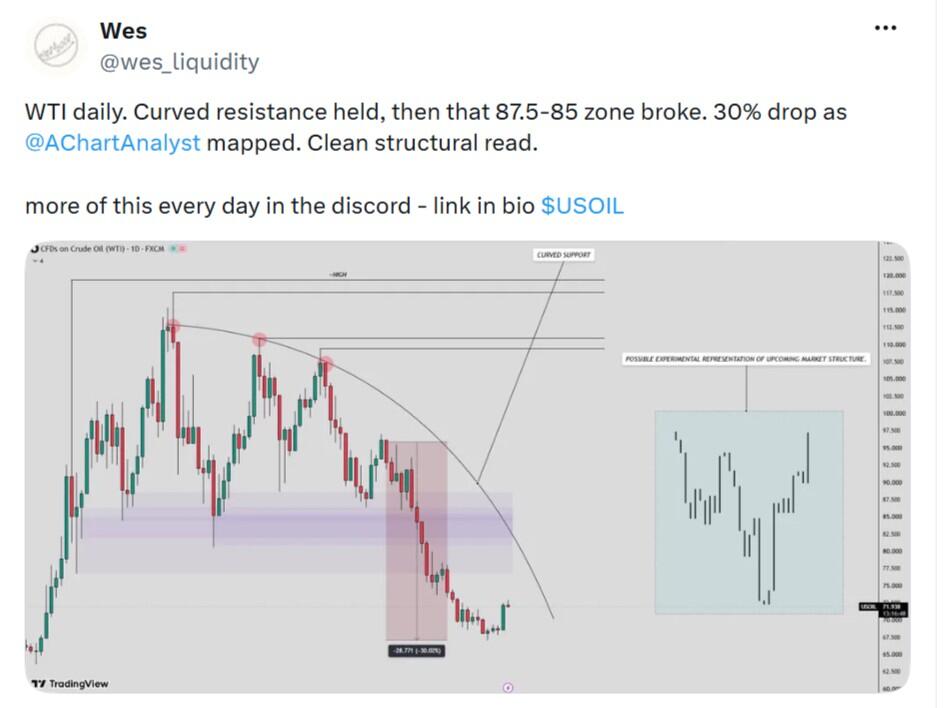
User Wes highlights a break below the $87.5–85.00 range and a subsequent decline of approximately 30%. At the same time, the chart suggests the formation of a reversal pattern following a sharp sell-off.
In general, sentiment surrounding WTI is mixed: market participants acknowledge the bearish pattern but are increasingly considering a rebound toward the nearest resistance levels. A sustained move above these levels could significantly boost buyer confidence in the oil market.
Oil Price History (USCrude)
Oil (USCrude) reached its all-time high of $147.27 on 11.07.2008.
The lowest price of oil (USCrude) was recorded on 20.04.2020 and reached $-40.32.
Below is a chart showing the performance of USCrude quotes over the last ten years. In this connection, it is important to evaluate historical data to make predictions as accurate as possible.
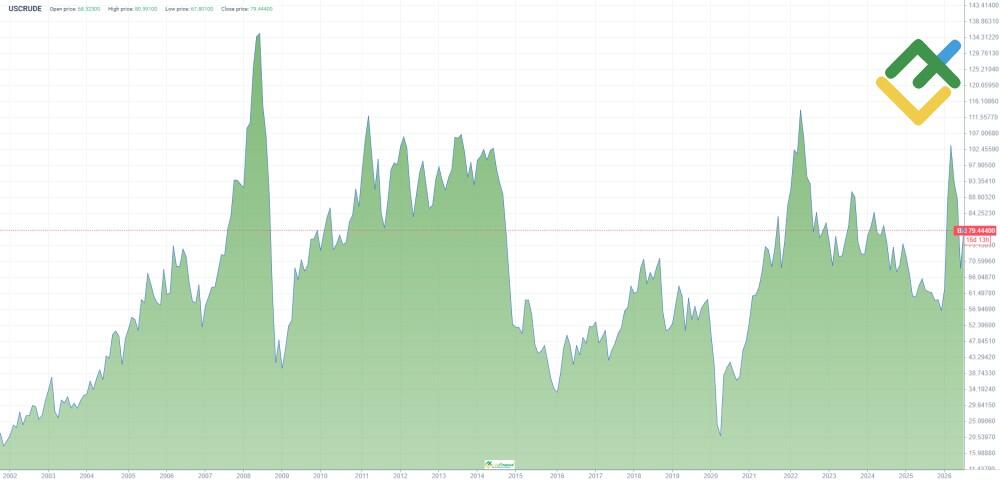
The USCrude price has displayed considerable volatility since 2003, reflecting economic and political developments worldwide. In 2008, oil prices surged to an all-time high of $147 per barrel, driven by rising demand in developing countries and constrained supply. However, the global financial crisis triggered a significant drop in prices, reaching $40, one of the steepest declines in history.
In 2014–2015, the price of oil substantially declined due to an oversupply in the market and a surge in shale oil production in the US. This marked a pivotal shift in the industry's landscape and the global oil trade sector.
In 2020, the global oil demand experienced a significant decline due to the impact of the pandemic, resulting in a temporary decline in crude prices below zero.
In 2021, the market began to recover amid a gradual increase in oil consumption. In 2022, US Crude prices traded in the $70–$120 per barrel range, reflecting geopolitical tensions, supply constraints, and rising inflation.
From early 2024, USCrude prices were highly volatile. In the first quarter, prices rose to $87.10 amid geopolitical tensions and expectations of stronger demand. However, from the second quarter through year-end, prices fell to $75.71 amid increased production and recession concerns.
The downtrend gained momentum in the early months of 2025. By early May, the asset's price had fallen to $55.04. By mid-June, the price had rebounded to $76.59, but from August onward it declined gradually. Toward the end of the year, prices traded within a broad $55–$62 range.
In March 2026, the price jumped to $113.13 amid reports on oil reserves and geopolitical tensions in the Middle East. Through June, oil traded within a wide range of $78.86–$107.32.
In late June, oil prices fell sharply, and in early July, they dropped to a low of about $67.04. Prices then rebounded to $79.56, but remained significantly below the March peak.
Oil Price Fundamental Analysis (USCrude)
Fundamental analysis is the key to understanding the factors that influence oil prices. This section focuses on the economic, political, and environmental factors that determine supply and demand, as well as the fluctuations in the value of US Crude in the global market. Understanding these aspects provides a more accurate assessment of the asset's long-term prospects. The analysis also includes an evaluation of the impact of energy policy and technological advancements in the industry.
What Factors Affect the Oil Price?
The price of oil is shaped by a variety of fundamental factors that reflect the state of the global economy and geopolitical environment:
- The level of global oil demand, especially in the major economies.
- The volume of oil production by the largest oil-producing countries.
- Oil reserves in strategic storage facilities.
- Political stability in oil-rich regions.
- Transportation costs and infrastructure constraints.
- The exchange rate of the US dollar, as oil is quoted in the US currency.
- Development of alternative energy sources and environmental initiatives.
- Force majeure, including natural and technological disasters.
- Seasonal changes in fuel demand, especially during heating and summer periods.
- Government subsidies or tax policies that affect the cost of oil production and transportation.
These factors play a key role in determining oil prices. They should be considered when making short- and long-term forecasts.
More Facts About Oil
Oil is a valuable natural resource that plays a key role in the world economy. This versatile hydrocarbon product is used in the production of fuel, plastics, chemicals, and electricity. Crude oil is classified into different types, including Brent, WTI, and Dubai benchmark grades, each with its own characteristics and designated applications.
Oil is extracted in various regions worldwide, with Saudi Arabia, Russia, the United States, and Canada being the leading producers. The primary extraction methods include conventional drilling and shale oil extraction. Transportation is facilitated through pipelines, tankers, and railroad trains.
The pricing of oil is influenced by a variety of factors, including supply and demand shifts, geopolitical events, and decisions made by organizations such as OPEC. It is traded on global exchanges, such as NYMEX and ICE.
The history of oil spans more than 150 years, beginning with the first commercial production in 1859 in the US. Despite the emergence of alternative energy sources such as solar and wind power, oil continues to dominate the global energy landscape.
Advantages and Disadvantages of Investing in USCrude
Investing in oil is a common strategy for diversifying an investment portfolio, given its high liquidity and profit potential. However, it is essential for investors to carefully assess the risks associated with price volatility and external factors.
Advantages
- High liquidity: oil is actively traded on global exchanges, making it easy to buy and sell.
- Growth potential: oil prices can rise significantly on the back of increased demand, especially during an economic recovery
- Inflation hedging: investing in oil can help safeguard a portfolio against inflation and the potential loss of purchasing power.
- Portfolio diversification: investing in oil reduces overall risk by adding commodity assets that are not correlated with equities.
- Opportunity for speculation: the high volatility of oil provides ample opportunity for short-term strategies, allowing you to capitalize on sharp changes in quotes.
- Global importance: oil remains a key commodity for the global economy, ensuring its stable demand.
Disadvantages
- High volatility: oil prices are subject to sharp fluctuations due to external factors such as crises or changes in demand.
- Dependence on geopolitics: instability in oil-producing regions can lead to sharp price changes, representing an additional risk.
- Environmental risks: growing environmental requirements may limit production and increase production and transportation costs.
- Long-term uncertainty: alternative energy may reduce oil demand, affecting its prospects as an asset.
- Limited access: for retail investors, access to oil markets may be restricted by the intricacies of futures trading.
- Dependence on macroeconomic factors: economic downturns or slowdowns can adversely impact the value of USCrude.
Investing in oil can present both significant opportunities for high returns and considerable risks. Consequently, it is essential to carefully consider global economic and political factors while monitoring trends within the energy industry to make informed investment decisions.
How We Make Forecasts
The forecasting methodology involves analyzing data over three time horizons: short, medium, and long term. Each approach employs specific tools and analysis methods.
Short-term forecasts
Short-term forecasts rely on technical indicators such as moving averages, the RSI, and support and resistance levels. In addition, relevant news and geopolitical events help predict short-term price swings.
Medium-term forecasts
The medium-term outlook focuses on key fundamental data, including production volumes, oil reserves, and economic indicators such as demand in major economies. Seasonal changes in supply and demand are also evaluated.
Long-term forecasts
Long-term forecasts are based on a comprehensive assessment of global trends, including the transition to green energy, changes in OPEC policies, and technological advancements. In addition, price history analysis and scenario modeling complement the outlook.
This comprehensive approach allows us to consider various factors affecting the oil market and deliver precise forecasts.
Conclusion: Is Oil a Good Investment?
Oil may remain an attractive investment, but its price is expected to remain highly volatile. While price fluctuations in 2026 could create opportunities for gains, they also make long-term forecasts less certain.
As a result, oil may be a valuable addition to a diversified portfolio, particularly as demand continues to recover while supply remains constrained. However, any investment decision should take into account the market's strong sensitivity to geopolitical developments, production levels, and the overall health of the global economy.
Oil Price Prediction FAQs
The current price of oil is $85.028 as of 02.08.2026.
Forecasts remain divided: while some analysts expect only modest gains—or even a decline—others foresee significant upside. The market's near-term direction will largely depend on whether oil prices can hold above key technical support levels.
Sharp price swings are possible in the second half of 2026. According to some forecasts, oil could rebound to $86.32, while others anticipate a decline to $75.69. More optimistic projections are even more ambitious, suggesting that prices could climb to $174 by year-end.
Forecasts for 2027 vary: some analysts expect prices to fluctuate between $75.06 and $98.53, while others predict a gradual decline. There are also more optimistic estimates suggesting that oil prices could rise to $221 by the end of the year.
Forecasts remain highly divergent. Some analysts expect oil prices to fall to around $64.55 by August, while others project a rally to $267 by the end of the year. Several long-term forecasts are even more optimistic, pointing to the potential for substantial price growth in the years ahead.
Oil prices will remain volatile in the coming years. Growth is possible if demand increases, but the transition to green energy and reduced dependence on hydrocarbons create risks for long-term investments.
Investing in oil can be a worthwhile strategy as part of a diversified portfolio. While the asset continues to offer growth potential, its price remains highly sensitive to geopolitical developments, global economic conditions, production levels, and shifts in worldwide energy demand.
There is no exact data, but current estimates suggest that known oil deposits will run out in 50–70 years. Technological development could extend this period by extracting hard-to-recover oil and improving refining methods.
The long-term outlook for oil remains uncertain. While continued demand could support prices in the coming years, the growing adoption of renewable energy, the expansion of electric vehicles, and increasingly stringent environmental policies may gradually constrain the market's long-term growth potential.
The content of this article reflects the author’s opinion and does not necessarily reflect the official position of LiteFinance broker. The material published on this page is provided for informational purposes only and should not be considered as the provision of investment advice for the purposes of Directive 2014/65/EU.
According to copyright law, this article is considered intellectual property, which includes a prohibition on copying and distributing it without consent.