This article provides a comprehensive review of the USDZAR currency pair with technical and fundamental analysis, long-term forecasts, expert opinions, as well as market sentiment assessment.
This overview will help traders and investors better grasp the pair's movement, identify potential entry points, and develop an effective trading strategy.
The article covers the following subjects:
- Major Takeaways
- USDZAR Real-Time Market Status
- USDZAR Price Forecast for 2026 Based on Technical Analysis
- Analysts' USDZAR Price Projections for 2027
- Analysts' USDZAR Price Projections for 2028
- Analysts' USDZAR Price Projections for 2029
- Analysts' USDZAR Price Projections for 2030
- Analysts' USDZAR Price Projections until 2050
- Market Sentiment of USDZAR on Social Media
- USDZAR Price History
- USDZAR Price Fundamental Analysis
- More Facts About USDZAR
- How We Make Forecasts
- Conclusion: Is USDZAR a Good Investment?
- USDZAR Price Prediction FAQs
Major Takeaways
- The current price of the USDZAR pair is R16.82030 as of 26.07.2026.
- The USDZAR pair reached its all-time high of R19.93023 on 09.04.2025. The pair's all-time low of R1.5715 was recorded on 31.08.2006.
- The USDZAR currency pair represents the ratio of the US dollar to the South African rand.
- The US dollar is the main reserve currency in the world, while the rand is the currency of an emerging economy.
- The USDZAR exchange rate is sensitive to fluctuations in commodity prices, particularly gold and platinum.
- The US Fed's policy and the South African Reserve Bank's actions significantly influence the currency pair's performance.
- The pair's volatility can increase sharply during economic instability or geopolitical changes.
- The USDZAR pair is a popular asset among short-term traders who rely on news-driven strategies.
- The pair is often used to hedge risks associated with financial operations in African countries.
USDZAR Real-Time Market Status
The USDZAR currency pair is trading at R16.82030 as of 26.07.2026.
When analyzing the USDZAR pair performance, it is essential to monitor key economic and technical indicators such as interest rates, inflation, volatility, and price change over the year. This data allows traders to make more informed decisions and evaluate the risks.
Indicator | Value |
South African interest rate | 6.75% |
US interest rate | 3.75% |
All-time low | R1.5715 |
All-time high | R19.93023 |
Price change over the last 12 months | -0.97% |
USDZAR Price Forecast for 2026 Based on Technical Analysis
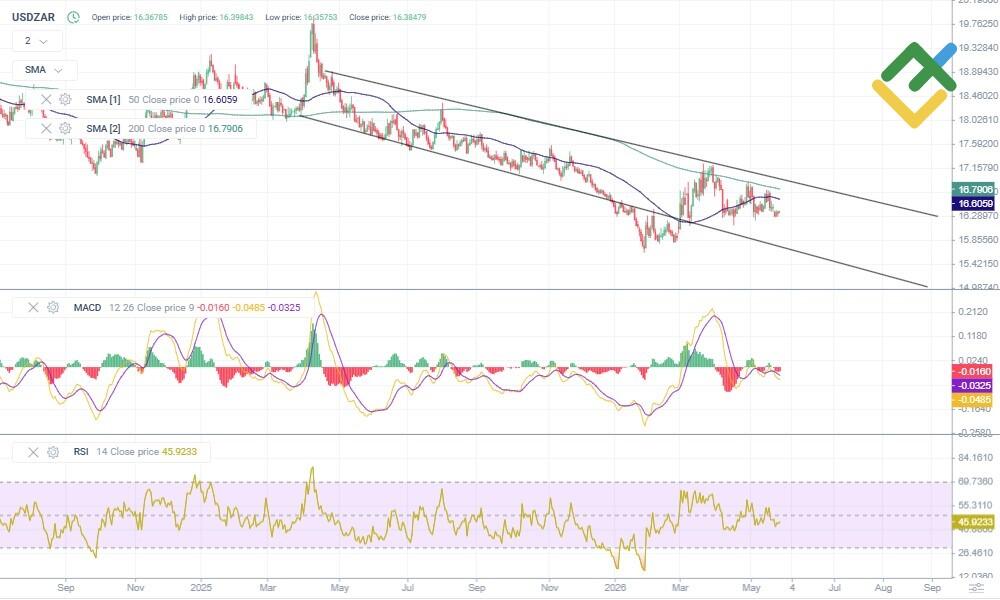
The USDZAR pair remains under pressure following a prolonged decline and is currently trading in the 16.35–16.40 range. Despite short-term rebounds, a clear upward reversal has not occurred yet.
The price is holding below the SMA200, while the SMA50 is staying around the current levels, indicating weak bullish momentum. The nearest resistance is in the 16.70–16.90 range, where selling pressure has intensified previously. The support level is around 15.80–16.00.
The MACD is moving sideways near the neutral zone, giving no clear signal, while the RSI is holding just below the middle of the range, reflecting cautious market sentiment. As long as USDZAR trades below the long-term resistance level, the outlook remains slightly negative, and the US dollar may continue to face downward pressure.
Below is USDZAR's 12-month price forecast:
Month | Minimum, R | Average, R | Maximum, R |
June 2026 | 15.90 | 16.30 | 16.80 |
July 2026 | 15.80 | 16.20 | 16.70 |
August 2026 | 15.70 | 16.10 | 16.60 |
September 2026 | 15.80 | 16.20 | 16.75 |
October 2026 | 15.90 | 16.30 | 16.85 |
November 2026 | 16.00 | 16.40 | 17.00 |
December 2026 | 16.10 | 16.50 | 17.10 |
January 2027 | 15.95 | 16.35 | 16.90 |
February 2027 | 16.00 | 16.45 | 17.05 |
March 2027 | 16.10 | 16.55 | 17.20 |
April 2027 | 16.20 | 16.65 | 17.30 |
May 2027 | 16.30 | 16.75 | 17.40 |
Long-Term Trading Plan for USDZAR for 2026
For now, buying USDZAR in 2026 looks more like an opportunity to buy on dips rather than expect a strong new uptrend. The key area to watch is 15.80–16.00. If the price stays above this support zone and starts showing signs of strength, it could move higher toward 16.70–17.00.
Opening long trades during sharp upturns looks risky, as the pair often corrects after such impulses. A more cautious approach is to wait until the price drops to the support level and then look for signals of a rebound.
Short trades can be considered when the price approaches the 16.80–17.00 zone, especially if the upward momentum begins to slow. Should the price fall below 15.80, the pressure on USDZAR may increase, potentially leading to a further decline.
Analysts' USDZAR Price Projections for 2026
Analysts predict that the USDZAR pair will drop in 2026 due to the expected weakening of the US dollar. The Fed's interest rate decisions and macroeconomic shifts in emerging markets could be the main factors influencing the price.
CoinCodex
Price range (ZAR): 15.05–16.43.
According to CoinCodex, the US dollar is expected to weaken against the South African rand in 2026. The currency pair will gradually decline from its June highs, averaging at 15.38 in August. Analysts predict that the exchange will dip to a low of 15.05 in December.
Month | Minimum, R | Average, R | Maximum, R |
June | 15.92 | 16.12 | 16.42 |
July | 15.16 | 15.47 | 15.90 |
August | 15.15 | 15.38 | 15.68 |
September | 15.29 | 16.04 | 16.43 |
October | 15.53 | 15.85 | 16.25 |
November | 15.58 | 15.77 | 16.07 |
December | 15.05 | 15.33 | 15.61 |
LongForecast
Price range (ZAR): 14.89–16.62.
LongForecast suggests a steady downtrend will develop in 2026. High volatility is expected. The pair is projected to hit a high of 16.62 in June, then slide to 15.54 in October and reach a low of 14.89 in December.
Month | Minimum, R | Average, R | Maximum, R |
June | 15.69 | 16.16 | 16.62 |
July | 15.69 | 15.94 | 16.19 |
August | 15.93 | 16.30 | 16.66 |
September | 15.96 | 16.20 | 16.44 |
October | 15.54 | 15.87 | 16.20 |
November | 15.08 | 15.43 | 15.78 |
December | 14.89 | 15.12 | 15.35 |
WalletInvestor
Price range (ZAR): 14.94–16.96.
WalletInvestor forecasts a steady decrease in the USDZAR pair. The price is expected to drop from its summer highs and reach 15.48 by early autumn. In December, the pair is estimated to plunge to a low of 14.94.
Month | Minimum, R | Average, R | Maximum, R |
June | 15.62 | 16.29 | 16.96 |
July | 15.62 | 16.16 | 16.69 |
August | 15.48 | 16.02 | 16.57 |
September | 15.48 | 15.89 | 16.30 |
October | 15.12 | 15.76 | 16.39 |
November | 15.23 | 15.62 | 16.01 |
December | 14.94 | 15.49 | 16.04 |
Analysts' USDZAR Price Projections for 2027
Forecasts for 2027 point to a further weakening of the US dollar against the rand. Domestic reforms in South Africa, as well as changes in the trade balance of emerging markets, may greatly influence the pair’s performance.
Note: The price ranges reflect the asset's expected volatility throughout the year. Lows and highs may not be shown in the summary tables.
CoinCodex
Price range (ZAR): 12.56–15.66.
According to CoinCodex, the downtrend will continue. The pair is expected to correct upwards early in the year, surpassing the 15.30 level in March. In November, the pair is predicted to reach a low of 12.56.
Quarter | Minimum, R | Average, R | Maximum, R |
Q1 | 14.32 | 14.91 | 15.66 |
Q2 | 13.69 | 14.80 | 15.50 |
Q3 | 12.59 | 13.35 | 14.09 |
Q4 | 12.56 | 13.21 | 13.79 |
LongForecast
Price range (ZAR): 13.71–15.40.
LongForecast anticipates the pair to face volatility and decline gradually. The price is likely to fall from its winter high of 15.40 and reach 13.86 in August.
Quarter | Minimum, R | Average, R | Maximum, R |
Q1 | 14.17 | 14.80 | 15.40 |
Q2 | 13.91 | 14.49 | 15.02 |
Q3 | 13.86 | 14.16 | 14.54 |
Q4 | 13.71 | 14.33 | 14.94 |
WalletInvestor
Price range (ZAR): 13.42–15.80.
According to WalletInvestor, the pair will trade in a sustained downtrend in 2027. The price is expected to slide steadily and break below the support level of 14.33 in May. In November, the asset is forecast to hit a low of 13.42.
Quarter | Minimum, R | Average, R | Maximum, R |
Q1 | 14.56 | 15.16 | 15.80 |
Q2 | 14.21 | 14.76 | 15.63 |
Q3 | 13.69 | 14.31 | 14.95 |
Q4 | 13.42 | 13.96 | 14.65 |
Analysts' USDZAR Price Projections for 2028
Analysts are divided on the outlook for the USDZAR exchange rate in 2028 due to uncertainty surrounding economic growth in emerging markets. Some experts predict a sideways trend with a sharp decline mid-year, while others forecast a moderate bearish trend.
CoinCodex
Price range (ZAR): 11.64–13.78.
According to CoinCodex, the currency pair will trade sideways in 2028 before rising. The price is expected to fluctuate within a narrow range during the first nine months, average at 12.50 in Q3, and hit a high of 13.78 in November.
Quarter | Minimum, R | Average, R | Maximum, R |
Q1 | 11.76 | 12.54 | 13.11 |
Q2 | 11.98 | 12.51 | 13.21 |
Q3 | 12.13 | 12.50 | 12.92 |
Q4 | 11.64 | 12.91 | 13.78 |
LongForecast
Price range (ZAR): 13.46–15.21.
LongForecast predicts that the US dollar will gradually weaken in 2028. The pair is likely to drop moderately in the first half of the year, reaching 13.74 in June. In August, the asset is projected to fall to a low of 13.46.
Quarter | Minimum, R | Average, R | Maximum, R |
Q1 | 14.04 | 14.59 | 15.21 |
Q2 | 13.74 | 14.03 | 14.60 |
Q3 | 13.46 | 13.85 | 14.24 |
Q4 | 13.69 | 14.10 | 14.54 |
Analysts' USDZAR Price Projections for 2029
Analysts predict the pair will show mixed movement in 2029, driven by global commodity cycles. A shift in investment flows in the African region may trigger a steep reversal, moving the pair from multi-year lows into a phase of steady growth.
CoinCodex
Price range (ZAR): 10.95–14.69.
CoinCodex predicts that the USDZAR pair will reverse upward in 2029. The exchange rate is expected to drop to 11.23 in March and then rise rapidly. Analysts forecast the price to hit a high of 14.69 in September.
Quarter | Minimum, R | Average, R | Maximum, R |
Q1 | 10.95 | 11.33 | 11.82 |
Q2 | 11.21 | 12.02 | 13.17 |
Q3 | 12.44 | 13.35 | 14.69 |
Q4 | 12.91 | 13.56 | 14.13 |
LongForecast
Price range (ZAR): 13.25–14.77.
According to LongForecast, the pair will move sideways in 2029, reaching 13.45 in June. The price is expected to reach a high of 14.77 in October.
Quarter | Minimum, R | Average, R | Maximum, R |
Q1 | 13.64 | 13.99 | 14.51 |
Q2 | 13.25 | 13.59 | 14.30 |
Q3 | 13.60 | 14.03 | 14.45 |
Q4 | 13.74 | 14.24 | 14.77 |
Analysts' USDZAR Price Projections for 2030
Forecasts for 2030 vary widely because of potential instability in the monetary policies of major global central banks. Some experts anticipate a significant increase in the US dollar, while others foresee a drastic depreciation.
CoinCodex
Price range (ZAR): 12.60–14.66.
According to CoinCodex, the pair will trade in a moderate bullish trend in 2030. The price is expected to start rising early in the year and reach 13.63 in Q2. The price is projected to peak at 14.66 in September.
Quarter | Minimum, R | Average, R | Maximum, R |
Q1 | 12.60 | 13.29 | 13.92 |
Q2 | 13.14 | 13.63 | 14.30 |
Q3 | 13.14 | 13.96 | 14.66 |
Q4 | 13.26 | 13.92 | 14.50 |
WalletInvestor
Price range (ZAR): 12.33–15.88.
WalletInvestor estimates that the pair will experience a sharp decline in 2030, reaching 13.51 in June. In December, the asset is predicted to reach a low of 12.33.
Quarter | Minimum, R | Average, R | Maximum, R |
Q1 | 13.67 | 14.81 | 15.88 |
Q2 | 12.88 | 13.61 | 14.50 |
Q3 | 12.55 | 13.11 | 13.93 |
Q4 | 12.33 | 13.00 | 13.76 |
Analysts' USDZAR Price Projections until 2050
Predicting the currency pair's performance over such a long period is beyond the scope of standard technical or fundamental analysis. Financial markets are influenced by a multitude of factors, so any long-term predictions are speculative.
In a few decades, the structure of the global economy may change completely. The US dollar may lose its status as the primary reserve asset, government digital currencies may be launched, and alternative trade alliances may emerge, potentially affecting prices. An important factor for South Africa will be the completion of the energy transition, which may radically transform global demand for the country's mineral resources.
South Africa's currency will also depend on demographics, political cycles, and the pace of new technology adoption in industry. For now, these factors seem pretty uncertain.
Calculating precise estimates for such a long period is not practical, as it does not account for potential economic crises and geopolitical upheavals. For this reason, financial analysts typically do not publish specific figures, sticking instead to general scenarios.
Market Sentiment of USDZAR on Social Media
Media sentiment helps gauge whether traders are gaining confidence in the current price trend or becoming more cautious. This is especially important for USDZAR, which is influenced not only by the US dollar but also by risk appetite, commodity markets, and gold prices. As a result, discussions on social media can quickly shape short-term market expectations.
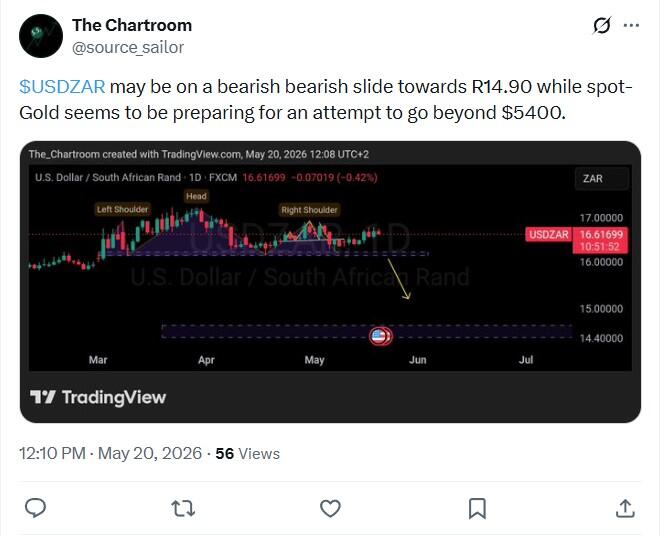
For example, X user @source_sailor maintains a bearish outlook on USDZAR, expecting the pair to extend its decline toward 14.90. The trader cites the emergence of a reversal pattern and notes that a potential increase in gold prices could strengthen the South African rand, thereby weighing on USDZAR.
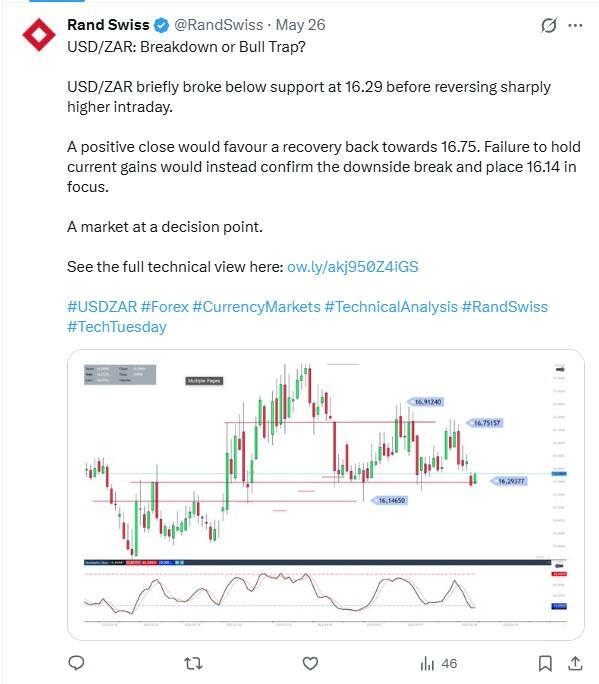
User @RandSwiss takes a more cautious view, believing the market is at a crossroads. The user suggests that if the USDZAR pair holds the current levels, it may recover to 16.75. However, if the asset breaks below the support level, the risk of a further drop will increase.
Overall, sentiment regarding USDZAR remains mixed. Some traders expect the pressure on the dollar to continue, while others anticipate a reversal following the recent decline in the pair.
USDZAR Price History
The USDZAR pair reached its all-time high of 19.93023 ZAR on 09.04.2025.
The all-time low of the USDZAR pair was recorded on 31.08.2006 when the price declined to 1.5715 ZAR.
It is crucial to evaluate historical data to make predictions as accurate as possible. The chart below shows the USDZAR pair performance over the last ten years.
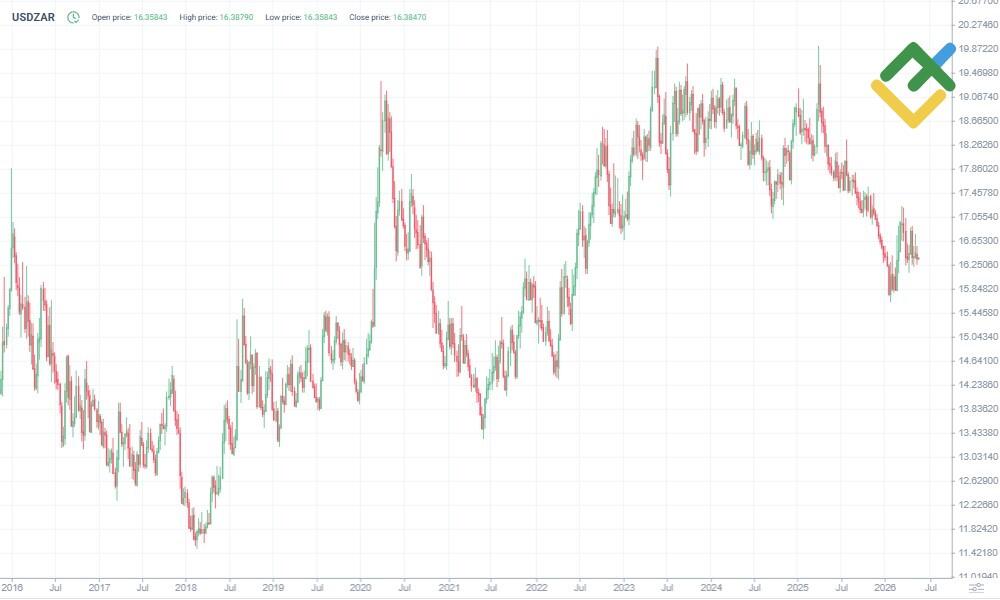
The USDZAR pair, representing the exchange rate between the US dollar and the South African rand, has a long trading history characterized by significant price fluctuations.
The exchange rate remained relatively stable in the 1980s. However, starting in the early 2000s, the rand began to weaken amid political instability and economic challenges in South Africa. By 2008, the global financial crisis triggered a sharp rise in the USDZAR pair, pushing it above the R11 mark.
Since 2015, the pair has exhibited increased volatility since it is highly vulnerable to changes in commodity prices, US Fed decisions, and political events in South Africa. In 2020, the rate exceeded R19 amid the COVID-19 pandemic. Since then, the pair has been trading in a wide range.
In 2020, the USDZAR price surged to R19.34 due to the COVID-19 pandemic. After that, it retreated to R15.02. From mid-2021 to mid-2023, the US dollar strengthened to R19.92, bolstered by global monetary policy tightening, the energy crisis, and geopolitical risks. Until the end of 2025, the USDZAR pair traded in a wide range between R19.92 and R17.03 amid high inflation, unemployment, and logistics disruptions.
So far in 2026, the USDZAR has traded in a wide range of 16.00–17.25. After a steep decline, the market has attempted to rebound several times. In Q2, the movement became more stable as selling pressure eased and the price entered a consolidation phase.
USDZAR Price Fundamental Analysis
Fundamental analysis is crucial for understanding the economic and political factors influencing the USDZAR currency pair. It aids in assessing risks, identifying market trends, and making informed trading decisions for short-term and long-term trading.
What Factors Affect the USDZAR Pair?
The USDZAR exchange rate is determined by a range of internal and external economic factors.
- Interest rates. The difference between the US Fed and the central bank of South Africa's rates affects capital flows and asset appeal.
- Commodity prices. South Africa depends on exports of platinum, gold, and other resources. Rising prices strengthen the rand while falling prices weaken it.
- Inflation. High inflation in South Africa undermines confidence in the currency and reduces its purchasing power.
- US economic data. Labor market, inflation, and GDP reports directly affect the value of the US dollar.
- Political stability. Internal problems in South Africa reduce investor interest in the rand.
- Investor's risk appetite. During global instability, the US dollar strengthens as a safe asset.
- Geopolitics and sanctions affect trade, investment, and capital inflows into South Africa.
More Facts About USDZAR
The USDZAR currency pair indicates the exchange rate between the US dollar and the South African rand, a currency introduced in 1961 when South Africa became a republic. This pair is actively traded on Forex and is known for its volatility. Its popularity is rooted in the rand's attractiveness as a commodity currency since the South African economy depends on the export of gold, platinum, and other resources.
Traders and investors utilize the USDZAR pair for speculation, hedging, and diversifying their portfolios. This currency pair is particularly responsive to global economic and political developments. Additionally, it often serves as an indicator of sentiment in emerging markets.
Advantages and Disadvantages of Investing in USDZAR
The USDZAR currency pair can become an attractive asset for both short-term traders and long-term investors. However, it is crucial to take into account its specific features.
Advantages
- High volatility allows traders to profit from short-term rate fluctuations.
- Macroeconomic data from South Africa and the US are published frequently, which simplifies making forecasts.
- Technical and fundamental analysis. The pair can be easily analyzed.
- Suitable for various strategies. It is used in speculation, hedging, and portfolio diversification.
- Dependence on commodity prices. The increase in gold and platinum prices strengthens the South African rand.
- Availability. Most Forex brokers provide access to trading this pair.
- Variety of trading sessions. The pair is actively traded during Asian, European, and US trading sessions.
- Risk indicator for emerging markets. The pair helps estimate investment sentiment in South Africa and other developing countries.
Disadvantages
- Increased risks. High volatility can lead to significant losses.
- Political instability in South Africa frequently triggers abrupt fluctuations in the exchange rate.
- Dependence on commodities. Falling metal prices are reflected in the value of the rand.
- Limited liquidity. Slippages can occur when trading volumes are low.
- Risks of currency regulation. Unexpected interventions of the South African Reserve Bank or the US Fed are possible.
- High inflation in South Africa may lead to a devaluation of the rand.
- The lack of analysis data. Expert forecasts regarding the South African economy are rarely published.
How We Make Forecasts
We use a comprehensive approach combining technical and fundamental analysis to predict the USDZAR pair's movement.
Short-term forecasts (up to 1 month) are based on technical indicators such as the RSI, MACD, and moving averages, as well as news releases and price patterns.
Medium-term forecasts (1–6 months) take into account macroeconomic data such as interest rates, inflation, GDP data, the trade balance, and political risks.
Long-term forecasts (6 months and more) focus on geopolitical stability, commodity market trends, central banks' forecasts, and global economic scenarios. Moreover, we analyze expert opinions, media sentiment, and historical volatility and use forecasting models from credible sources.
Conclusion: Is USDZAR a Good Investment?
USDZAR is generally more volatile than traditional assets. Long-term investments in the US dollar against the South African rand can be risky due to political uncertainty and economic instability in South Africa. Although the rand tends to depreciate over time, it can also strengthen sharply, as in 2020–2021. Such swings can lead to significant losses for those investing in the USDZAR pair.
It may be more prudent to invest in South African stocks or bonds through professionally managed funds, where risks are diversified. Therefore, the USDZAR pair is better suited to experienced traders who actively manage their positions rather than long-term passive investors.
USDZAR Price Prediction FAQs
The current price of the USDZAR pair is R16.82030 as of 26.07.2026.
Most analysts expect the rand to experience high volatility. The currency may strengthen in the short term thanks to economic reforms and South Africa's export revenues. However, some long-term forecasts predict a weakening of the rand due to possible domestic political problems and export restrictions.
Analysts predict that the US dollar will depreciate in 2026. The Fed's policy may put pressure on the exchange rate. Experts estimate that the pair will trade between 14.89 and 16.96.
Experts expect the pair to continue falling in 2027 amid domestic reforms in South Africa. The asset is expected to experience high volatility and gradually weaken. The pair is predicted to trade between 12.56 and 15.80.
Experts' predictions for 2030 vary widely. Some forecast a moderate rise in the US dollar, while others expect a more considerable drop. According to experts, the pair may trade between 12.33 and 15.88 during the year.
The main reasons for the decline are inflation, sluggish GDP growth, political risks, budget deficit, and dependence on commodity exports. The rand is vulnerable to global volatility. Thus, when the global economy deteriorates, investors shift capital to more stable currencies.
The weakness of the South African rand is attributed to economic instability in South Africa, high government spending, low investor confidence, and the country's dependence on commodities. Therefore, any turmoil in the global market quickly affects the rand.
The rand may strengthen if the South African economy recovers, exports increase, and investor confidence improves. However, for long-term appreciation, the country will need a stable political and economic landscape, along with a reduced reliance on commodity price fluctuations.
The USDZAR pair is highly volatile and sensitive to economic and geopolitical events. Thus, the price swings provide opportunities for speculative trading. Additionally, the pair's performance helps assess investment risks in developing countries.
The outlook is influenced by interest rates, economic reports, gold and platinum prices, and the US Fed and the South African Reserve Bank policies. Moreover, geopolitics, trade wars, commodity demand, and foreign capital inflows/outflows are crucial.
Yes, macroeconomic data releases, political elections, central bank decisions, and global crises can dramatically affect the exchange rate. Investors take these events into account when making forecasts, which impacts the liquidity and short-term volatility of the USDZAR pair.
Price chart of USDZAR in real time mode

The content of this article reflects the author’s opinion and does not necessarily reflect the official position of LiteFinance broker. The material published on this page is provided for informational purposes only and should not be considered as the provision of investment advice for the purposes of Directive 2014/65/EU.
According to copyright law, this article is considered intellectual property, which includes a prohibition on copying and distributing it without consent.