You open a EUR/USD chart and see 1.15203. The number tells you how many US dollars one euro can buy. It is the exchange rate, shaped every second by traders in London, New York, and Singapore. However, exchange rates show how currencies are priced against each other, not what those currencies can actually buy.
The two are not the same thing. The market rate reflects capital flows, interest rate differentials, geopolitics, and sometimes pure sentiment. The real value of a currency, what economists call purchasing power, is something else entirely. And when you compare the two, some currencies look dramatically mispriced.
This article examines the contrast between the two using the Big Mac Index. It includes the latest data for 2026, simple calculations you can replicate yourself, and insights for trading EUR/USD, USD/JPY, and USD/CNY.
The article covers the following subjects:
- Major Takeaways
- The Dollar Has Been Shrinking for a Long Time
- What the Big Mac Index Is and Where It Came From
- The Big Mac Index: How Much Is the Dollar Really Worth?
- How Much Is a Dollar Worth Where You Live, Using the Big Mac Index?
- Why This Matters for Traders
- What Does the US Dollar Exchange Rate Depend On?
- Exchange Rate Undervaluation and Overvaluation
- Cheap and Expensive Big Mac
- Conclusion
- US Dollar Value and Big Mac Index FAQ
Major Takeaways
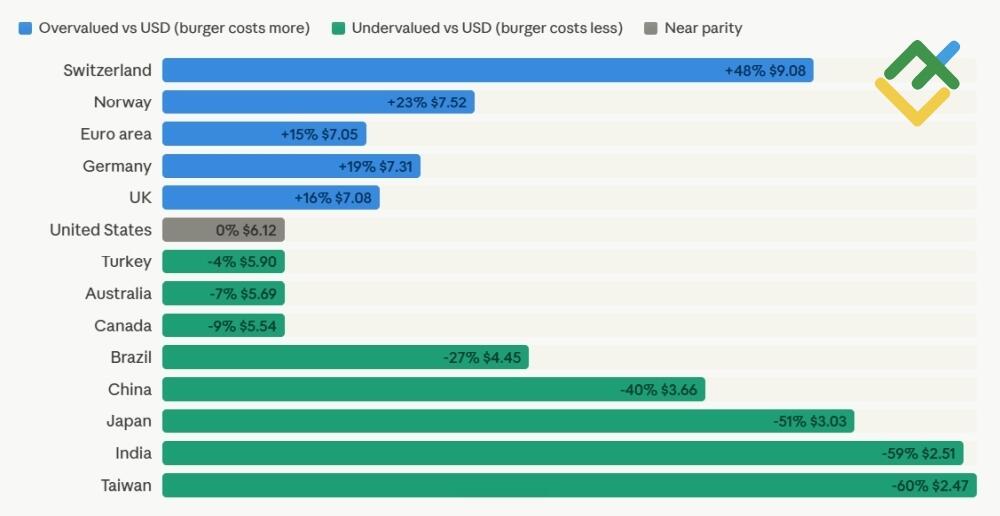
- A Big Mac costs $6.12 in the US, $7.05 in the euro area, and just $3.03 in Japan.
- The Big Mac Index is a simple way to gauge the true value of the US dollar by looking at the price of a single burger.
- If a currency appears cheaper based on the Big Mac Index than its actual market rate, it is considered undervalued.
- When forecasting exchange rates, it is not enough to rely solely on the Big Mac Index, as technical and fundamental analysis are essential.
The Dollar Has Been Shrinking for a Long Time
The dollar you hold today is not the dollar your grandfather held. Since 1913, it has lost roughly 97% of its purchasing power. The real turning point was 1971, when Nixon ended gold convertibility. Gold sat at $35 for decades, then hit $850 by 1980.
The move highlighted how much purchasing power the dollar had lost. From 1975 to 2025, $100 shrank to $16.40 in real terms. Every fiat currency inflates, but the dollar sets the pace for everyone else.
What the Big Mac Index Is and Where It Came From
In 1986, a writer at The Economist named Pam Woodall published a half-joking guide to exchange rates built around a single product: the McDonald's Big Mac. The idea was simple enough to explain over dinner, yet it turned out to have real analytical weight.
McDonald's runs one of the most tightly controlled supply chains on earth. The bun formula, the beef patty weight, and the cooking process are all standardized globally. A Big Mac in Warsaw is supposed to be identical to one in Osaka or Houston. If exchange rates were rational, it should cost the same everywhere once you convert to a common currency. That theory is called Purchasing Power Parity, or PPP.
The index gets taken seriously. It has been cited in IMF research and Federal Reserve working papers. The Economist updates the data twice a year, in January and July.
The Big Mac Index: How Much Is the Dollar Really Worth?
Many people ask the same question: how much is the dollar really worth? The official exchange rate is just a market price.
What a currency actually buys, its real purchasing power, can tell a very different story.
That's where the Big Mac Index comes in. "Burgernomics" does not claim to be an exact science, but the index has been a global reference point for nearly 40 years. The Economist publishes it twice a year, it appears in economics textbooks, and it has been the subject of genuine academic research.
How Much Is a Dollar Worth Where You Live, Using the Big Mac Index?
The math takes thirty seconds. Take the local price of a Big Mac in the foreign currency, divide by the US price in dollars, and you get the implied exchange rate.
In the Eurozone, a Big Mac costs €6.08, compared with $6.12 in the US, according to The Economist's data. Based on those prices, one euro should buy about $0.99. The market exchange rate, however, is 1.16, suggesting that the euro is trading about 17% above its Big Mac-implied fair value.
In Japan, a Big Mac costs ¥480, compared with $6.12 in the US. Implied rate: 480 / 6.12 = 78.4 yen per US dollar. The actual USD/JPY rate is currently around 145. This means the yen is undervalued by about 46% relative to its PPP-implied value.
In China, a Big Mac costs ¥25.5 (yuan). The US price is $6.12. Implied rate: 25.5 / 6.12 = 4.17 yuan per US dollar. Actual rate: about 7.2 yuan per dollar. The yuan is roughly 43% undervalued. Goods and services in China remain much cheaper in dollar terms than the exchange rate implies.
In Russia, the local equivalent of the Big Mac is the "Bolshoi Hit" sold by Vkusno i Tochka, the chain that replaced McDonald's. As of early 2026, it costs around 201 rubles. Dividing 201 by the US Big Mac price of $6.12 gives an implied exchange rate of 32.84 rubles per US dollar. With the market exchange rate near 81.30, the ruble appears undervalued by about 60% on a Big Mac basis.
Why This Matters for Traders
The Big Mac Index is not a trading signal. You cannot open a long JPY position in January and expect to be rich by December just because the yen looks 50% cheap. Currency mispricings can persist for years, sometimes decades. Japan's yen looked cheap in 2012, in 2015, in 2018, and in 2021. It got cheaper each time.
What the index does is give you context. When a currency is very undervalued by PPP standards, you're not taking a contrarian position from nowhere. You have a fundamental anchor. The question is always: what's holding the misalignment in place, and what could break it?
For the yen, the answer has been the Bank of Japan's yield curve control policy. That started unwinding in 2024. When the BOJ finally began raising rates, the yen snapped back sharply from 160 toward 140. The fundamental undervaluation was always there; what changed was the policy that was suppressing it.
For the euro, the Big Mac data says it is modestly overvalued right now. You can construct a case that EUR/USD belongs closer to 1.05 on pure purchasing power grounds. But with the dollar under structural pressure from US fiscal deficits, the de-dollarization debate, and tariff-related uncertainty, the market is choosing to price the euro at 1.16 anyway. The index flags the tension but doesn't resolve it.
The more useful application is cross-checking whether a currency move makes sense. If EUR/USD is at 1.30 in two years, that would represent a genuinely stretched overvaluation by Big Mac terms. If USD/JPY is at 170, the yen undervaluation would be extreme enough to make a contrarian bet look attractive at least structurally. The index gives you the guardrails.
What Does the US Dollar Exchange Rate Depend On?
Let's find out why the official dollar exchange rate differs so much from its value based on the Big Mac Index.
Macroeconomic factors, the Federal Reserve's policy, the trade balance, investment flows, and geopolitics all influence the value of the US dollar.
The US president is one of the most influential figures in the Forex market. Although Donald Trump's statements no longer surprise the market, his policies still have a strong impact on the dollar. Policies such as tax cuts and trade restrictions continue to support the US currency.
Investors often compare economic growth rates. If global GDP is growing faster than the US economy, largely due to China and other emerging markets, capital may flow to these markets. However, stronger US growth or higher Fed rates usually bolster the greenback. Trade wars, sanctions, and periods of uncertainty also strengthen the US dollar, as it is considered a safe-haven currency.
Moreover, higher US Treasury yields often attract investors from other countries, including Europe and Japan, where interest rates remain lower.
Exchange Rate Undervaluation and Overvaluation
Exchange rate fluctuations have a broad impact on the economy, although many people only notice them when traveling or shopping abroad. A stronger currency makes imports cheaper but can hurt exporters, while a weaker currency supports commodity exports and helps create jobs.
Key insights from the Big Mac Index 2026:
- The Japanese yen is one of the most undervalued currencies, estimated to be about 46–51% below its fair value. At times, Japan deliberately keeps the yen weak to boost exports.
- The euro is overvalued against the US dollar by about 15–17%.
- The Australian and Canadian dollars are undervalued by around 7–10%, as their exchange rates are closely tied to commodity prices such as gold, oil, and iron ore.
- The Swiss franc is traditionally overvalued and is currently about 48% above its fair value. The Norwegian and Swedish krona are also overvalued.
- The South African rand and the Russian ruble are among the world's most undervalued currencies. According to the Big Mac Index, the ruble is undervalued by about 60%.
When a currency moves too far from its fair value, it may reverse soon. However, the Big Mac Index is only a guideline rather than a definitive trading signal.
Cheap and Expensive Big Mac
Why is a burger so expensive in Switzerland (around $7.99)? High wages, expensive rent, and a harsh climate all push costs up. The cold weather increases heating expenses, while limited agricultural conditions make food production more costly and often dependent on imports. Similar factors are at play in Norway and Sweden.
In developing countries, prices are generally lower due to cheaper labor and the availability of locally produced goods. However, during periods of economic turmoil, such as Argentina’s 2001 crisis, burger prices can drop sharply as a result of currency devaluation.
In countries like Russia and Thailand, prices may appear similar in dollar terms, but purchasing power differs significantly. In Canada, a severe climate, high heating costs, and difficult farming conditions all contribute to higher prices.
Although the Big Mac Index does not provide a complete picture of a country’s economy, it is an excellent indicator of long-term imbalances in exchange rates.
Conclusion
Overall, the Big Mac Index can provide a rough indication of whether a currency is overvalued or undervalued. It is not a precise tool and should not be relied on alone when forecasting exchange rates or making trading decisions.
However, it can still be useful as a simple benchmark within a broader analysis. When combined with technical and fundamental factors, it may help traders better understand long-term currency trends.
P.S. Did you like my article? Share it in social networks: it will be the best "thank you" :)
Useful links:
- I recommend trying to trade with a reliable broker here. The system allows you to trade by yourself or copy successful traders from all across the globe.
- Use my promo code BLOG to get a 50% deposit bonus on the LiteFinance platform. Simply enter this code in the appropriate field when funding your trading account.
- Telegram chat for traders: https://t.me/litefinancebrokerchat. We are sharing the signals and trading experience.
- Telegram channel with high-quality analytics, Forex reviews, training articles, and other useful things for traders https://t.me/litefinance
US Dollar Value and Big Mac Index FAQ
According to the Fed, producing a single $1 bill costs about 4.1 cents ($0.041) in 2026, including expenses for paper, ink, labor, and other production costs. Despite this, its face value remains $1.
There are approximately $2.43 trillion in circulation, according to Federal Reserve data as of 2026. Roughly half is held outside the United States.
The dollar may decline due to the Fed's rate cuts, a growing budget deficit, trade wars, or a weakening US economy. However, it is currently strengthening as a safe-haven asset.
The Big Mac Index is an unconventional measure of purchasing power parity. It compares the price of a Big Mac across different countries to determine whether a currency is overvalued or undervalued.
The Big Mac is a standardized product with the same recipe and quality worldwide, making it a convenient benchmark for comparing the cost of labor, ingredients, and services across countries.
The market price of the euro as of 02.08.2026 is about $1.15203. The Big Mac Index implies the euro's fair value is closer to $0.99, based on the euro area burger price of €6.08 versus the US price of $6.12. That makes the euro roughly 15–17% overvalued by purchasing power standards at current market rates.
By the Big Mac Index, your dollar goes furthest in Taiwan ($2.47 per burger, 60% cheaper than in the US), India ($2.51, 59% cheaper), Indonesia ($2.52, 59% cheaper), and Egypt ($2.65, 57% cheaper). In Switzerland, your dollar buys the least in relative terms, at $9.08 per burger.
It is a long-run valuation tool, not a short-term signal. Currency mispricings by purchasing power standards can persist for years. The index is useful for understanding whether a currency is fundamentally cheap or expensive, not for timing an entry.
Price chart of EURUSD in real time mode
The content of this article reflects the author’s opinion and does not necessarily reflect the official position of LiteFinance broker. The material published on this page is provided for informational purposes only and should not be considered as the provision of investment advice for the purposes of Directive 2014/65/EU.
According to copyright law, this article is considered intellectual property, which includes a prohibition on copying and distributing it without consent.