The Upside Tasuki Gap is an intriguing candlestick chart formation that can signal potential trading opportunities for savvy investors. This distinctive pattern starts with a long green bullish candle that gaps above the previous candle's range, followed by a small red pullback candle. While not foolproof, when identified correctly, the Upside Tasuki Gap has shown potential to predict further upside moves.
In this guide, we’ll explore the psychology and strategy around trading the Upside Tasuki Gap’s emergence on the charts. When correctly validated against the current market climate, this candlestick signal clues observant participants into the prevalent bullish bias. By enhancing one’s ability to interpret the market’s personality through niche chart patterns, opportune trade entry and exit timing advantages come to fruition.
The article covers the following subjects:
What Is an Upside Tasuki Gap Pattern?
The Upside Tasuki Gap is a distinctive candlestick chart formation where a long green bullish candle gaps above the high of the previous candle, followed by a small red bearish candle that pulls back but does not fill or close the gap. This candlestick pattern caught the eye of savvy traders due to its potential for signaling a continuation of the prior uptrend once validated correctly.
Spotting upside tasuki gap patterns can tip traders off to trading opportunities as it suggests bullish momentum may persist. The psychology is that the underlying asset shows strong buying pressure by extended upwards in a long green candle, then some profit-taking causes a small pullback which does not negate the strength behind the move.
Upside Tasuki Gap Pattern Formation
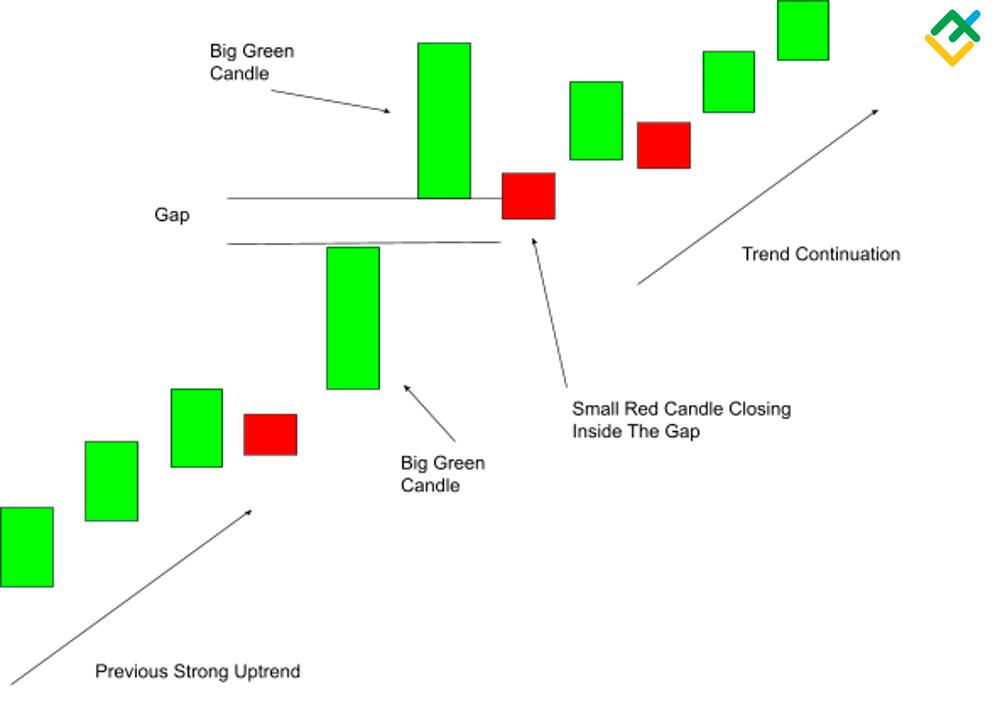
The structure of an upside tasuki gap candlestick pattern begins with a strong uptrend already underway. Then we see a long green bullish candle form which breaks above the high of the previous candle, leaving a visible gap between the closing price of the first candle and opening price of the upside tasuki gap candle. This shows strong buying momentum stepping in after a sustained upward trajectory.
Next, a comparatively small red bearish candle forms in the period following the tall green candle. This pullback candle slides back down, however it does not fully close or fill in the gap left behind on the chart by the preceding bullish candle. Seeing this small retracement hold above that gap reflects the market absorbing some selling pressure before buyers regain control to leave the existing bullish bias intact.
Traders can start anticipating this formation as the strong green candle takes shape then confirm once the small red candle respects that gap's boundaries without fully erasing it on the price chart.
How to Identify an Upside Tasuki Gap
First, check that a strong upwards price trend was firmly established before the potential gap appeared. Then scan for a long green bullish candle which breaks out above the high of the preceding candle, leaving a visible gap between their closing and opening prices. Next, observe if the following candle is a red bearish one which declines back down but does not manage to fill or fully close that gap up to the top of the green candle's range.
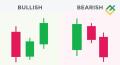
When seeing if an upside tasuki gap is valid, measure the size differential - that tall green candle should be much larger than the small red third candle that pulls back. Also visually inspect for the color contrast of green and red candles to confirm bullish and bearish nature on each side of the gap. Using the gap itself between these candles as the defining hallmark, it reflects a sudden burst of momentum which holds despite the subsequent minor bearishness.
If these criteria are met - existing uptrend, upside breakaway gap, sizable bullish then diminutive bearish candles on either side - then an upside tasuki gap pattern can be verified, signaling upside potential.
Upside Tasuki Gap Example
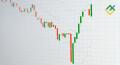
A real-world upside tasuki gap emerged on the EUR/USD 4-hour chart back in 2022 during the European trading session. According to the pattern, traders saw a strong established uptrend over several weeks with a series of higher highs and higher lows. Then suddenly a very large green bullish candle shoots upward, leaving a visible price gap from the top of the previous red candle's range.
In line with an upside tasuki gap formation, the next candle slides back down in red but only retraces around 50% before finding support above that gap zone. This small pullback candle validates the upside tasuki gap. Indeed, the major uptrend resumed in the following sessions just as the pattern foreshadowed. This showcases the formation's potential utility when confirmed accurately, with context of an existing bullish trend in the lead-up.
How to Trade Upside Tasuki Gap
When validated accurately, the upside tasuki gap candlestick formation offers savvy traders a signal to consider new bullish positions in alignment with the implied market psychology. There are a few key approaches to trading this pattern.
Entry Points
Target entry around the closing price of the small red pullback candle sitting above the gap left by the large green breakout candle. This reflects the buying momentum reasserting control after the minor retracement. Alternatively, wait for the next candle to confirm the uptrend resuming and enter early in its range.
Stop-Loss Placement
Consider placing stops just below the red pullback candle's low point. This accounts for invalidating the implied bullishness if price breaks back down filling that essential gap zone. Adjust wider for volatility tolerance or tighter to lock in potential gains.
Profit Taking
Plan upside price targets for closing out profitable upside tasuki gap trades. These can be set using external resistance levels, previous swing highs, or Fibonacci extensions projecting off the initial burst. Secure partial profits steadily as the trend plays out.
The psychology behind trading bullish candlestick patterns like the upside tasuki gap revolves around identifying and participating in renewed buyer dominance. While not universally foolproof across all market conditions, combining this visual technical signal with prudent entry and exit protocols can offer a valuable timing edge.
Pros and Cons of Using Upside Tasuki Gap Pattern
Here are the main pros and cons of incorporating the upside tasuki gap candlestick pattern into trading strategies.
Pros
- Acts as a visual signal of bullish continuation.
- Confirmation when requirements are fully met.
- Opportunity to enter existing upside trends.
- Stop-loss contains downside risk well.
Cons
- No guarantee; still probability based.
- Vulnerable to false breakdowns.
- Limited profit windows.
- Uptrend strength can fade fast.
The upside tasuki gap formation earns its reputation particularly through signaling the potential persistence of bullish momentum. While scoring an ideal validation presents advantage, traders weigh risk-reward scenarios on whether to act on these technical cues. Setups should emerge within existing upside trends for best viability.
The gap itself conveys market psychology while granting defined trade management. Yet bearish reversals, false breaks and volatility require quick reactions to prevent losses. With careful confirmation and discipline around using candlestick patterns like the upside tasuki gap, traders may take tactical advantage of high-probability continuation patterns.
Pros | Cons |
Acts as visual signal of bullish continuation | No guarantee; still probability based |
Confirmation when requirements fully met | Vulnerable to false breakdowns |
Opportunity to enter existing upside trends | Limited profit windows |
Stop-loss contains downside risk well | Uptrend strength can fade fast |
Conclusion
The Upside Tasuki Gap, a bullish continuation indicator, is evident when a large green candle gaps up significantly, followed by a small red candle, indicating strong buying pressure. This pattern, found in existing bull trends, aids investors in aligning with market dynamics, with the gap between the green and red candles being key.
Although no strategy guarantees success, this formation, combined with effective execution, can improve trading odds. The initial burst point sets the upside target, while the lower gap zone helps manage risk.
Traders seeking to time market entries or increase confidence in bullish positions find the Upside Tasuki Gap analysis useful. However, robust risk management is crucial to mitigate the risks of false signals and sudden market shifts. Embracing candlestick analysis as a lifelong learning journey, integrated with real-world experience, offers significant growth potential in trading.
Upside Tasuki Gap Pattern FAQs
The visible gap between candles represents a burst of upward momentum, reflecting resilient psychology that held through minor pullback.
When confirmed accurately, this formation signals further potential price gains, making it a useful indicator.
With its price breakout structure, the Upside Tasuki Gap conveys an intrinsically bullish bias existent in the market.
Its forecast power likely persists for days to weeks, but buyers must continually step back in or the trend may weaken.
Succeeding candle activity sees upside price swing continuation play out in alignment with the initial bullishness.
Yes, even reliable signals statistically lose potency over longer durations as market dynamics evolve.

The content of this article reflects the author’s opinion and does not necessarily reflect the official position of LiteFinance broker. The material published on this page is provided for informational purposes only and should not be considered as the provision of investment advice for the purposes of Directive 2014/65/EU.
According to copyright law, this article is considered intellectual property, which includes a prohibition on copying and distributing it without consent.