Technical analysis offers traders a wide range of tools for assessing market sentiment and forecasting price movements. One of these tools is the High Wave candlestick pattern. The High Wave pattern signals market uncertainty and a potential trend reversal.
In this guide, you'll learn what a High Wave candle is, how to identify it, and what it may indicate. We'll also cover trading strategies based on this pattern. By the end, you'll understand the key characteristics of the pattern and learn how to incorporate it into your trading while considering market context and risk management strategies.
The article covers the following subjects:
Major Takeaways
The High Wave candlestick pattern is characterized by long upper and lower shadows and a very small body. This structure reflects a high degree of market indecision and an intense struggle between buyers and sellers.
The pattern is easy to identify: the real body should be very small, while both shadows should be significantly longer than the body. The color of the body—bullish or bearish—is not decisive. What matters is the pronounced imbalance between the candle's price extremes.
The High Wave pattern signals a potential trend reversal. It indicates that neither buyers nor sellers have gained control of the market.
There is little difference between the bullish and bearish versions of the pattern. Market context is what matters most. When the pattern appears after an uptrend, it may signal a bearish reversal. When it forms after a downtrend, it may indicate a bullish reversal.
The High Wave pattern should be confirmed by other candlestick formations and technical indicators. It is generally best to enter a trade only after the next candle closes in the direction of the expected reversal. A stop-loss is typically placed beyond the extreme of the pattern's longer shadow. A take-profit target is commonly set at the nearest support or resistance level.
One drawback of the High Wave pattern is that it often generates false signals in low-volatility markets. Effective risk management includes using stop-loss orders, waiting for confirmation before entering a trade, and considering the overall market trend. The High Wave pattern tends to perform better on higher time frames and when combined with support and resistance levels.
What Is a High Wave Candlestick?
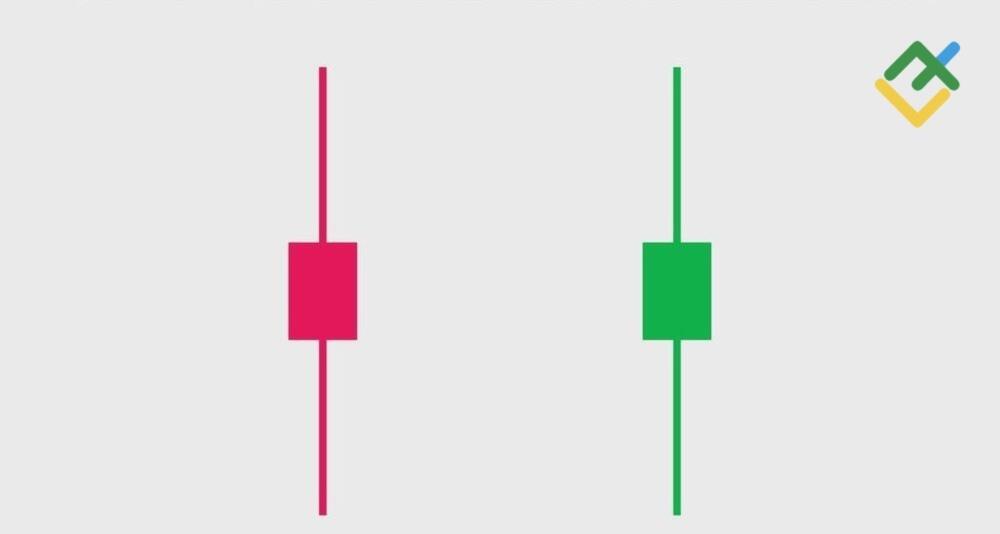
What is high wave candlestick? It is a Japanese candlestick pattern characterized by a very small body and long upper and lower shadows. The real body may be either bullish (green) or bearish (red), but it is significantly smaller than the long shadows.
A High Wave candle indicates that the price experienced substantial swings in both directions during the trading session but ultimately closed near its opening price.
The pattern resembles the Doji and the Spinning Top but features much longer shadows. The defining characteristic of a High Wave candle is that the opening and closing prices are very close, while the upper and lower shadows extend to extreme levels. The pattern forms when neither the buyers nor sellers can gain control of the market. This reflects high market volatility and intense competition between the two sides.
Visually, a High Wave candle resembles a thin vertical line with a tiny body in the middle. The small real body indicates that the opening and closing prices were nearly identical. The long wicks show that the price reached both significantly higher and lower levels during the session but failed to hold at either extreme.
In candlestick analysis, the High Wave pattern is regarded as a signal of market indecision. When traders spot a High Wave candle, they recognize that the current trend may be losing steam and that the market could be entering a consolidation phase or preparing for a reversal. On its own, however, the High Wave pattern does not indicate the direction of the next move. It simply reflects uncertainty among market participants.

How to Identify a High Wave Candle
To identify a High Wave candle, look for the following characteristics:
Small real body: The body should account for no more than 10–15% of the candle's range.
Long shadows: Both the upper and lower shadows should be several times longer than the real body.
The real body may be either bullish or bearish, but it should remain very small.
The distance between the high and the low should be significantly greater than the market's average volatility.
The pattern typically forms after a strong trend or near key support and resistance levels.
Market context is essential. When a High Wave pattern appears at the top of an uptrend, it may signal a bearish reversal. When it forms at the bottom of a downward trend, it may indicate a bullish reversal. In a sideways market, however, the pattern is generally less reliable.
Experienced traders also pay close attention to trading volume. Higher volume during the formation of a High Wave candle strengthens the signal. If the pattern is accompanied by unusually high trading volume, it suggests strong participation by institutional investors and increases the likelihood of a reversal.
The High Wave candle may resemble both the Doji and the Spinning Top, but it differs in how the real body relates to the shadows. A Spinning Top has a slightly larger real body and shorter shadows, while a Doji has virtually no real body because the opening and closing prices are nearly identical. The High Wave pattern falls somewhere between these two candlestick patterns.
What Does a High Wave Candlestick Tell You?
The High Wave pattern, also known as the High Wave candle, primarily signals market indecision. The market is unable to establish a clear direction, and the battle between buyers and sellers reaches a critical point. The High Wave pattern suggests that the prevailing trend may be losing momentum.
Key signals include:
Market indecision. The opening and closing prices are nearly identical, indicating a balance between buying and selling pressure.
A potential reversal. After a strong trend, the High Wave pattern often signals a potential reversal.
High volatility. The long shadows show that the price tested both support and resistance levels but failed to hold at either.
A consolidation phase. When the pattern appears during sideways movement, it may indicate that the consolidation is likely to continue.
The High Wave pattern does not provide a clear trading signal. Instead, it serves as a warning that market conditions may be changing. For this reason, it is best used in combination with other technical indicators and support and resistance levels.
Market conditions also influence how the pattern should be interpreted. During periods of low volatility, ordinary candlesticks may resemble High Wave candles due to limited price movement. Therefore, traders should compare the candle's range with the market's average volatility over the previous 10–20 trading sessions.
Bullish vs Bearish High Wave Candlestick
Although the High Wave pattern is not inherently bullish or bearish, candlestick analysis distinguishes between two variations based on the prevailing market trend. The difference lies not in the color of the real body but in the preceding price action.
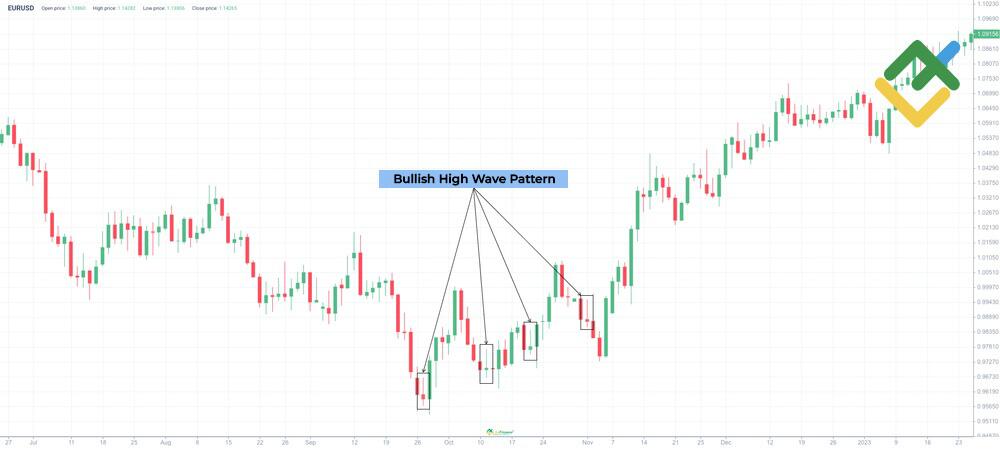
Bullish High Wave Pattern:
Forms at the end of a downtrend.
After a prolonged decline, the High Wave candle pattern suggests that sellers are losing momentum.
The long upper shadow indicates that buyers attempted to push the price higher.
May signal a potential bullish reversal.
Confirmation requires a bullish candle accompanied by higher trading volume.
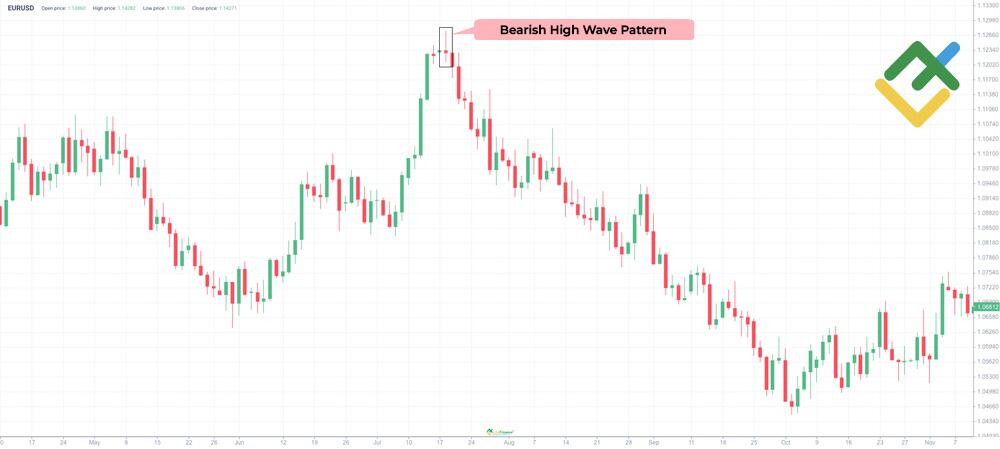
Bearish High Wave Pattern:
Forms at the top of an uptrend.
After a prolonged advance, the High Wave candle suggests that buyers are losing momentum.
The long lower shadow reflects strong selling pressure.
May signal a potential bearish reversal.
The signal is confirmed by the next bearish candle.
Thus, the High Wave pattern becomes bullish or bearish only in the context of the preceding trend.
How to Trade the High Wave Candlestick Pattern
Trading the High Wave candlestick pattern requires discipline and a well-defined trading plan.
Trading strategies based on this pattern may incorporate moving averages to determine the prevailing market trend. For example, if a High Wave pattern forms above the 200-period moving average while the RSI indicates overbought conditions, the bearish signal becomes stronger. The opposite applies to a bullish setup.
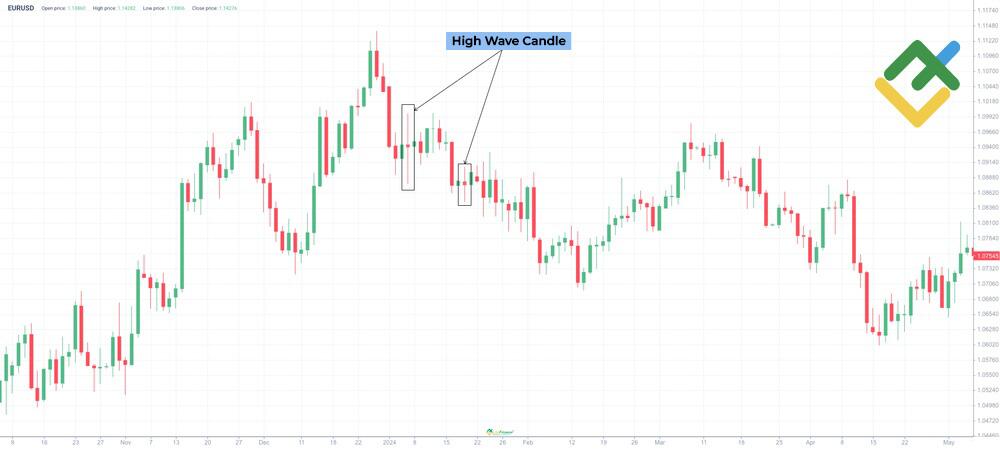
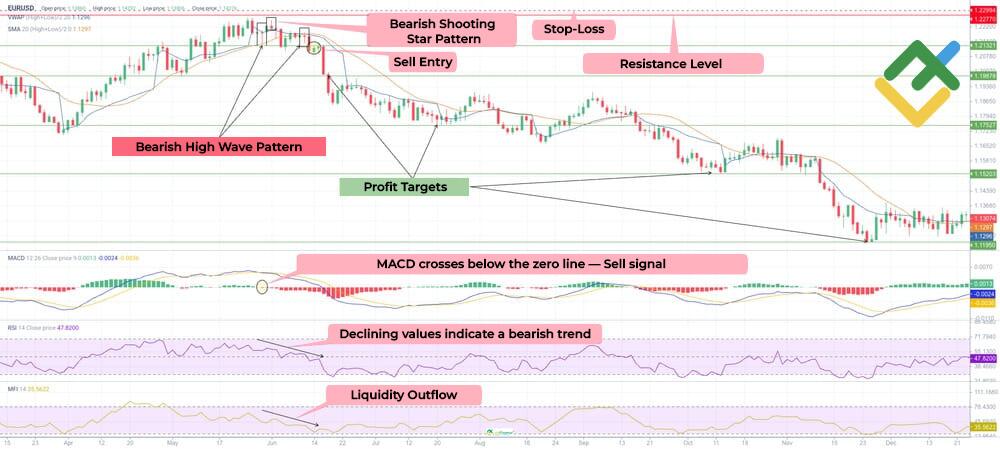
Let's look at an example of a trading strategy on the EUR/USD daily chart.
Trading strategy:
Determine the trend context. Identify key support and resistance levels on the chart. In this example, the market is consolidating near local highs.
Look for the signal. A High Wave candle with long shadows and a small real body forms on the chart. Make sure the pattern appears near a significant support or resistance level. In our example, this condition is met.
Wait for confirmation. Don't enter a trade immediately after the High Wave candle forms. Instead, wait for confirmation from multiple technical indicators. In the example above, the MACD crosses below the zero line. The RSI starts to decline, indicating increasing selling pressure. The Money Flow Index (MFI) points to capital outflows, reinforcing the bearish outlook. The price trades below both the VWAP and the 20-period SMA, giving sellers the upper hand. Additional confirmation comes from a Shooting Star pattern followed by another High Wave candle.
Trade entry: After the second candle, a bearish impulse candle formed, providing a signal to open a short position. The entry is placed below the low of the High Wave candle following the bearish candle.
Stop-Loss: For a short position, the stop-loss is typically placed above the High Wave candle's high. In this example, it is positioned above the resistance level at 1.2277.
Take-Profit: Support and resistance levels are used as profit targets. The minimum recommended risk-to-reward ratio is 1:2. A trailing stop may also be used to protect profits.
Important Considerations:
The High Wave pattern generally performs best on higher time frames, such as H1, H4, and the daily chart.
On lower time frames, it tends to generate more false signals.
Limitations and Risk Management
Limitations of the High Wave Pattern:
False signals: Up to 40% of High Wave patterns do not result in a trend reversal.
The pattern is less reliable in sideways markets and during consolidation phases.
Waiting for confirmation delays trade entries.
Potential misinterpretation: During periods of low volatility, ordinary candles may resemble High Wave patterns.
The pattern is generally unreliable during major economic releases and high-impact news events.
Time frame dependence: Lower time frames contain more market noise.
Risk Management:
Always use a stop-loss, even when the signal appears strong.
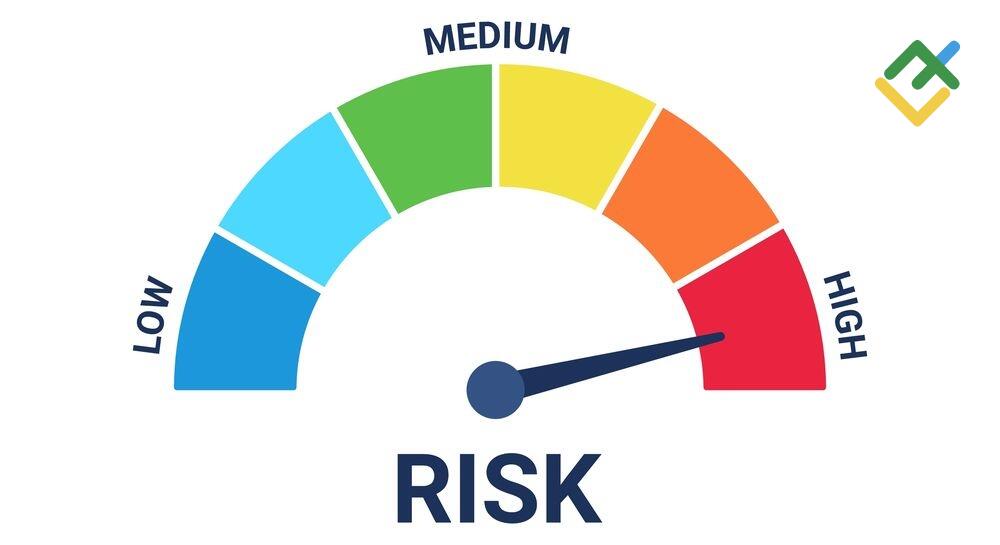
Risk no more than 1–2% of your trading capital on a single position.
Use support and resistance levels to determine appropriate stop-loss placement.
Assess overall market conditions before entering a trade.
Consider the pattern's historical performance on the specific asset you are trading.
Do not average down on losing positions.
Consider taking partial profits as price reaches key targets.
Keep a trading journal to review completed trades.
Conclusion
The High Wave candle is a valuable tool for traders. It helps identify periods of market indecision and potential trend reversals. However, it should always be used within the proper market context and with sound risk management. The best results are achieved by combining candlestick analysis with technical indicators and volume analysis.
Remember, the High Wave candle is a warning—not a trading signal in itself. Trade with discipline, use support and resistance levels, and always manage your risk. When interpreted correctly, the High Wave pattern can become a reliable addition to your trading toolkit.
Open a free account with LiteFinance and start using the High Wave candlestick pattern in your trading!
FAQs
A Spinning Top has a larger real body (15–30% of the candle's range). A High Wave candle has a smaller real body, usually less than 10% of the range. The shadows of a High Wave candle are also more pronounced. A Spinning Top signals moderate market indecision, while a High Wave candle reflects a tug of war between buyers and sellers.
By itself, the High Wave candle is neither bullish nor bearish. It is considered bullish when it forms at the end of a downtrend, signaling a potential upward reversal, and bearish when it appears at the top of an uptrend, indicating a possible downward reversal. The direction of the signal depends on the prevailing trend and confirmation from the following candlestick.
The content of this article reflects the author’s opinion and does not necessarily reflect the official position of LiteFinance broker. The material published on this page is provided for informational purposes only and should not be considered as the provision of investment advice for the purposes of Directive 2014/65/EU.
According to copyright law, this article is considered intellectual property, which includes a prohibition on copying and distributing it without consent.