In this article, you will learn about the Japanese Marubozu candlestick and what signals it gives to buyers and sellers.
Stemming from a Japanese word meaning 'bald,' these candlesticks, devoid of wicks, offer a stark depiction of market momentum.
This pattern is similar to Japanese candlesticks such as bullish or bearish counterattack and belt hold. They all have a large real body that has short or no shadows.
After studying the article, you will be able to identify this figure on the chart and apply it in trading.
The article covers the following subjects:
- What Is Marubozu Candle?
- How to Identify the Marubozu Candlestick Pattern
- Confirmation of Marubozu Candlestick Pattern
- Should You Trust the Marubozu Pattern?
- How to Trade Marubozu Candlestick Pattern
- Marubozu signals and setting stop-loss
- Pattern Examples
- Marubozu and Engulfing Pattern
- Marubozu Candlestick Pattern Limitations
- Conclusion
- Marubozu Candlestick FAQs
What Is Marubozu Candle?
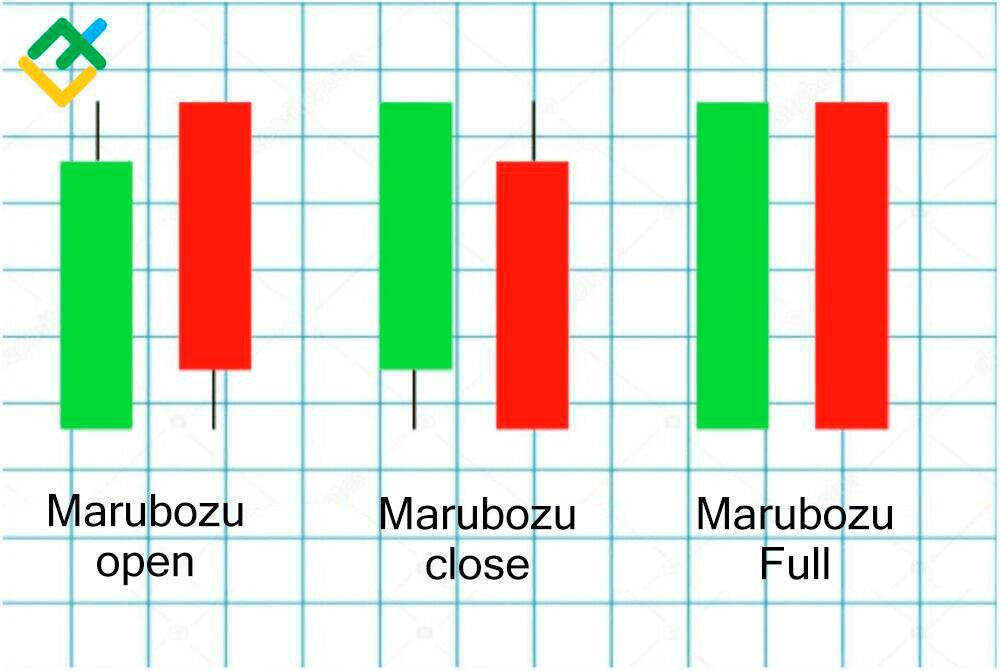
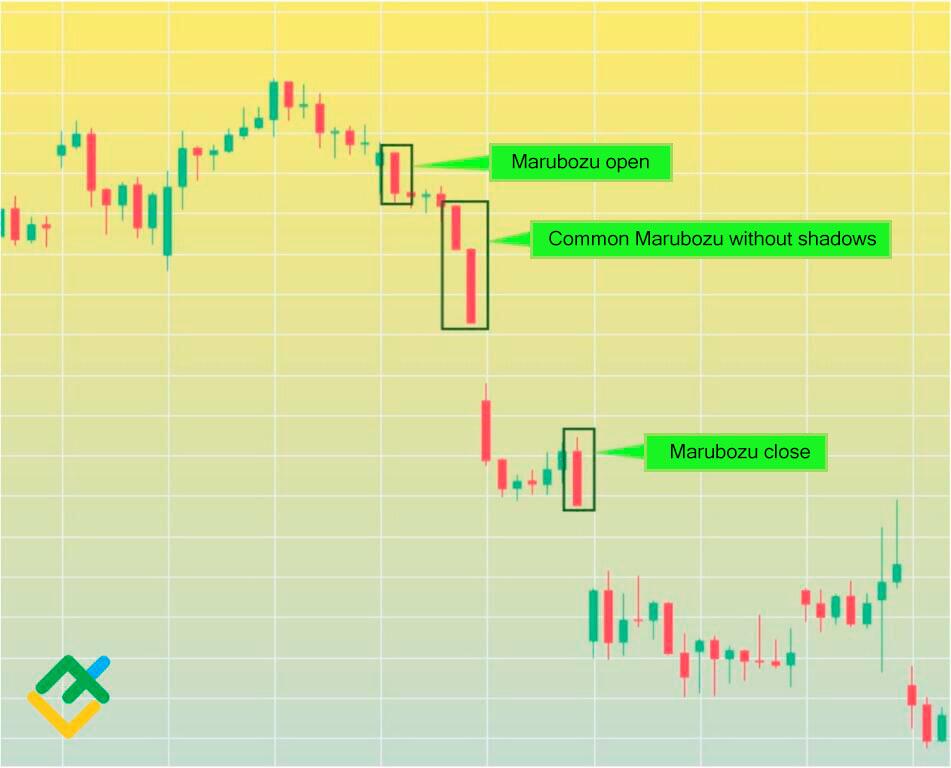
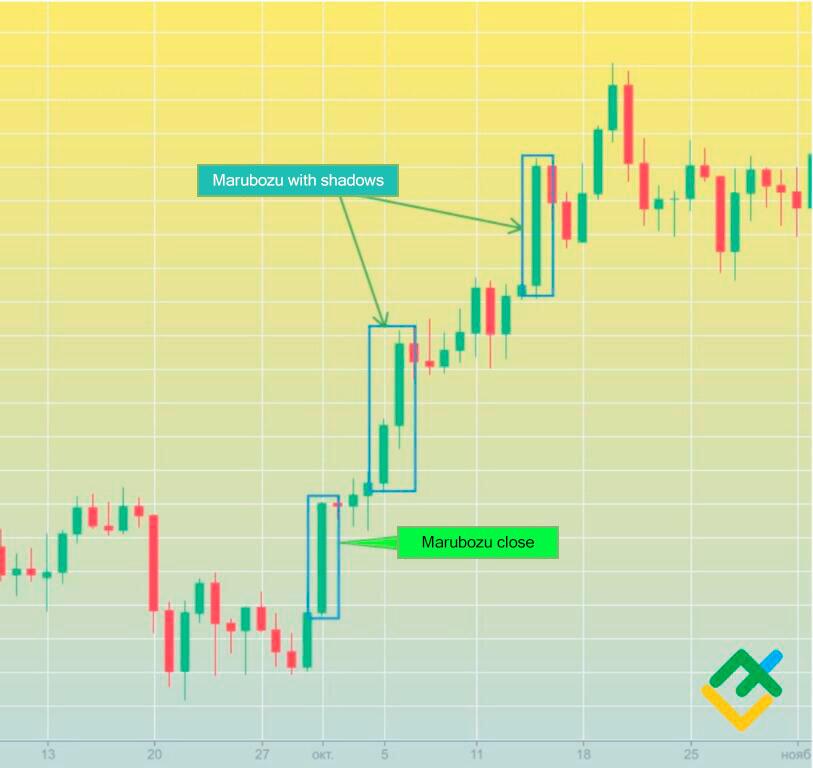
The Marubozu pattern is a long candle with a large body, with no or very short shadows. There are three types of Marubozu candlesticks on price charts:
Marubozu open candle has a full body with no shadow on the side of the opening price and a small shadow on the side of the closing price.
Marubozu close candle has no shadow on the closing price side and has a small wick on the opening price side.
- Marubozu full candle has only a body and no shadows.
How to Identify the Marubozu Candlestick Pattern
Identifying the Marubozu candle pattern on a chart is straightforward yet crucial for any trader. This pattern is defined by a solid, long candlestick body with little to no wicks, highlighting an intense trading session. To spot a Marubozu pattern, focus on the opening and closing prices of the candle. A Marubozu forms when these prices are very close to the session's high or low price, indicating a dominant market direction without significant retracement.
The candle range is another vital aspect. The longer the body, the more significant the buying or selling pressure during that period. Traders often use technical indicators to confirm the pattern's strength and potential impact. A Marubozu candle pattern signals a robust market sentiment, either bullish or bearish, and understanding this can be pivotal in refining your trading strategies.

Bullish Marubozu
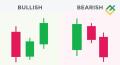
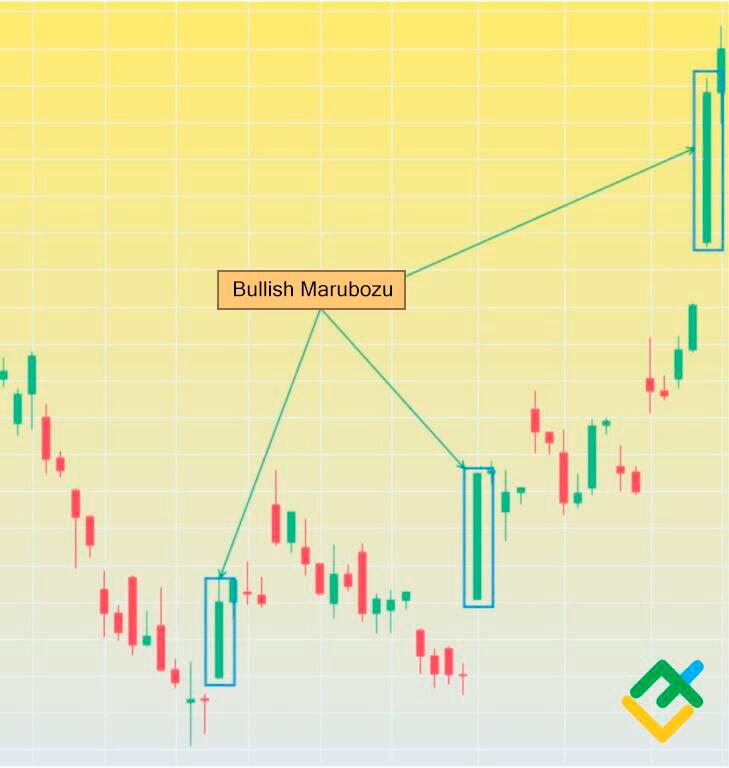
A bullish Marubozu is a white (or green) candlestick with a large body that has no or very small shadows.
The appearance of this pattern on the price chart means that buyers control the market, and the uptrend is likely to continue. This candlestick is also called the white Marubozu candle.
Bearish Marubozu
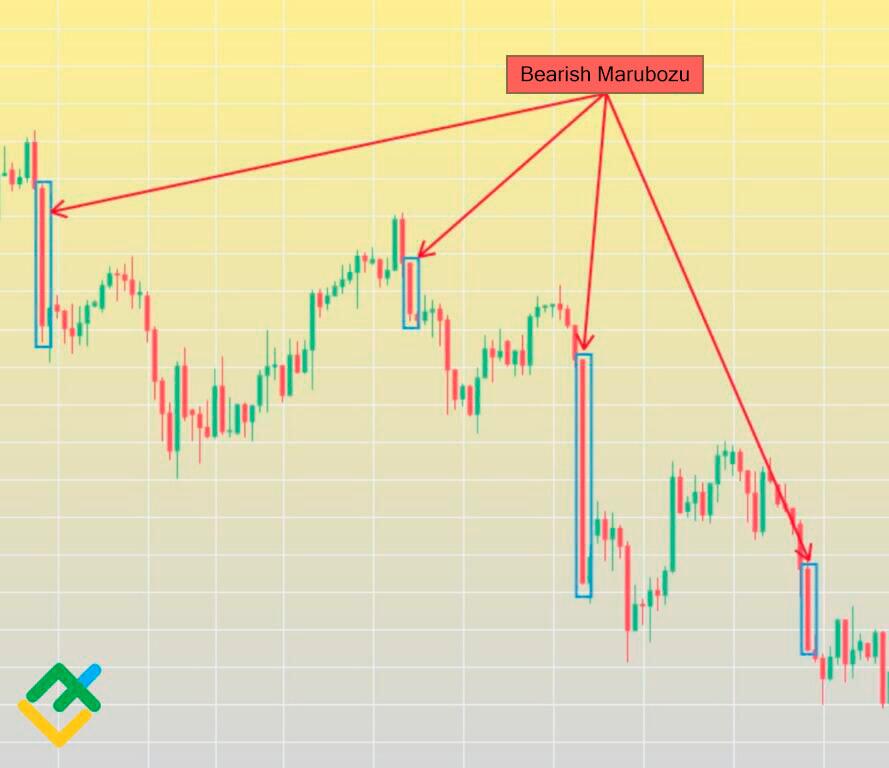
The bearish candlesticks candle is similar to the bullish Marubozu. It has the same long body and no shadows. The only difference is the color of the candlestick. It can be red or black.
Experienced traders call this pattern the black Marubozu candle. It indicates the continuation of the downtrend.
Opening Marubozu Candle
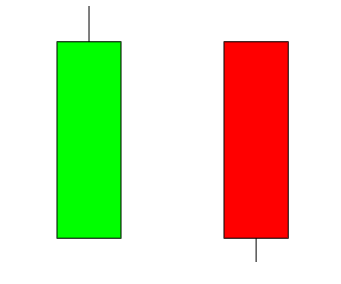
The Opening Marubozu candle is a unique and insightful pattern in the realm of trading, revealing significant market movements right from the trading session's start. Characterized by its opening price being the low (for bullish) or high (for bearish) of the session, this candle indicates a strong trend from the outset.
The essence of the Opening Marubozu pattern lies in its ability to capture moments when the price breaks sharply in one direction as the session opens. This is often a tell-tale sign of a solid and decisive market sentiment. While this pattern is rare, its appearance is a clear signal to traders, suggesting a robust momentum that could set the tone for the entire trading session.
Recognizing an Opening Marubozu gives traders an early insight into a potential market direction, which is crucial for making informed decisions in the fast-paced trading environment.
Closing Marubozu Candle
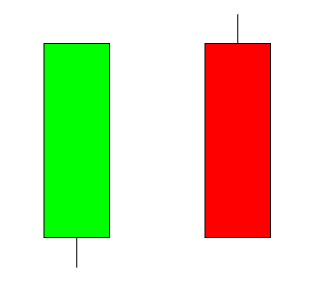
The Closing Marubozu pattern is characterized by its closing price being the high (for bullish) or low (for bearish) of the session, signaling a solid sentiment carried right through to the close. Its distinct feature is the absence of a wick at the closing end, highlighting the persistence of a particular trend throughout the session.
A Closing Marubozu, especially after a prolonged trend, can indicate a potential future direction, often hinting at trend continuation or preparing traders for a possible trend reversal.
Get access to a demo account on an easy-to-use Forex platform without registration
Confirmation of Marubozu Candlestick Pattern
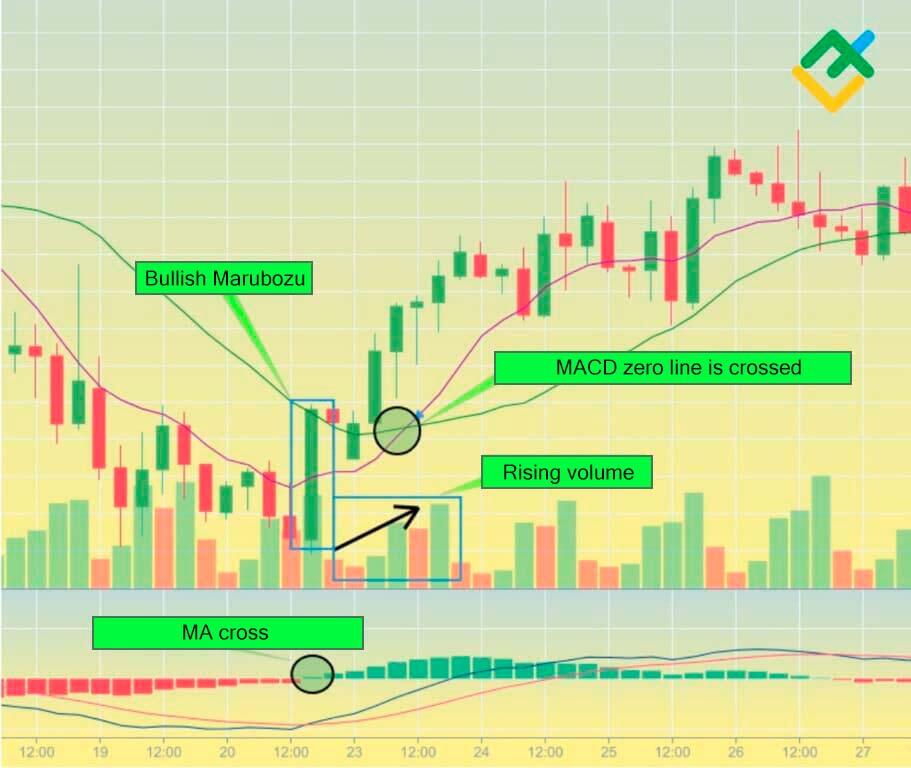
As a rule, the “Marubozu brothers” are formed on increased trading volumes. Therefore, to identify Marubozu, add a volume indicator, MA Cross tool, and MACD to the chart.
The crossing of the zero zone by MACD and moving averages serves as an additional confirmation of the Marubozu candlestick. Therefore, it is profitable to open a buy or a sell trade at the intersection of these indicators.
Other stronger reversal candlestick patterns, such as bullish hammer, hanging man, inverted hammer, and others, can serve as additional confirmation of the Marubozu candle's appearance at the bottom or at the top.
You can learn more about how to read a candlestick chart in this article.
Should You Trust the Marubozu Pattern?
There are many tools for technical market analysis, including candlestick patterns. However, you should not completely trust patterns and indicators, as they only indicate a possible outcome but do not guarantee it.
Tips for trading on the candlestick chart, including the Marubozu pattern:
do not trade against the trend; open trades in the direction of its movement;
set stop losses and follow risk management rules with the risk-reward ratio of 1:3;
trade candlestick patterns entered at levels;
study the peculiarities of a traded instrument, as some of them may ignore the levels.
How to Trade Marubozu Candlestick Pattern
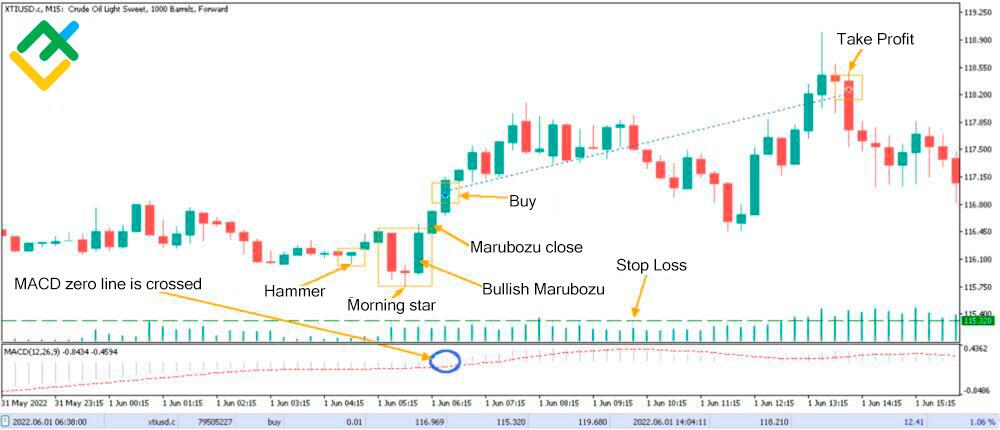
The principle of trading Marubozu candlesticks and other candlestick patterns is the same. Let's take USCrude as an example.
The 15-minute chart shows the formation of a bullish Marubozu pattern as part of the morning star reversal pattern. Before that, a hammer reversal pattern was formed, which warned traders that prices were ready to rise and the asset reached a local bottom.
The combination of these patterns served as the first signal for the bulls. Then another closed Marubozu candle was formed. At this point, according to the MACD technical indicator, there is an upward crossing of the zero line. This factor finally confirmed the local uptrend.
After careful analysis, I decided to open a minimum long trade of 0.01 lots. Stop-loss was set at 115.320. Some time later, the trade was closed intraday with a profit of $12.41.
How to Trade the Bullish Marubozu
Algorithm for trading bullish white Marubozu:
look for a bullish Marubozu candle in the zone of low prices after a downtrend, or in an uptrend when the resistance level is broken out;
enter purchases after a short-term downward correction or during a further price growth above the maximum price of the Marubozu candle;
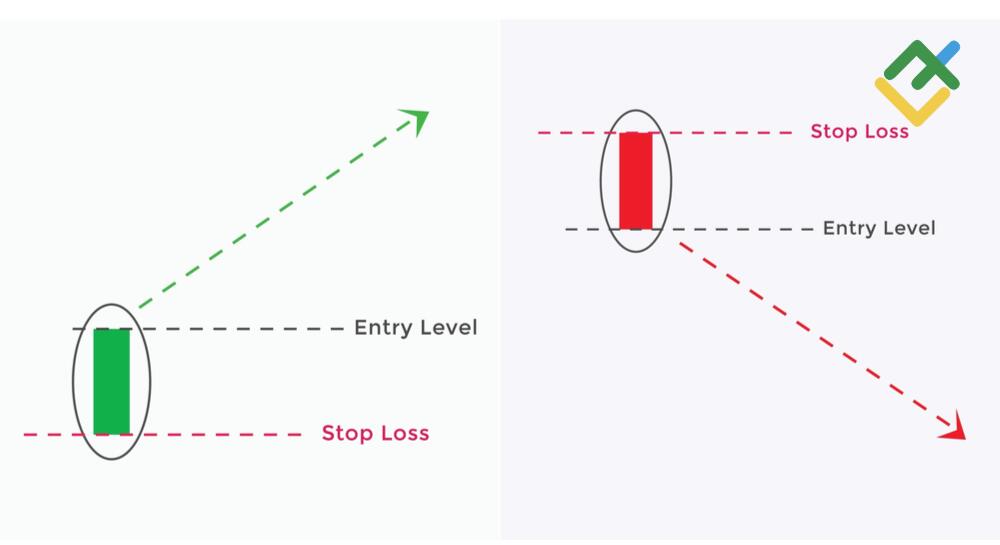
set a stop loss slightly below the minimum price of the Marubozu candle pattern;
place take profit orders at the nearest strong resistance level, in case of a price reversal.
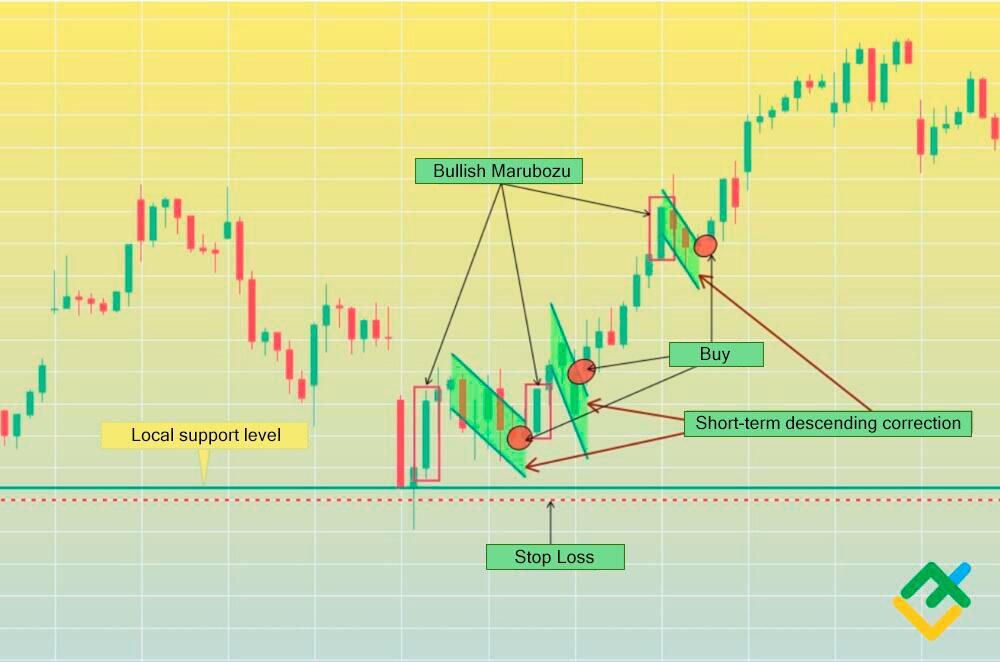
When a bullish Marubozu pattern forms on the daily or 4-hour stock charts, traders may enter long on the next candle open with a stop below the low of the Marubozu candle body. The lack of an upper wick shows minimal profit-taking during the move higher, indicating continuation is likely. Ride the upside while subsequent candles close near their high with small or no wicks on top.
How to Trade the Bearish Marubozu
The algorithm for trading the bearish candle pattern is the opposite of the bullish Marubozu pattern:
the pattern is formed in a bullish trend after reaching a strong resistance level in the zone of high prices, or in a downtrend when the support level is broken;
it is possible to open a short trade after a short upward correction or below the low of the candlestick pattern;
set stop loss just above the high of the Marubozu bearishcandlestick;
take profits when a support level is reached or when signs of a reversal appear.
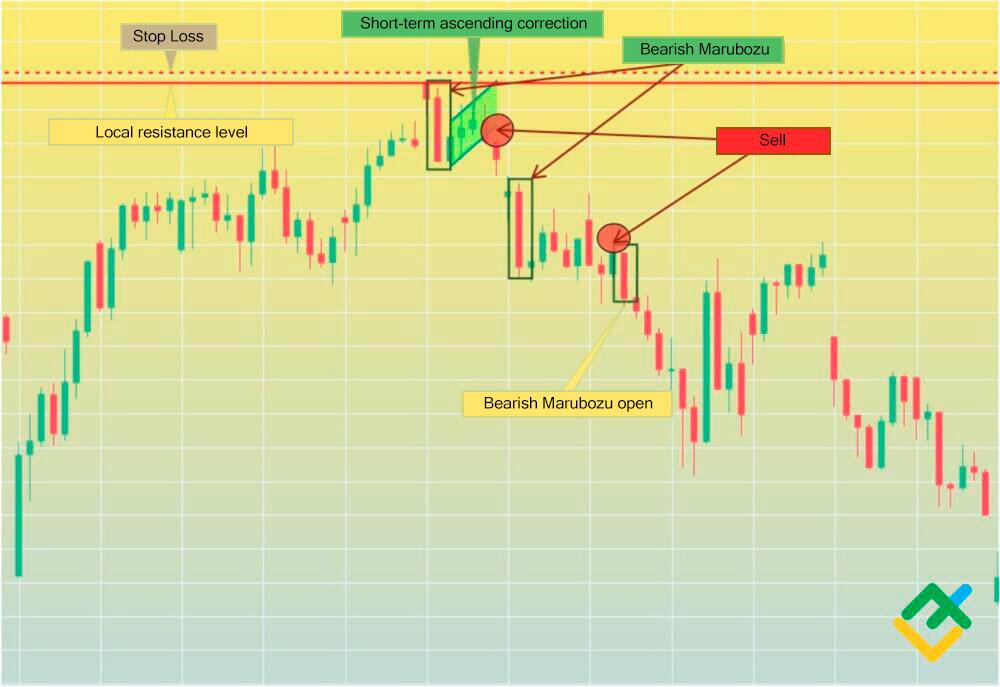
Use chart time frames like hourly or 4-hour charts to confirm the emerging bearishness in trading sessions. The lack of a lower wick shows minimal dip buying, signaling likely continuation lower from the opening and closing prices.
Marubozu signals and setting stop-loss
A buy or sell trade is opened after the Marubozu candle pattern is confirmed by technical indicators or other candlestick patterns.
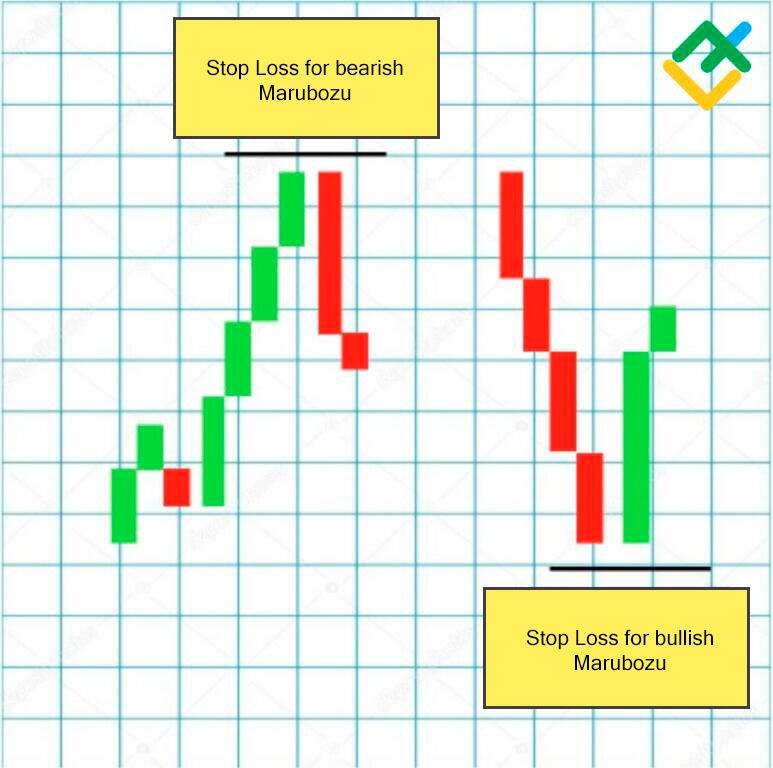
When a bearish Marubozu appears, set the stop loss slightly above the high of the long red candlestick. If a bullish Marubozu appears in the chart, set the stop loss just below the green candle's low.
Pattern Examples
There are three different types of Marubozu candles. The pattern appears in any financial markets, such as securities, currency, cryptocurrency, and commodity markets.
Below is an example of a Marubozu pattern on an Apple stock chart. After the appearance of a black open bozu, one of the types of Marubozu pattern, the asset rapidly declined, overcoming local support levels and forming other black Marubozu patterns.
A bearish open Marubozu candle indicates strong pressure by sellers on the price from above. As a result, the asset declines, where the bulls' stop losses are triggered. This makes the bears even stronger.
The bullish Marubozu patterns on the BTCUSD chart are shown below.
The daily chart shows that the asset continues to rise after a bullish Marubozu closing pattern appears. A long white Marubozu closing pattern warned traders of an impending bullish rally and price growth.
Marubozu and Engulfing Pattern
The Marubozu and engulfing patterns are two of the most popular candlestick chart formations used in technical analysis of financial markets. These Japanese candlestick patterns can identify potential trend reversals and continuation signals for traders.
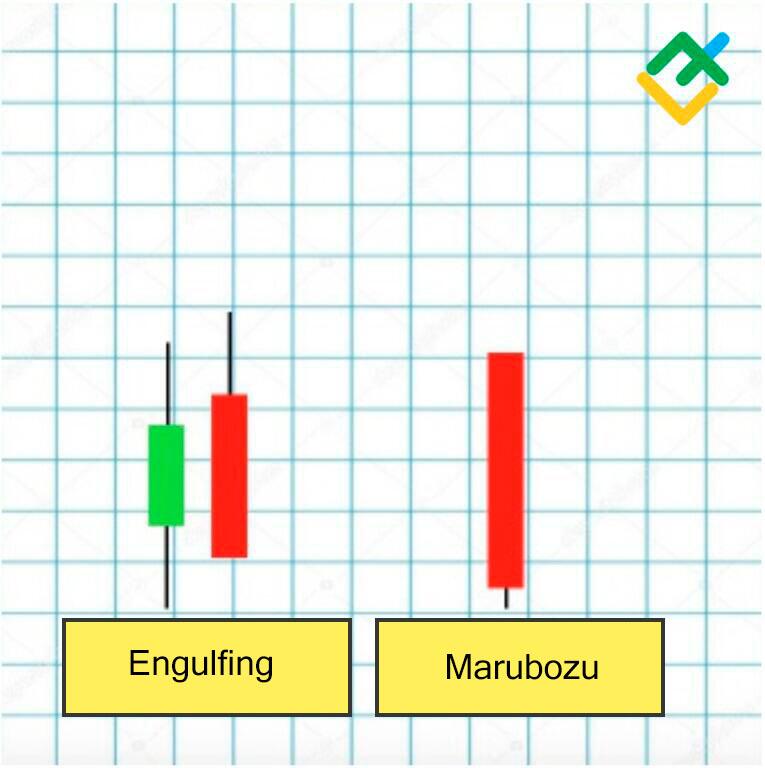
The critical difference between the Marubozu candle pattern and the engulfing patterns is the structure of the candles:
Marubozu is a single candlestick pattern;
the engulfing pattern consists of two candles, where the second candle engulfs the previous one;
the engulfing candle can be high or low, since the most important thing is the engulfing of the first candle’s body;
after the appearance of a Marubozu in the chart, the price begins a massive downward or upward pressure, with almost no corrections;
the body of the Marubozu candle is larger than the body of the engulfing candle.
For both patterns, shadows are not particularly important. However, the classic Marubozu and engulfing patterns do not have shadows at all. This indicates the superiority of one of the trading parties, which leads to a price reversal up or down.
Marubozu Candlestick Pattern Limitations
While the bullish and bearish Marubozu candlestick patterns can provide helpful trade signals, traders should be aware of some key limitations.
- Lack of information. The long candle body visually shows firm conviction, but the lack of wicks means there is little additional price information to confirm the move. So, while suggestive of momentum, Marubozu candles alone may not capture more nuanced actual market conditions.
- False signals. A series of Marubozu candles could form in choppy trading environments, producing false signals. So traders should apply other indicators like volume and oscillators to verify the reliability of Marubozu candle signals on the hourly or daily stock charts.
- Retrospective pattern identification. The Marubozu candle pattern provides helpful information after the candle has closed. Traders can only identify the pattern at the end of the period. So, real-time trading applications of this formation may be limited compared to patterns established mid-candle.
- Suggestive but not definitive. While visually representative of momentum, Marubozu candles alone may not fully capture more complex actual market conditions at turning points.
Applying prudent analysis around price action and timing remains essential to account for these limitations.
Conclusion
It should be stressed that bullish and bearish Marubozu are reversal patterns in candlestick analysis that appear in various financial markets and time frames.
In addition, the Marubozu pattern signals market participants' growing activity, while increased market volatility provides an opportunity to open profitable trades.
In summary, the Marubozu candlestick pattern can be a simple yet powerful visual formation to guide trading decisions and identify future market direction. Its long real body lacking wicks signals the dominance of either buyers or sellers during that trading session.
Bullish and bearish Marubozu candles that close on their highs or lows mean all price action was in one direction, displaying conviction behind the move. Observing where subsequent candle opens occur relative to the Marubozu body provides trade signals. A candle opening below a bullish Marubozu or above a bearish one tips traders to a reversal.
However, it's crucial to remember that to avoid false signals and improve the results of your trading strategy, combine the Marubozu candlestick pattern with other indicators to ensure
To extend your knowledge about the Marubozu pattern, use the convenient and functional LiteFinance online platform. You can try your hand at a free demo account without the risk of losing funds.
Start trading right now
Marubozu Candlestick FAQs
Marubozu in the Forex market is a reversal candlestick pattern that signals increasing trading volumes and a strong upward or downward movement.
The Marubozu candle can be both bullish and bearish. The white Marubozu candle signals buyers are in control, while the black Marubozu candle shows that selling is dominant.
The Marubozu candle pattern is clearly visible on the price chart, as it has a long body without wicks or they are too short.
A bullish Marubozu is a long green or white candle that appears at a strong support level or in an uptrend when the local resistance of an asset is broken out.
A bearish Marubozu is a long red or black candle that indicates a trend reversal at the top near a strong resistance level. This pattern can form as an impulse in a downtrend when a support level is broken out.
When this pattern appears at a support or resistance level, open a trade in the direction of a price reversal. Set stop loss above or below the Marubozu candle, depending on the new direction.
If a Marubozu candlestick appears at the top or bottom, the trend reverses. With continued price dynamics, the trend is strengthening due to a cascade of liquidated unprofitable positions of traders, which fuels further price impulse in one direction.
For rapid trades, focus on candle patterns established quickly intra-candle vs at the close like the Marubozu. This allows taking advantage of market participant reactions faster.
The long white Marubozu candle with no wick shows buyers maintained complete control, pushing the price substantially higher all session long. However, note that for more reliable results, confirming this pattern with other technical indicators and charts is necessary.
The content of this article reflects the author’s opinion and does not necessarily reflect the official position of LiteFinance broker. The material published on this page is provided for informational purposes only and should not be considered as the provision of investment advice for the purposes of Directive 2014/65/EU.
According to copyright law, this article is considered intellectual property, which includes a prohibition on copying and distributing it without consent.