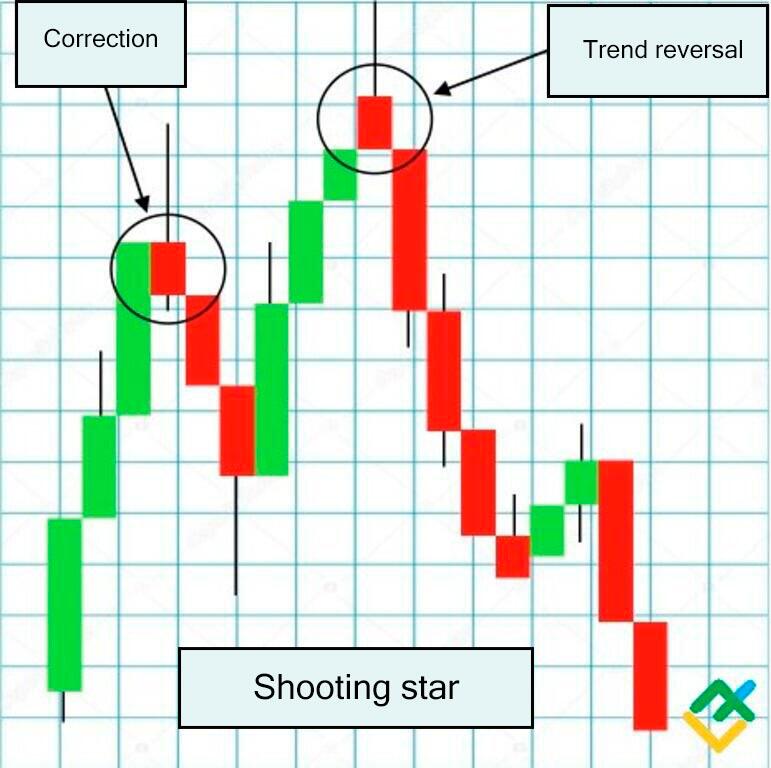
A shooting star is a candlestick pattern that consists of two candles and usually forms at the top. However, this pattern can also appear in an uptrend.
What is the function of the shooting star pattern in trading? Why does it have such a name? What does this Japanese candlestick warn about on the price chart? You will find answers to these and other questions in this article. You will also learn how to identify the shooting star pattern on the chart and apply it in trading in the financial markets.
The user-friendly and functional LiteFinance online platform with a variety of investment products for trading will help you improve your skills in practice using a free demo account.
The article covers the following subjects:
- Major Takeaways
- What is a shooting star in trading?
- Advantages and disadvantages of shooting star pattern
- How to identify the shooting star pattern
- How to trade the shooting star candle
- Shooting star candlestick vs inverted hammer
- Shooting star vs hanging man
- Best shooting star candlestick strategies
- Key tips about shooting star candlestick pattern
- Conclusion
- Shooting star candlestick trading FAQs
Major Takeaways
Main Thesis | Insights and Key Points |
Definition | A shooting star is a candlestick pattern with two candles, typically forming at the top of a trend. It resembles a shooting star with a long tail and small body, signaling potential resistance levels and entry points in the market. |
How to identify | The shooting star pattern has a small real body at the bottom of a price range and a long upper shadow. It doesn't usually have a lower shadow or it's very short. Recognizing this pattern helps in identifying resistance levels. |
How to trade | Trading the shooting star involves determining the top of the instrument, defining the pattern, and waiting for a trend reversal confirmation. It's essential to act consistently and use technical analysis for support and resistance. |
Shooting star candlestick vs inverted hammer | The shooting star forms at the top of the price chart, while the inverted hammer forms at the bottom near the support zone. The color doesn't matter; the structure, especially the long upper shadow, is crucial. |
Shooting star vs hanging man | The hanging man has a small body in the upper price range and a long lower shadow, while the shooting star has a small body in the lower price range with a long upper shadow. The hangman signals a stronger reversal than the shooting star. |
Strategies | Two strategies are highlighted: 1) Trading with confirmation using other patterns and indicators. 2) Intraday pattern trading on lower time frames. Both strategies emphasize the importance of support and resistance levels. |
Advantages and disadvantages | Advantages include easy identification, suitability for beginners, and reliability when supported by other patterns. Disadvantages are potential false reversal signals in uptrends and the need for additional confirmation. |
What is a shooting star in trading?
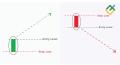
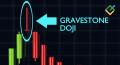
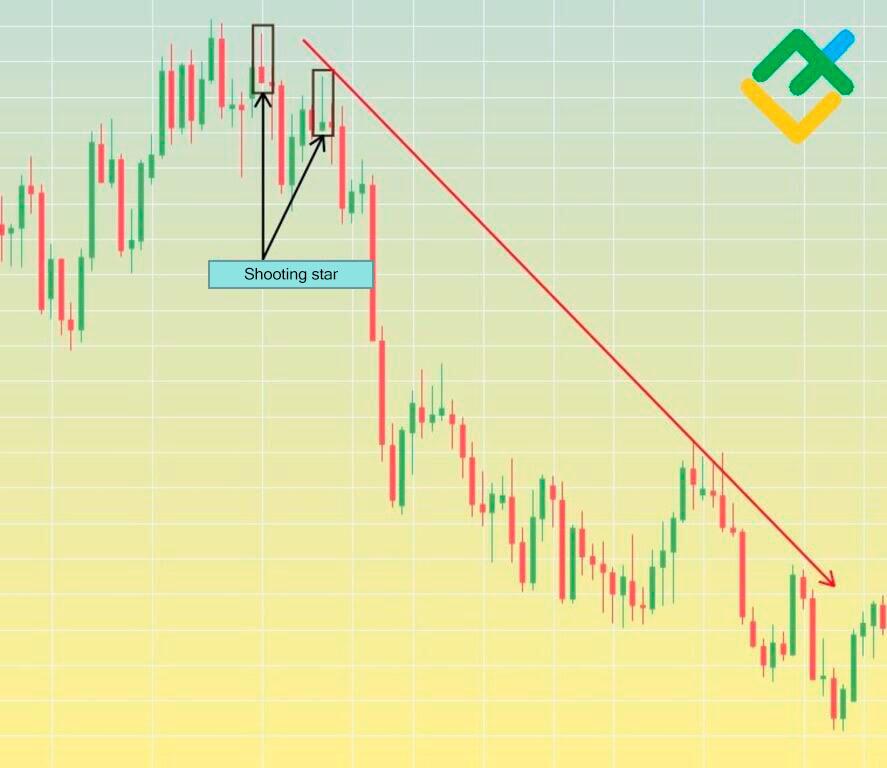
A shooting star pattern with a small real body at the bottom of a price range and a long upper shadow that signals a likely peak on the chart. The classic shooting star does not have a lower shadow or is too short.
The pattern got its name because of its shape. It has a long tail and a small body like a shooting star with a trail.
If you learn how to find this pattern on the chart, you will be able to correctly identify resistance levels and profitable entry points into the market.
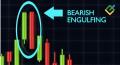
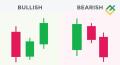
What makes a shooting star more bearish?
Unlike the evening star, the bearish shooting star is a weak trading signal and does not always work out. Therefore, the pattern requires additional confirmation by other candlestick patterns.
The color of the candle's body is not important. The pattern indicates that buyers tried to reach the top from the session's opening but failed, and the price returned to the opening range by the end of the session. That is, the candle's closing price is close to the opening price, which is also indicated by the long tail of the star.
The appearance of a pattern at the top after the bulls' attempt to break out the resistance level is a stronger signal for a bearish market reversal than a shooting star in an uptrend. However, the formation of a shooting star pattern on the rise may indicate an imminent short-term correction.
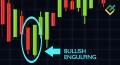
What makes a shooting star more bullish?
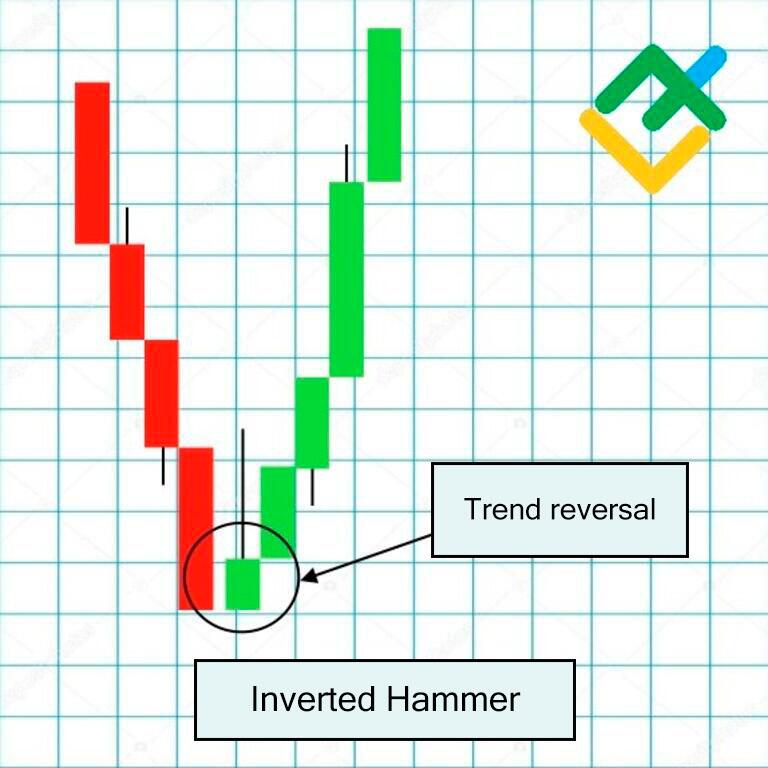
A bullish shooting star is a single candlestick pattern that forms at the bottom. It is also called the inverted hammer.
The pattern is formed during a downtrend and signals a possible reversal, as a result of which the price reaches a strong support level, at which pending purchase orders have already been formed. The color of the inverted hammer is also not important. The very formation of this figure is important. Candle’s real body is in the lower price range and has a long upper wick.
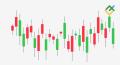
Shooting star candlestick pattern example on the Forex market
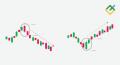
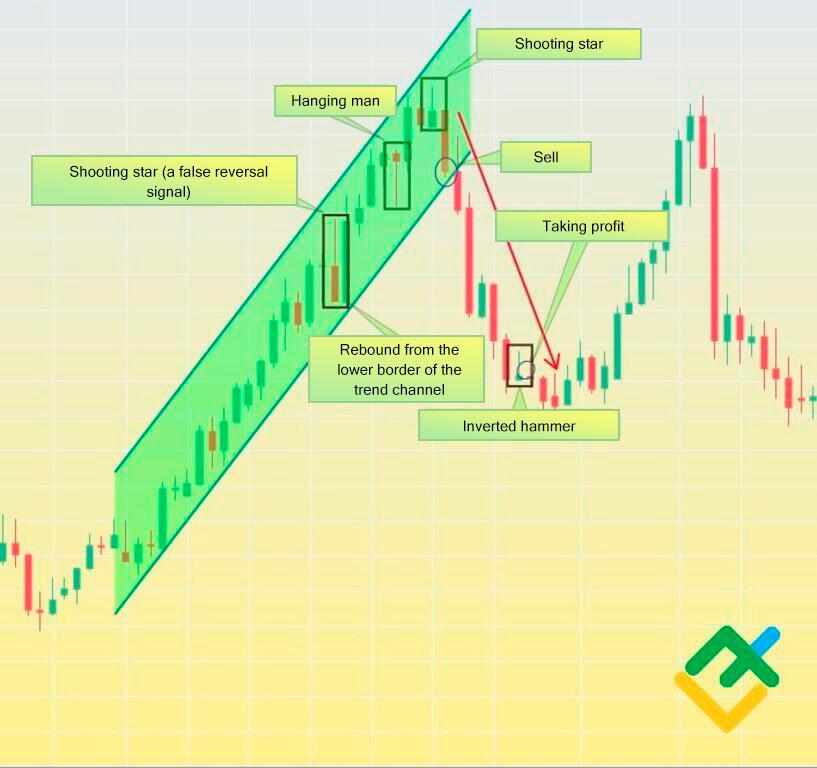
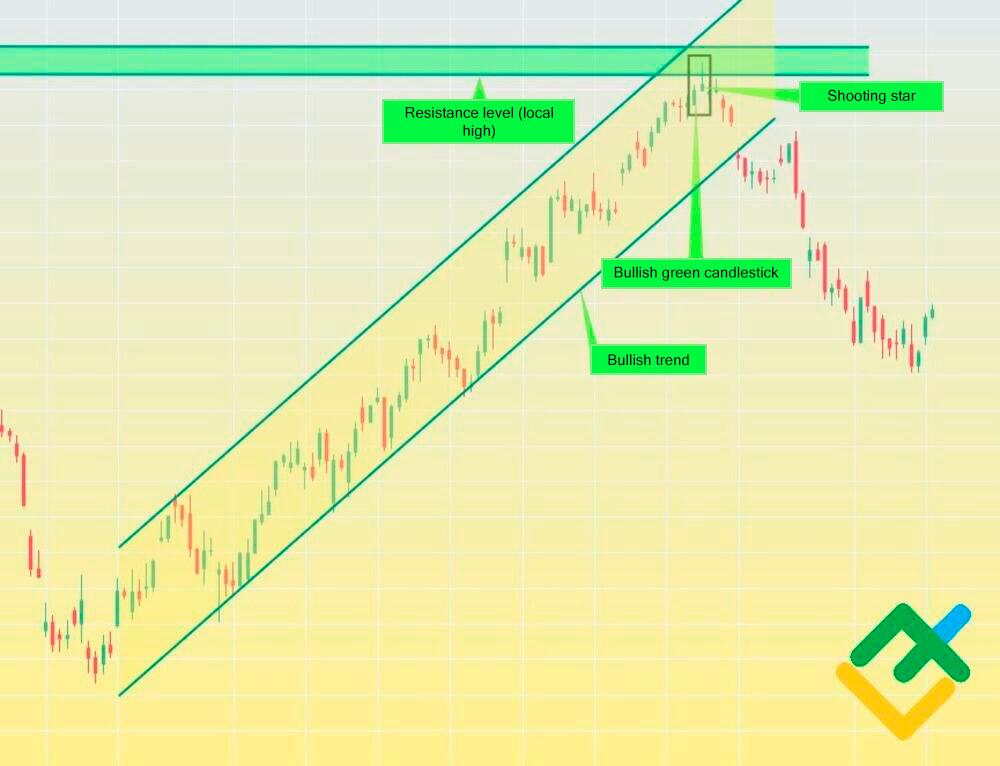
In this section, you will see examples of the formation of a shooting star on the USDCHF daily chart.
The chart below shows that a strong bullish rally has begun. The first shooting star pattern was formed, then the price bounced off the lower border of the ascending channel with an impulse green candle.
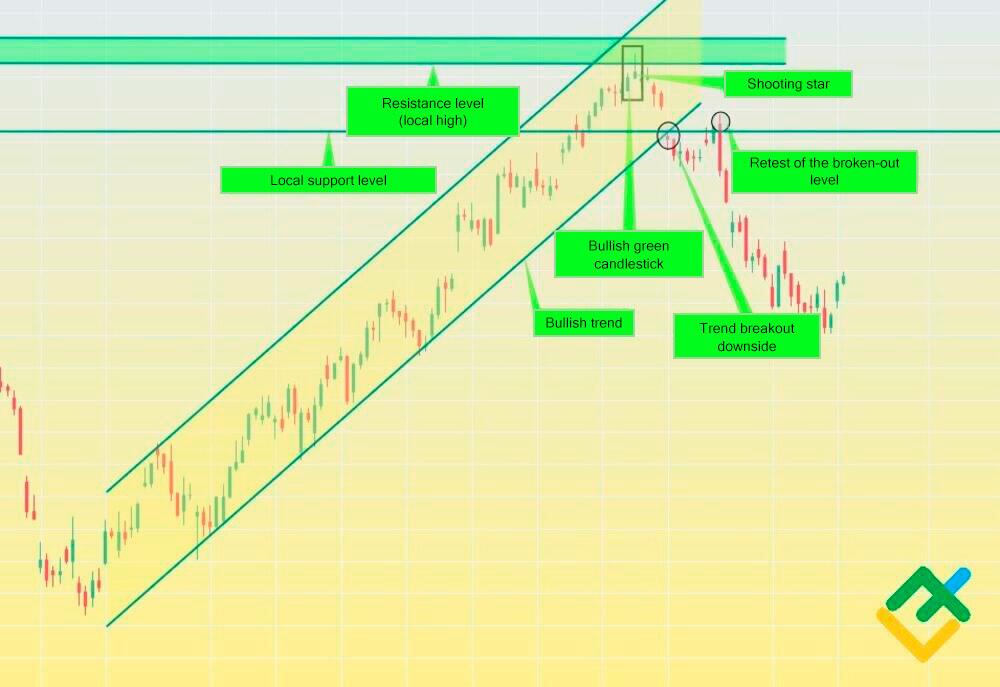
Further on the price chart, a hanging man reversal pattern appears, which warns market participants that the price has reached the top and could reverse soon.
Bulls' weakening was confirmed by the formation of a shooting star. The next day, the price began to plummet. After two price reversal confirmations, a short trade can be entered with a target at the nearest support level where an inverted hammer has formed. In this place it is necessary to take profit.
Advantages and disadvantages of shooting star pattern
Like other candlesticks the shooting star has advantages and disadvantages.
Advantages | Disadvantages |
It is easy to spot. | In an uptrend, the pattern gives false reversal signals. |
It is suitable for beginner traders in the stock or Forex market. | It requires additional confirmation by other patterns or technical analysis indicators. |
It can be a reliable signal at the top, supported by other reversal patterns such as hanging candle, dark cloud cover and bearish engulfing. |
|
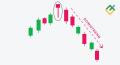
How to identify the shooting star pattern
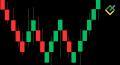
It is easy to spot a shooting star on a chart. This is a candle with a short body and a long wick in an uptrend or at a local top.
Step 1 — defining the top
First, it is important to determine the top of the instrument, as a shooting star forms on it. If the pattern occurs in an uptrend, wait for a trend reversal and a breakout of the lower border of the uptrend. In this case, a price reversal is most likely.
Step 2 — defining the pattern
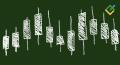
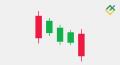
The pattern consists of two candles. Below is the description of a shooting star:
- the first candle must be bullish;
- the second candlestick can be either bullish or bearish;
- a feature of the pattern is the presence of a small shooting star gap after the previous candle;
- the classic shooting star has a short body in the lower price range of the candle at the opening price level and a long upper shadow.
Step 3 — breakout of the trend channel
After determining the top and the pattern itself, it is necessary to wait for confirmation of a trend reversal. The breakout of the lower border of the ascending channel and the retest confirm that the market turned bearish.
How to trade the shooting star candle
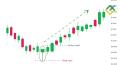
Trading using a shooting star is not difficult if you act consistently. Let's consider a step-by-step guide for trading shooting star candles on the H4 EURUSD chart.
Entry point
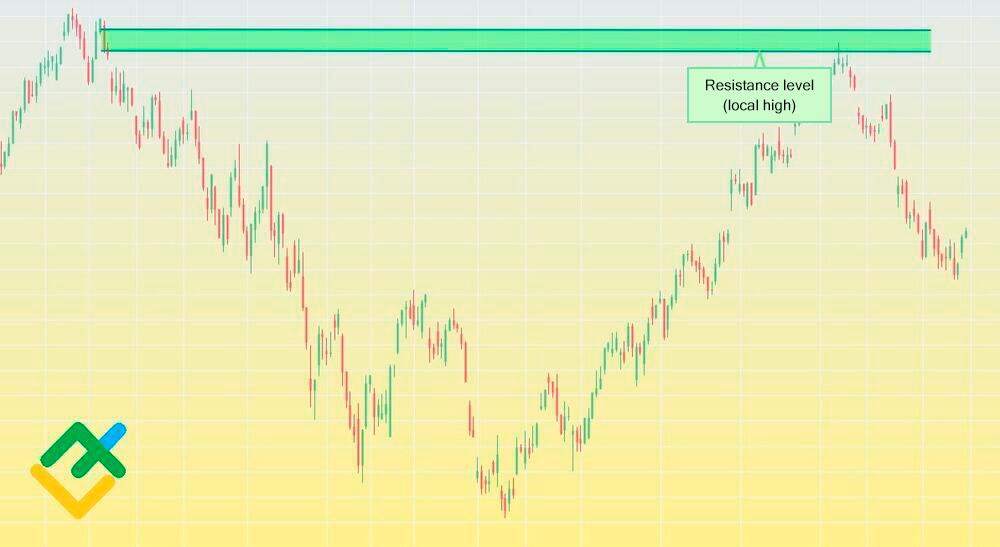
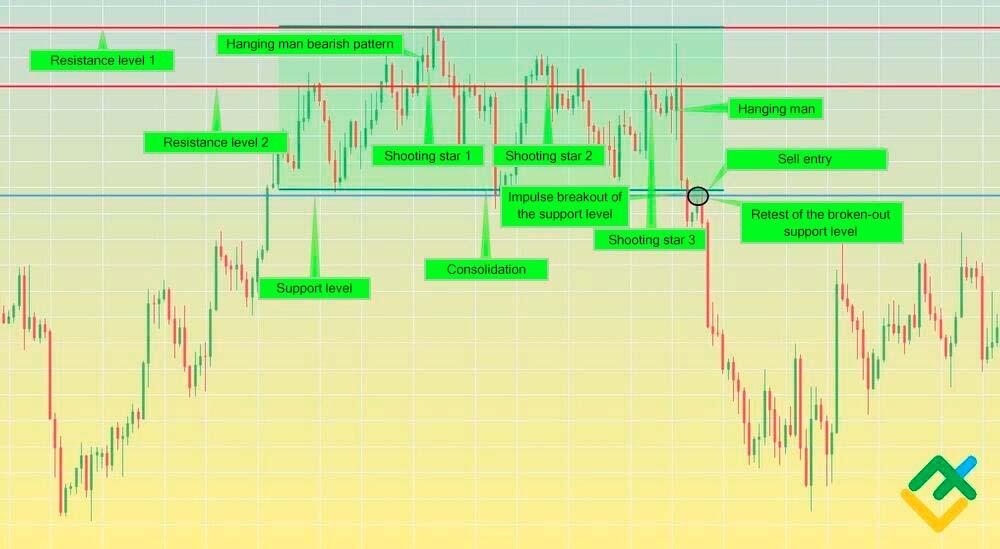
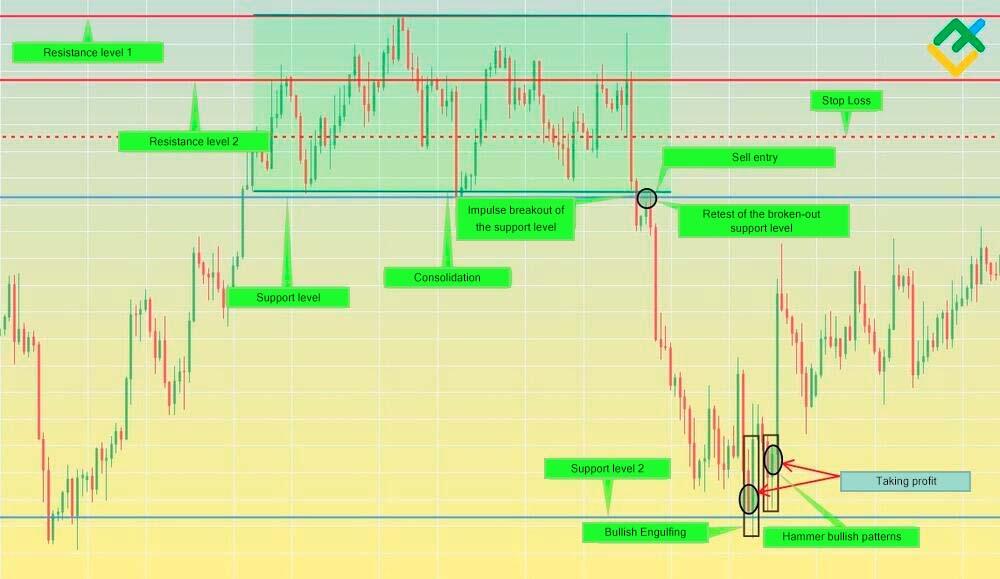
When conducting a technical analysis of any asset, it is important to determine support and resistance. 80% of the success of the transaction depends on this.
The chart shows that the price has been consolidating under the resistance for a long time, trying to break it out. However, the bulls weakened with each attempt, and the bears became stronger. This is evidenced by the formation of several bearish patterns, including reversal patterns, for example, hanging man, shooting star, and marubozu.
During conservative trading, it is important to wait for the breakout of support (blue line) and retest it to make sure that the price has reversed and the asset is controlled by sellers. Below this level, it is possible to open a short trade.
With a more risky trading strategy, it is possible to open trade even higher, in the zone of formation of a shooting star and a hanging man.
Stop-loss
After technical analysis and opening a short trade, it is important to set a Stop-loss. Using this order, traders can minimize the loss of funds. According to risk management rules, stop-loss (red dotted line) must be set above the broken out support level or 500 basis points above the position opening.
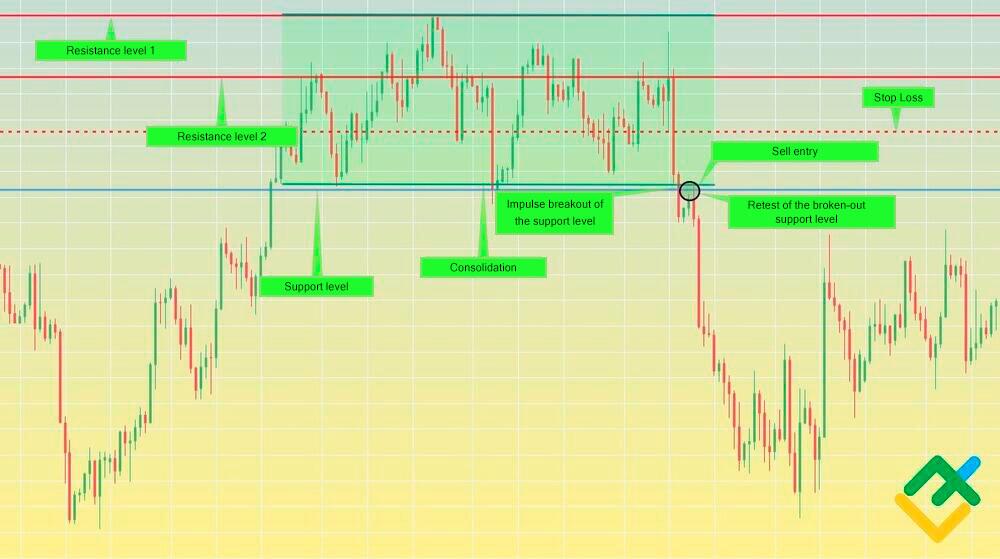
Take profit
It is necessary to take the profit as soon as the price reaches the support level. The chart shows that the price hit the support after the impulsive downward movement. Bullish engulfing and hammer reversal patterns began to form at this level.
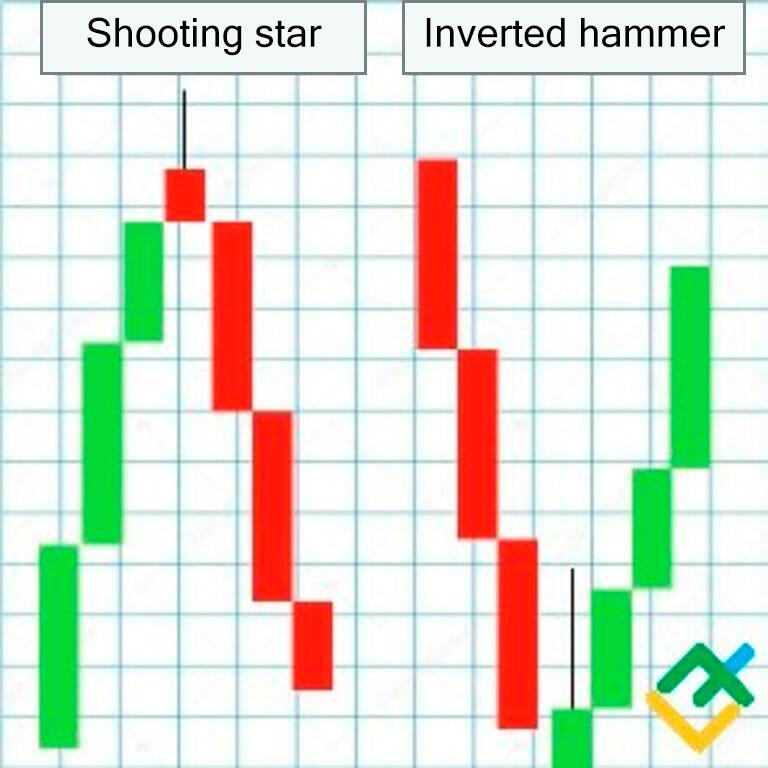
Shooting star candlestick vs inverted hammer
The difference between a shooting star and an inverted hammer is that the first pattern forms at the top of the price chart and the second at the bottom near the support zone. The color of the patterns does not matter; they can be either bearish or bullish. Only the pattern structure is important, namely the small body of the candle in the lower price range and the long upper shadow.
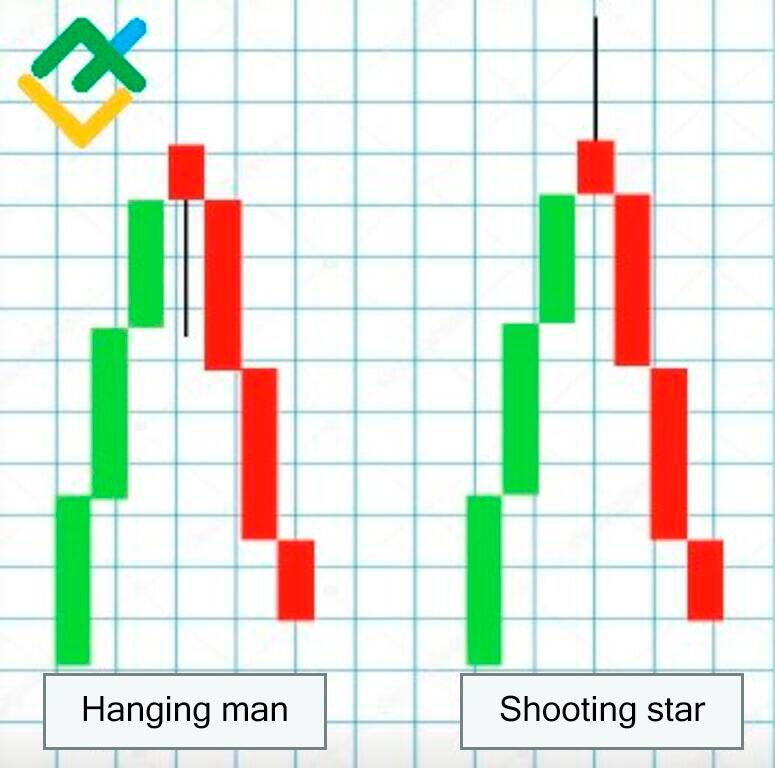
Shooting star vs hanging man
The main difference between hanging man and shooting star is that the first pattern has a small body in the upper price range and a long lower shadow, while the second pattern has a small body in the lower part of the price range with a long shadow up. In other words, the hangman is an inverted shooting star.
Hanging man is a reversal pattern. It has a stronger signal than a shooting star and does not require price reversal confirmation.
Thus, a hangman in an uptrend signals an imminent price reversal, while a shooting star in a bullish trend requires additional confirmation, by such patterns as hangman, bearish engulfing, dark cloud cover, evening star, etc.
Best shooting star candlestick strategies
There are several ways to trade a shooting star candlestick pattern.
Let's take a look at the most effective strategies.
Strategy 1: trading with confirmation
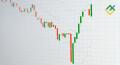
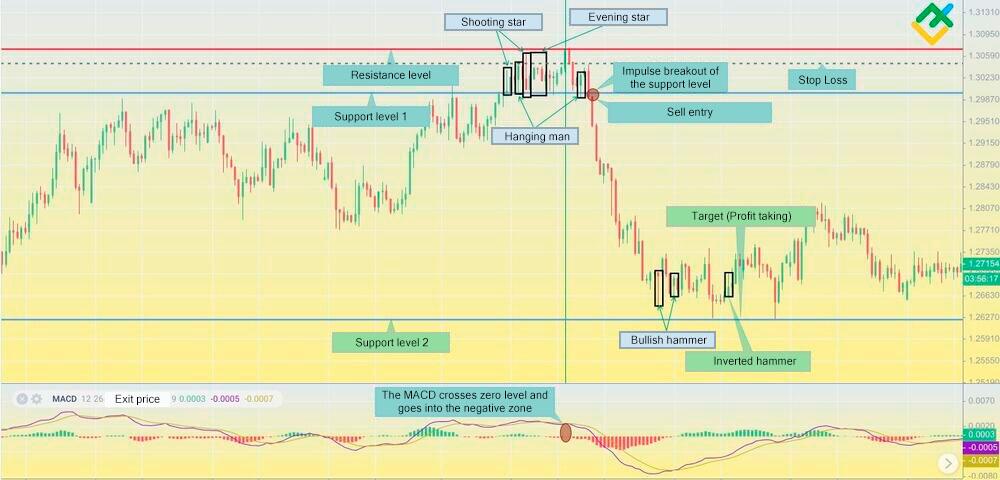
This trading strategy is based on shooting star confirmation with other candlestick patterns and candlestick analysis indicators. Let's take a look at the GBPCHF example.
The H4 chart below shows that the price cannot break out the resistance and forms several bearish patterns. In addition, the MACD indicator also began to move into the negative zone. The first signal for a price reversal is a shooting star pattern. Then the hanging man, the evening star, and another shooting star are formed. The transition of the MACD into the negative zone and the impulsive breakout of the support level served as additional confirmation.
It is worth opening a short trade after the price has broken out the support.
In this case, set a stop loss above the broken out level by 400-500 basis points from the entry point. Profits are fixed at the next support level, where bullish reversal hammer and inverted hammer patterns began to form.
Thus, it was possible to earn more than 3700 net profit points from this transaction.
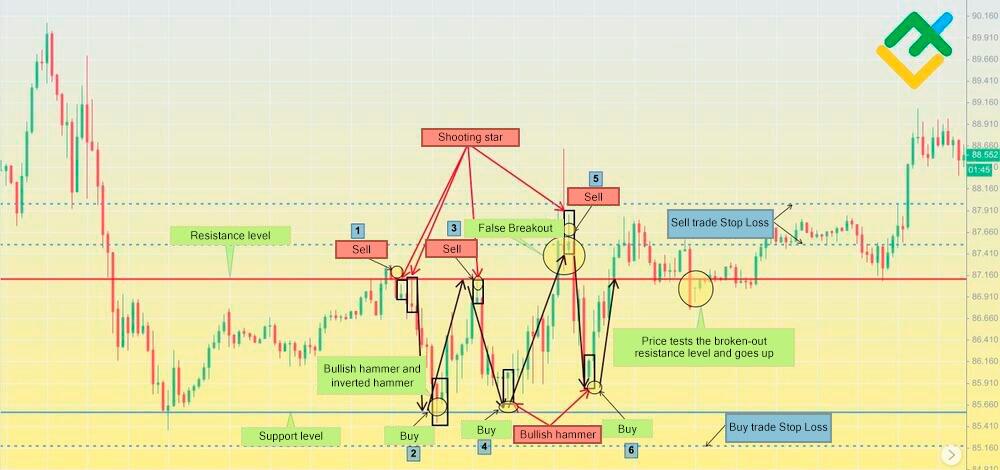
Strategy 2: intraday pattern trading
The essence of this strategy is the opening and closing of trades during intraday trading.
Trading is carried out on lower time frames during the price movement from support to resistance and back or using chart patterns. Let's take a look at the 15-minute USCRUDE chart.
The picture below shows the consolidation of the asset in the range of 85.57-87.11.
The price moves from support to resistance. A trader could open six buy and sell trades. It was possible to open the first short position when several shooting star patterns appeared with a target at the support level, from which the price bounced up. In this case, set the stop loss above the resistance when opening a short trade and below the support when entering a buy trade.
Let's take a look at the fifth short trade. Here the price broke out the resistance, but the bulls failed to rise higher. Then another shooting star pattern was formed.
It should be emphasized that when the resistance was broken out, the price successfully tested this level and headed up. Numerous buy orders opened near support. A bullish hammer and an inverted hammer are forming there as well.
This trading strategy without confirmation on lower time frames is riskier than the first.
However, you will be able to make a profit quickly.
Thus, according to this USCRUDE trading strategy, it was possible to get a total profit of 9252 basis points, or about $92 in net profit from minimum trades of 0.01 lots per trading session.
Key tips about shooting star candlestick pattern
- When detecting a shooting star, first of all, it is important to correctly determine the support and resistance levels;
- The pattern has strong signals at the top. Within an uptrend it can give false signals, so pay attention to the place where the figure is formed;
- The color of the candle is not important, but a red bearish shooting star candle is strongly bearish;
- When trading this pattern, it is important to confirm the signal with other candle patterns or technical indicators;
- Set stop loss according to risk management rules to avoid unnecessary losses;
- The absence of a lower wick is a sign of a strong signal. This classic shooting star is rare, but the price is more likely to decline after its appearance.
Conclusion
The shooting star is one of the key patterns in candlestick analysis. It warns traders about an imminent reversal of the uptrend. Trading this candlestick allows traders to make money during short-term trading.
For successful Forex trading, it is important to understand how shooting stars form and be able to use this pattern, as it often appears in the chart.
The key point is that this candlestick needs confirmation by other patterns or indicators. The quality of trading and potential profit depends on competent analysis, the correct identification of the trend, and the psychology of market participants.
Shooting star candlestick trading FAQs
A shooting star is a bearish candle that warns market participants that the trend is about to reverse down.
On top, this pattern is quite reliable with the support of other reversal patterns. However, a shooting star can give false signals in an uptrend at higher volumes.
The inverted hammer is opposite to the shooting star pattern. Its formation and structure are similar to a shooting star, but it appears at the bottom and signals imminent growth.
The shooting star pattern consists of two candlesticks with a small gap between them. However, this does not happen all the time. The pattern signals the increased influence of the bears and the imminent reversal at the top.
The color of the candle does not matter. It can be either bullish or bearish. However, a bearish candle more accurately shows the sellers' pressure on the price.
A red shooting star at the top means that the bulls tried to consolidate the price higher, but they failed.
No, the shooting star pattern indicates only a bearish trend, but can also form in an uptrend. In this case, the probability of false signals is very high.
As a rule, after the formation of a shooting star, the price may drop sharply, or the pattern may briefly consolidate with other bearish patterns, and then the quotes will decline.
First, you need to determine the resistance level since a pattern usually forms on it. After identifying and confirming a shooting star, it is possible to open a short trade. Set a stop loss above the resistance level. The target can be determined using technical analysis. It is also possible to set a take profit at the nearest support level.
These are opposite patterns with identical structures. A shooting star forms at the top, and an inverted hammer at the bottom.
The difference between the patterns is that the body of the hanging man is at the top of the price range, while the body of the shooting star is at the bottom of the price range. The hangman has a long lower wick and the shooting star has a long upper wick. In addition, a hanging man serves as a stronger reversal signal than a shooting star.
The content of this article reflects the author’s opinion and does not necessarily reflect the official position of LiteFinance broker. The material published on this page is provided for informational purposes only and should not be considered as the provision of investment advice for the purposes of Directive 2014/65/EU.
According to copyright law, this article is considered intellectual property, which includes a prohibition on copying and distributing it without consent.