A Hammer candlestick pattern signals an upward reversal. It suggests that sellers are weakening and buyers are taking the upper hand. If you find this pattern on a chart and interpret it correctly, you will be able to make trading decisions quickly and effectively.
This article examines the Hammer pattern in detail, including how to identify it on a price chart and how to use it to boost your profits and reduce risks in trading.
The article covers the following subjects:
Major Takeaways
- A Hammer candlestick pattern signals a looming price surge after a bearish trend. It has a small body and a long wick or shadow at the bottom. The wick should be at least twice as long as the body.
- A Hammer Japanese candlestick pattern emerges when the price declines during the day, but then bulls enter the market, pushing the quotes higher.
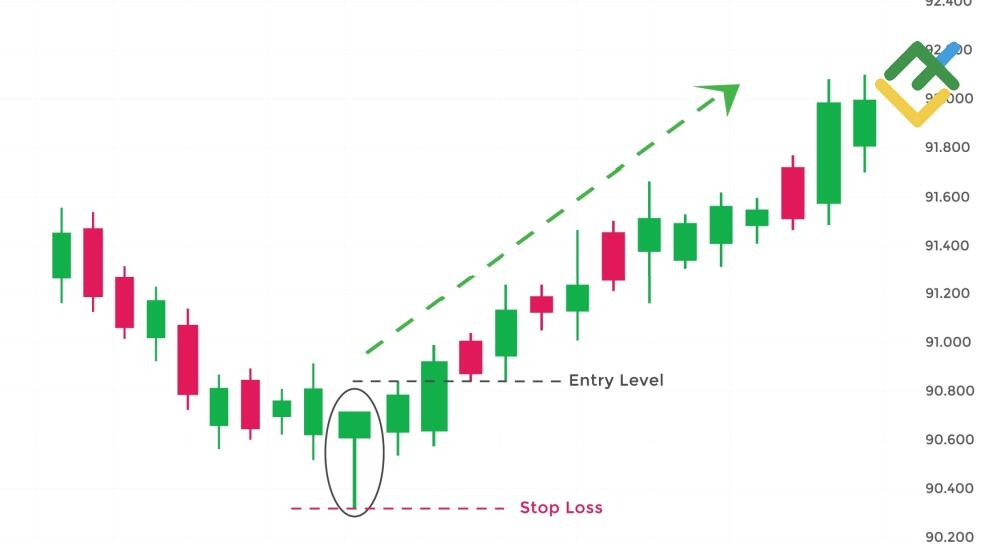
- If a Hammer candle appears on the chart, long positions can be opened only after the subsequent confirmation candle. A stop-loss is placed just below the Hammer's wick.
- Use technical indicators such as the RSI or MACD to confirm the signal. Also consider support and resistance levels.
- A Hammer pattern can identify the early stages of price growth. However, the pattern can give false signals.
- A Hammer reversal pattern can be found on any time frame, ranging from one minute to one day. It is effective in highly volatile markets, such as Forex or cryptocurrencies.
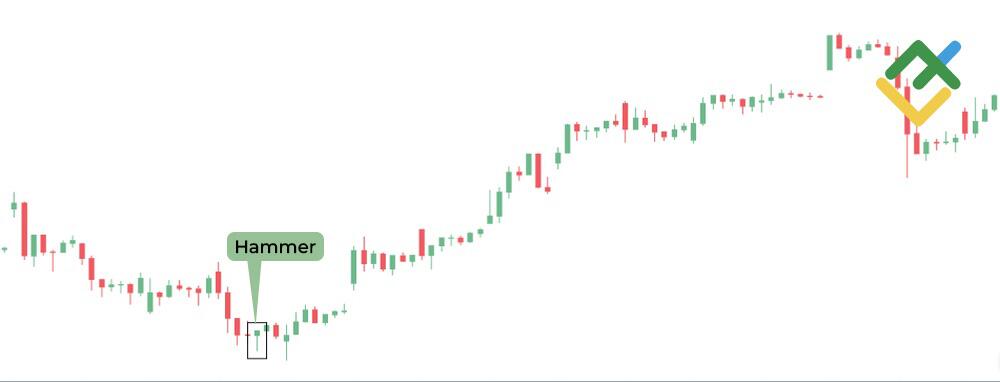
What Is A Hammer Candlestick?
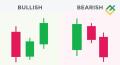
A Hammer Japanese candlestick is a one-candle pattern in price action trading that signals that a downtrend is about to reverse. It has a small body at the top and a long shadow below, which is twice the length of the body.
A Hammer has almost no upper shadow. The color of the body is not that important, but a bullish Hammer gives a stronger signal than a bearish one. This candlestick shows that buyers are strong and the price may surge.
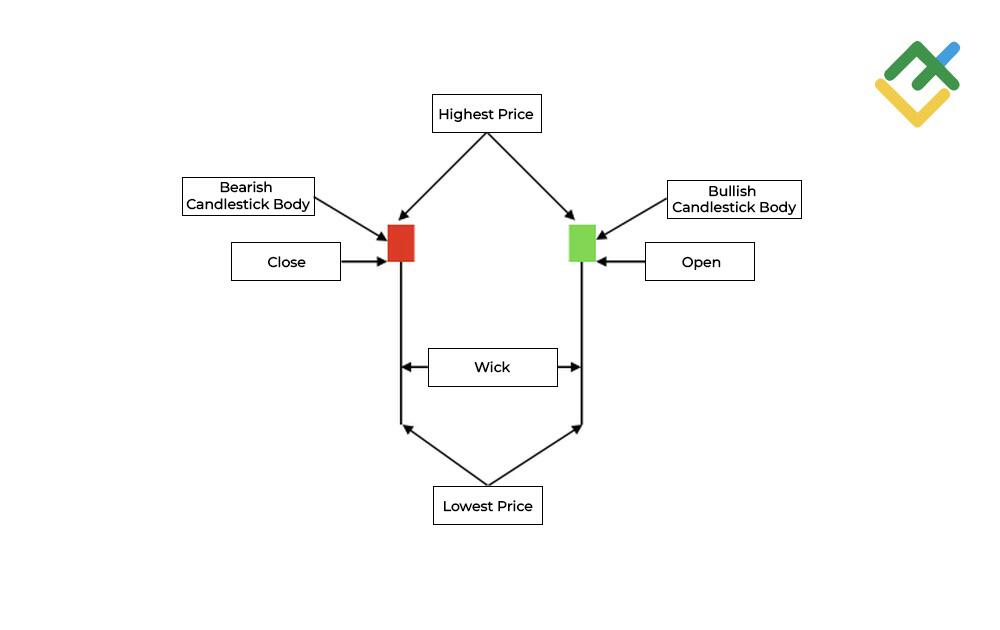
Hammer Candlestick Components
Let's analyze the structure of the Hammer pattern.
- Open is the candle's opening price at the beginning of the time period. It should be near the closing price.
- Close is the closing price at the end of the period. It should also be close to the opening price.
- Lowest Price is the minimum price of a candlestick during its formation period. A Hammer candlestick pattern has a long lower shadow, marking a new low.
- Highest Price is the maximum price for the period. It should be close to the opening and closing prices.
- The price range is the difference between the maximum and minimum prices. A Hammer has a broad range due to a long lower shadow.
- Bearish or Bullish Candlestick Body represents the difference between the opening and closing prices. In a Hammer pattern, the body is small, and its color is not important.
- There is no upper shadow, or it is very short. The lower shadow is remarkably long, extending at least twice the length of the body.
Types of Hammer Candlesticks in Technical Analysis
There are several types of Hammer Japanese candlestick patterns in trading, and each is interpreted differently.
Bullish Hammer
If a bullish Hammer candlestick forms on the chart, the price will likely increase. The pattern represents a candlestick with a short body and a long lower wick. You need to wait for the next candlestick to close above the Hammer's body, confirming a buy signal.
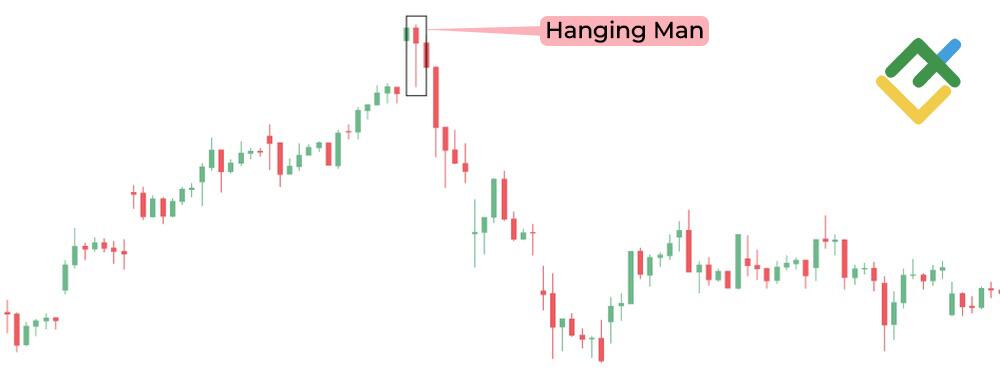
Hanging Man
A Hanging Man candlestick signals a price decline. It appears when the price rises and falls sharply, but then returns almost to its starting point by the end of the period. The candlestick has a long lower shadow. To make sure that this is a bearish signal, you need to wait for the subsequent candlesticks to form and confirm the signal.
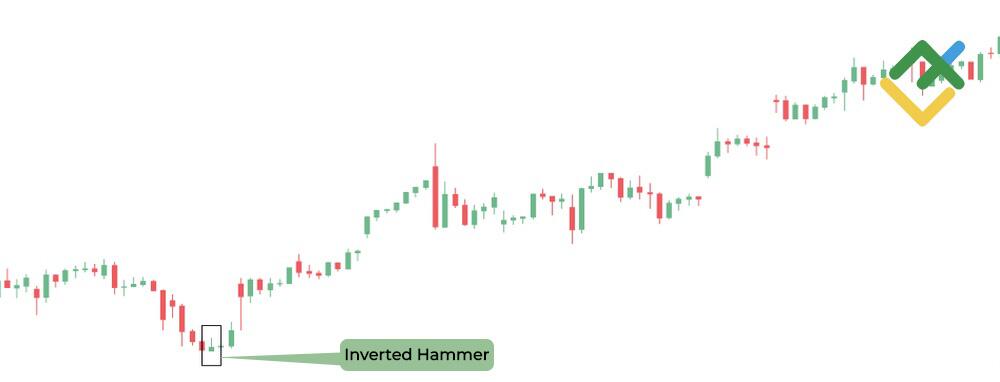
Inverted Hammer
An Inverted Hammer pattern points to an impending trend reversal to the upside. The candle has a small body at its bottom and a long shadow at the top. To confirm a trend reversal, a bullish candlestick should follow the Inverted Hammer.
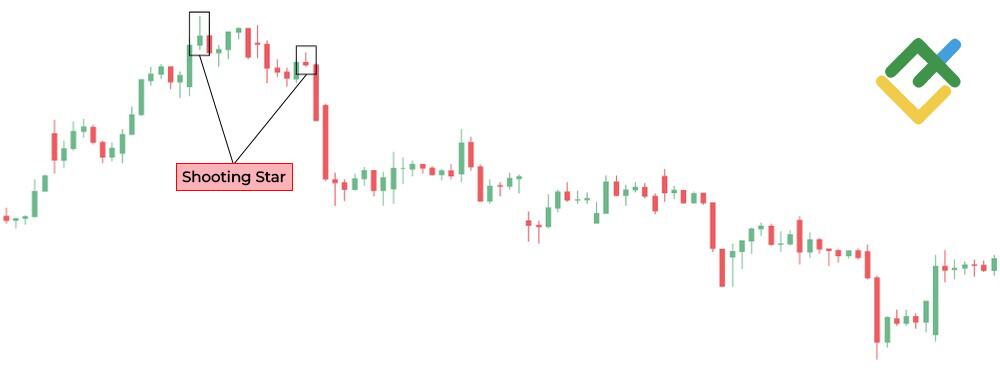
Shooting Star
A Shooting Star is a bearish reversal pattern. It looks like a small red or green candlestick following an uptrend. It has a small body, a long upper shadow, and almost no lower shadow. It hints that the uptrend may end soon.
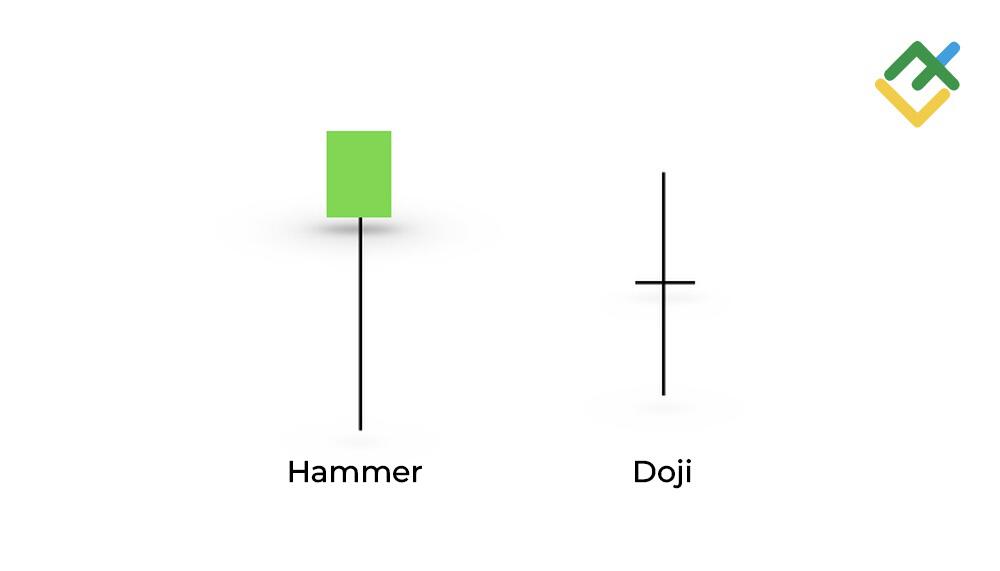
Hammer Candlestick vs. Doji
In technical analysis, Hammer and Doji patterns are one-candle formations that often precede a trend reversal. The Doji pattern differs from the Hammer in that it has almost no body—the opening and closing prices are almost the same, reflecting market uncertainty.
Feature | Hammer | Doji |
Body | Small, at the top of the range | Almost absent |
Lower shadow | Long | Can be long or short |
Upper shadow | Small or absent | Can be long or short |
Interpretation | Signals the end of a bearish trend, a bullish reversal is possible | Signals market uncertainty |
Example of Combined Trading Strategy with Hammer Pattern
Combined trading strategies using the Hammer pattern involve finding and confirming the pattern using other technical analysis tools.
Let's consider an example of such a trading strategy on the daily chart of the USDJPY pair.
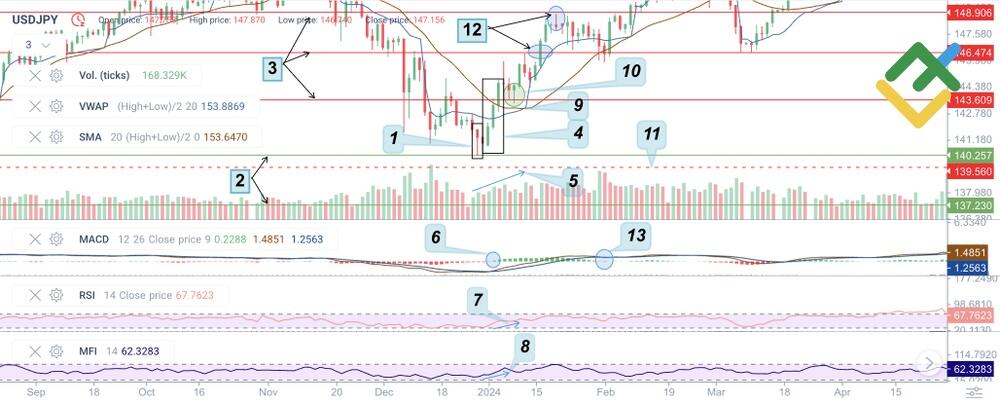
First, we should identify the market trend and forecast price changes:
- Spot the Hammer candlestick pattern on the chart.
- Find the key support levels.
- Determine the key resistance levels.
- Get confirmation from another reversal candlestick pattern, such as Three White Soldiers.
- There is a sharp increase in tick volume, which suggests that a lot of long positions have been opened.
- Wait for a buy signal from MACD – the indicator line should cross the signal line from below.
- The RSI values have rebounded from the lower boundary, generating another buy signal.
- The MFI shows an inflow of liquidity, which points to increased bullish demand.
- The VWAP indicator and the SMA 20 are below the price, confirming the bullish sentiment.
- Determine an entry point and open a long position at 143.60.
- Set a stop-loss order below the Hammer's low and the support level around 139.56.
- Place a take-profit order at the nearest resistance levels of 146.47–148.90.
- A bearish reversal is expected near 148.90, so lock in profits to avoid losses.
When combined with other technical analysis tools, a Hammer candlestick pattern can significantly increase your chances of success in the market.
Conclusion
A Hammer reversal pattern signals an imminent upward trend shift. It can be identified by a small candlestick body with a long lower shadow, suggesting that buyers are gaining strength and the price will soon start to increase.
However, relying solely on the Hammer is ill-advised. Always check technical indicators and monitor trading volume when trading this pattern. Moreover, it is essential to be patient, perform market analysis, and gain hands-on experience. Remember that practice makes perfect.
You can start your trading journey with the Hammer pattern on a risk-free LiteFinance demo account.
Get access to a demo account on an easy-to-use Forex platform without registration
Hammer Candlestick Trading FAQs
A Hammer appears after a decline and hints at a possible bullish reversal. To use it, wait for a confirmation, such as a break above the high by the following candlestick. As a rule, it is a solid buy signal.
When trading a Hammer candle, open a long position when the signal is confirmed. Set your stop-loss below the minimum of the Hammer to minimize losses. A take-profit order can be placed at the resistance level.
It depends on the market context and other indicators. If you use the Hammer together with Fibonacci levels or trend lines, the chances of a successful trade will increase.
A Hammer trading strategy suggests that you find and use this candlestick pattern during a trading session. You need to determine the trend, confirm trading signals, and manage risks to make successful trades.
An Inverted Hammer signals a looming market reversal after a downtrend. It has a small body at the bottom and a long shadow at the top, indicating a possible upward price reversal.
An Inverted Hammer signals a price rise after a decline. It has a small body at the bottom and a long upper shadow. A Shooting Star tells you that prices will drop after a rise. This candlestick has a small body and a long shadow above it.
A Hammer signals price growth after a decline, with a small body at the top and a long lower shadow. A Hanging man appears after growth, but indicates a possible decline in prices. It warns that the uptrend is fading.
A red Inverted Hammer pattern signals a potential bullish reversal, but the red color of the candlestick body means that sellers can still exert pressure on the price.
Both trading patterns give a buy signal, but the regular Hammer is often considered stronger because its shape reflects greater bullish demand in the market.
A Hammer is a bullish reversal pattern. It indicates a possible reversal after a decline. The long lower shadow shows that bears were trying to drag the price lower, but bulls pushed it higher, suggesting that growth may continue.
A bullish Hammer has a small candlestick body at the top of the range and a long shadow at the bottom. The color of the candlestick body can be any, but the important thing is its long lower shadow.
Usually, a Hammer gives a stronger buy signal than an Inverted Hammer because the former reflects the ability of buyers to keep the price above a certain level by the end of a given period.
The content of this article reflects the author’s opinion and does not necessarily reflect the official position of LiteFinance broker. The material published on this page is provided for informational purposes only and should not be considered as the provision of investment advice for the purposes of Directive 2014/65/EU.
According to copyright law, this article is considered intellectual property, which includes a prohibition on copying and distributing it without consent.