
An inside bar is an effective candlestick formation that can indicate a favorable entry point. The most effective results can be achieved when this trading strategy is used in a trending market. To open a profitable position, a trader needs to identify the current trend and the key support and resistance levels, and wait for an inside candle to appear.
In this article, we will explain the principles behind the formation of the inside candle pattern, learn how to trade an inside bar, and show how it differs from the outside bar. We will also provide trading recommendations for exploiting the inside candle as part of your technical analysis.
The article covers the following subjects:
Major Takeaways
- The inside bar candle pattern is a price action formation. The idea behind it is simple: after a strong move (a long candle), volatility decreases, and the asset starts trading in a narrow trading range.
- As market theory suggests, a period of consolidation with low volatility is usually preceded or followed by high volatility, and vice versa. The inside bar signals low volatility and represents a period of consolidation, during which a trader may consider a trade aimed at profiting from the next trend.
- The inside bar candlestick pattern itself is neither bullish nor bearish. To determine the direction, one must identify the current trend and then open a position accordingly.
- In some cases, the pattern can point to a potential reversal, typically after a trend slows down and consolidation forms. A breakout accompanied by an inside price bar is a strong signal.
- If several smaller-volatility candles form within the range of one larger candle, this formation is called a spiral inside bar, where each preceding candle contains the next smaller bar, like nesting dolls.
- There are three main ways to trade this pattern: trading with the trend, trading with moving averages, and trading on a breakout. You can also develop your own trading strategy using the inside bar.
- The outside bar is a pattern where the second candle has a larger high and low range than the first. This chart pattern can also indicate direction — up or down.
- The first candle is called the mother bar. The low of the mother bar marks one boundary of the pattern, and the upper part marks the other. The mother bar is larger than the preceding bar.
What is an Inside Bar Pattern?
The inside bar (IB) is a price action pattern that consists of two or more candles and provides signals for opening trades depending on the market context. Most often, traders use the inside candlestick pattern to confirm trend continuation.
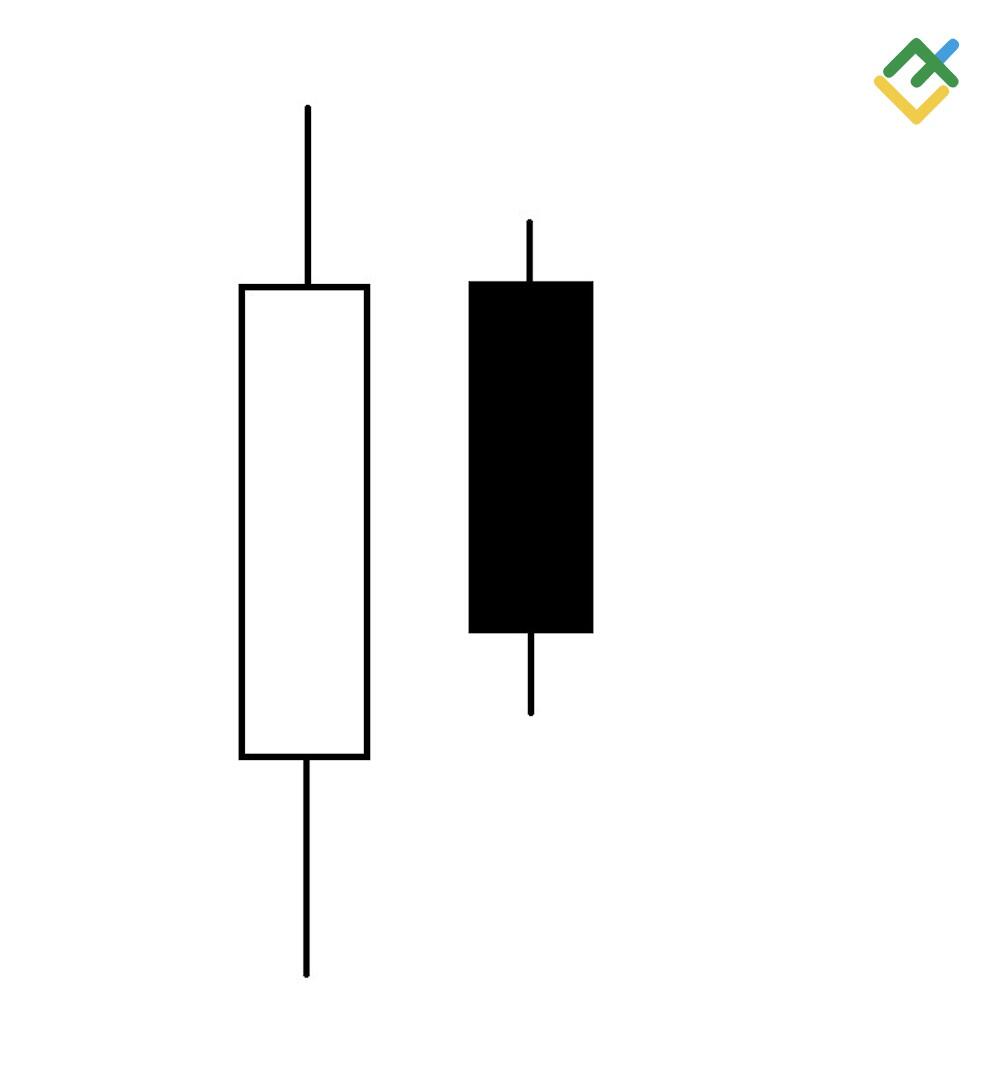
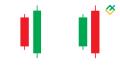
In the classic definition, the inside bar consists of two candlesticks. The first candle is larger than the following one.
The most important condition for forming the pattern is that the second candle, including its wicks, must stay completely within the high-to-low range of the first candle, its wicks also taken into account.
In other words, the inside bar is smaller than the mother bar, with its high and low contained entirely within the previous candle. The pattern is valid only if the second candle meets the condition of being fully contained within the mother bar's range.
This candlestick pattern indicates that neither buyers nor sellers managed to gain the upper hand over a certain time period. The inside bar is also characterized by low volatility. As we know, low-volatility periods often follow periods of higher volatility. Therefore, once market participants decide on the direction of the trend, a new impulse can be expected.
Traders value this formation because it can hint at the potential breakout direction. Most often, the inside bar pattern occurs and is traded on a breakout of key support or resistance levels.
This pattern is very easy to spot on a price chart, and you can understand how to trade it with any asset.
Bullish and Bearish Inside Bars
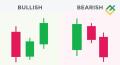
The inside bar can be either bullish or bearish — it all depends on the market situation and the prevailing trend. Let's look at some examples.
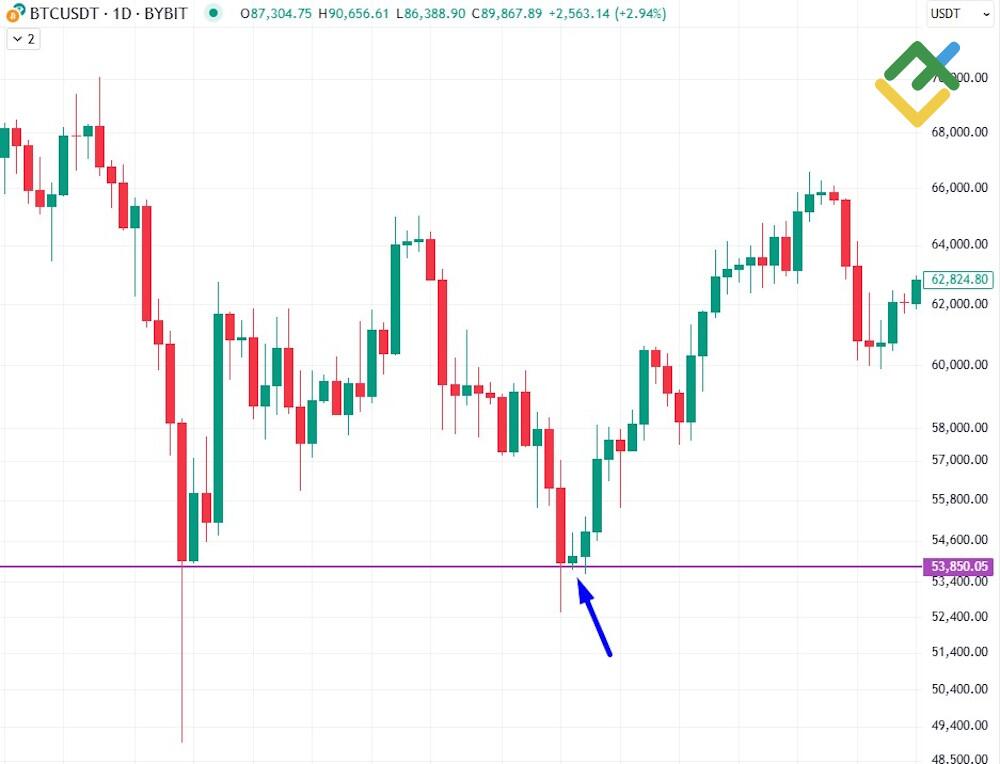
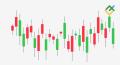
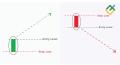
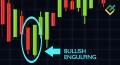
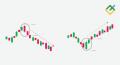
On the chart above, you can see an inside bar formed at a support level, identified by the range of BTCUSDT's previous lows. It is a bullish inside bar signal, and a trader can open a long position despite the strong drop in price.
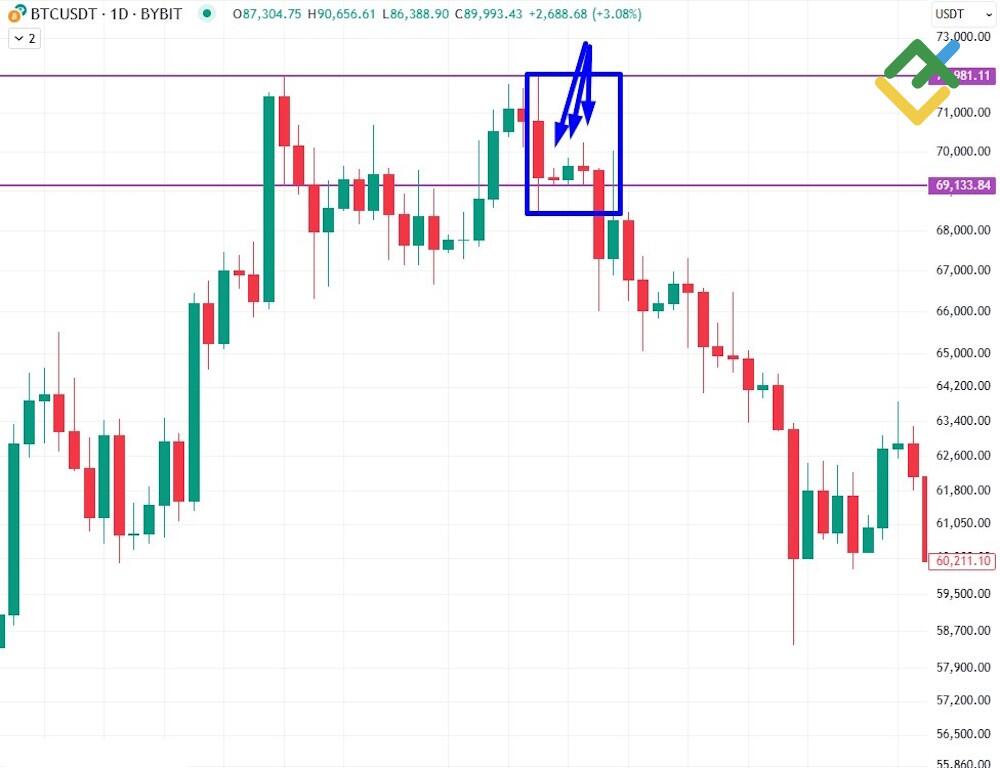
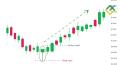
In the example above, there are many inside bars within the same mother bar. After the breakout, a downtrend began. This is a bearish inside bar setup; before it formed, buyers failed to break the key resistance level of 71,980.00.
So, the inside bar alone does not indicate a specific direction for trading, and the candle color plays little role. It's all about context: where the pattern formed, whether there are support or resistance areas nearby, how the price has moved previously, and what trend prevails on the higher time frames. Considering these factors, the inside bar signal can help identify a profitable entry point, but it will not directly reveal the trend direction.
In the early stages, traders may focus on learning to trade this price action pattern strictly within a trending market, when the pattern appears near key levels of support and resistance. Once comfortable with this way to trade, they can move on to more advanced strategies, such as trading against the trend.
Identifying Inside Bars on Trading Charts
Identifying an inside bar is simple: if a candle is contained within the high-to-low range of the previous candle, you've found the pattern.
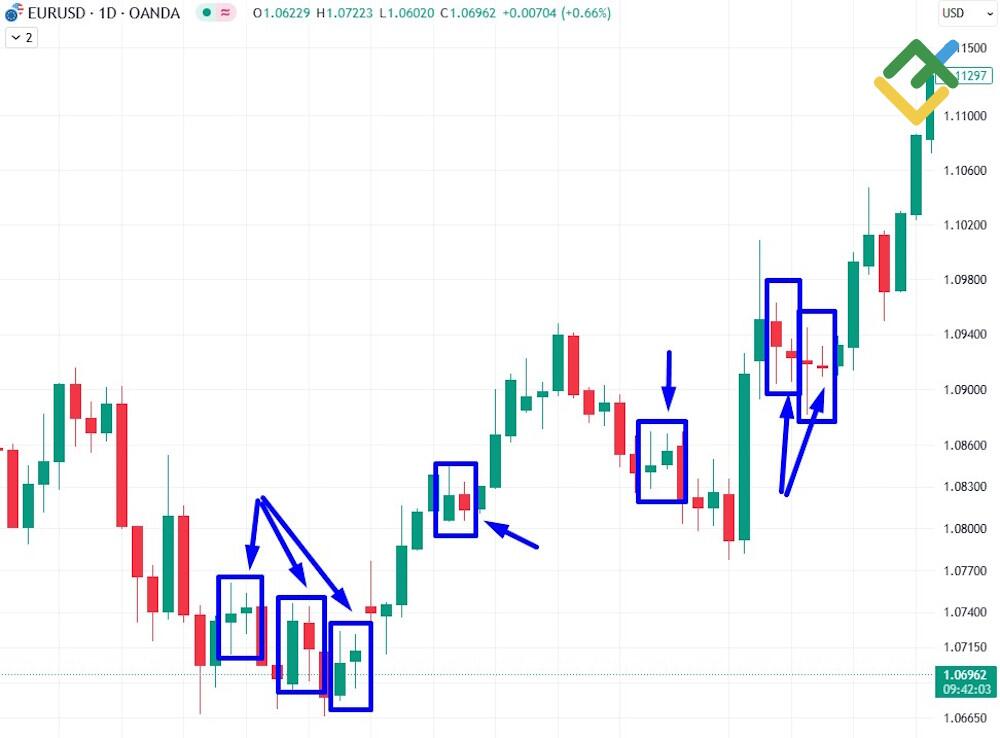
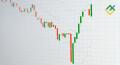
Here you can see inside bars on EURUSD's daily chart time frame. As we can see, there are quite a few of them. Not every inside bar setup should be used to open positions, but those that form near key highs or lows are definitely worth considering. Pay attention to chart levels such as previous highs, lows, support, and resistance when assessing the validity of the setup.
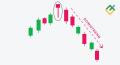
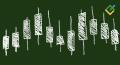
A special variation worth noting is the spiral inside bar. Here's the idea: smaller candles form within the mother bar structure. Each preceding candlestick is nested within the high-to-low range of the one before it (including wicks). The more such candles there are, the stronger the expected impulse after the consolidation.
Inside Bar Trading Strategy: How to Trade the Inside Bar Pattern
Trading with the inside bar is fairly straightforward if you follow a few rules:
- Identify the trend direction on a higher interval (D1)
- Trade within this trend
- Look for an inside bar near support or resistance
- Don't be greedy
Let's review a few core trading strategies accordingly.
Trading with the Trend
Trading with the trend is the simplest way to generate significant profits. This method is one of the most effective inside bar price action breakout strategies, especially in strong trending markets.
To apply this trading strategy, you first need to determine the trend. We won't go into trend identification methods here, as you can learn more about them in our dedicated guide.
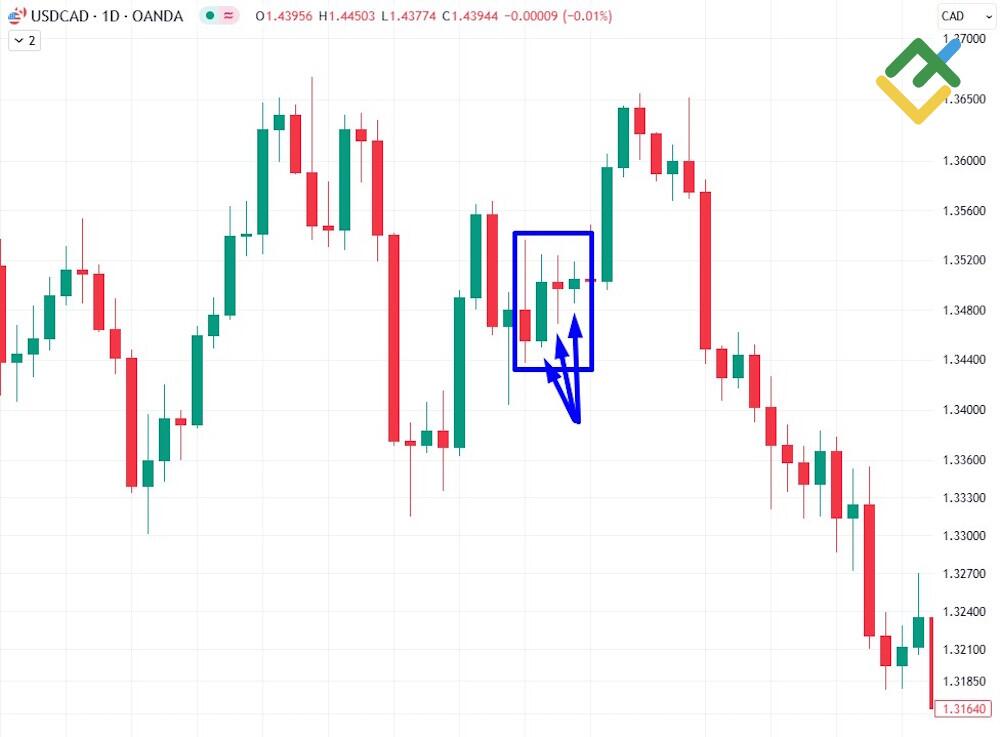
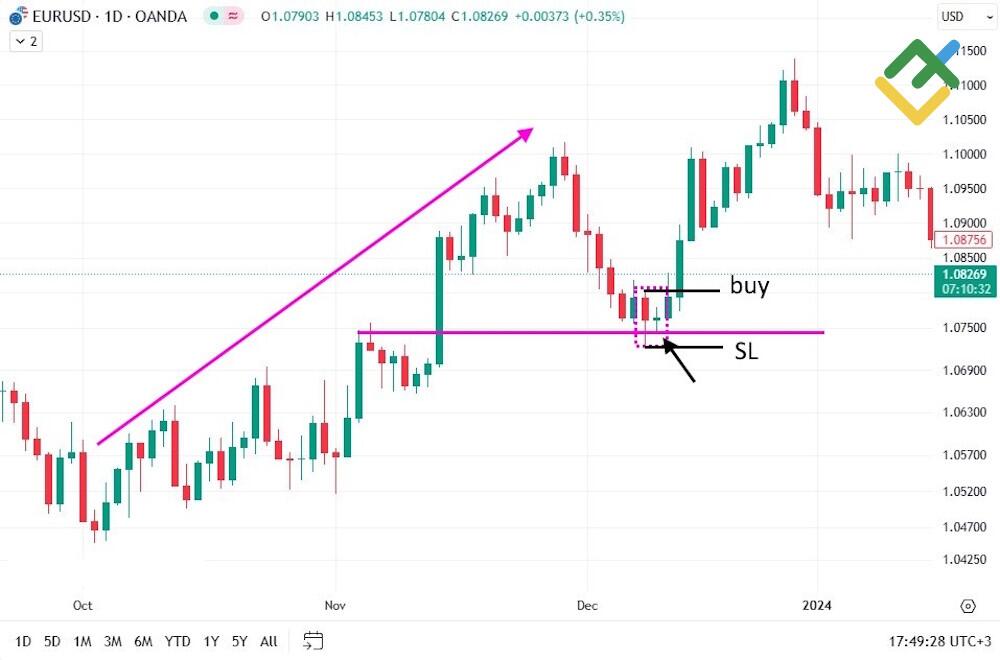
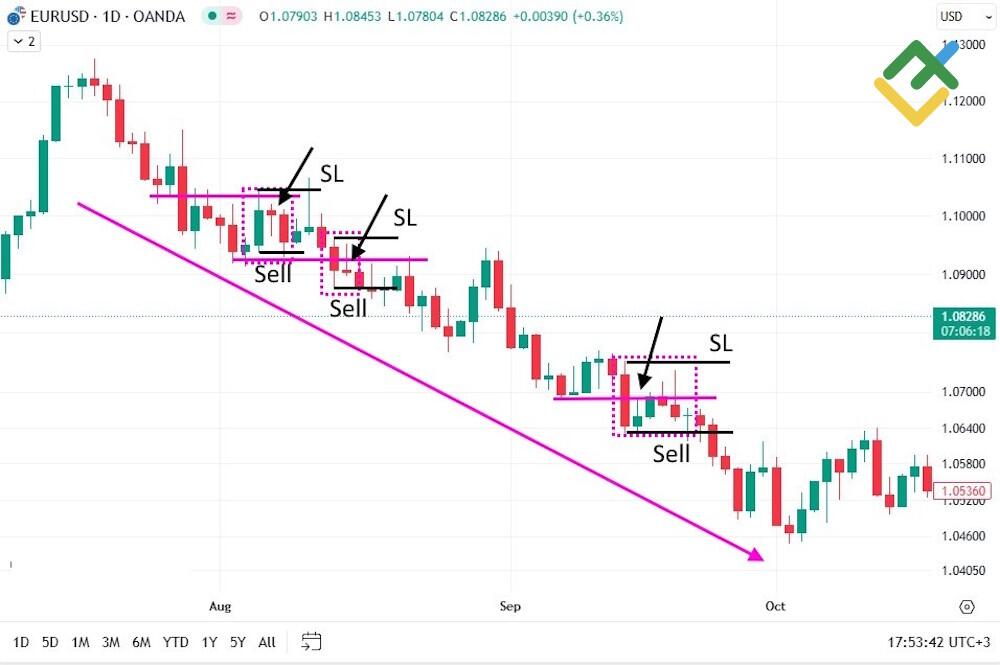
Next, wait for the pattern to occur — the first inside bar. This pattern usually appears after sharp moves in the direction of the trending market. After such a move, the price typically needs some time before continuing.
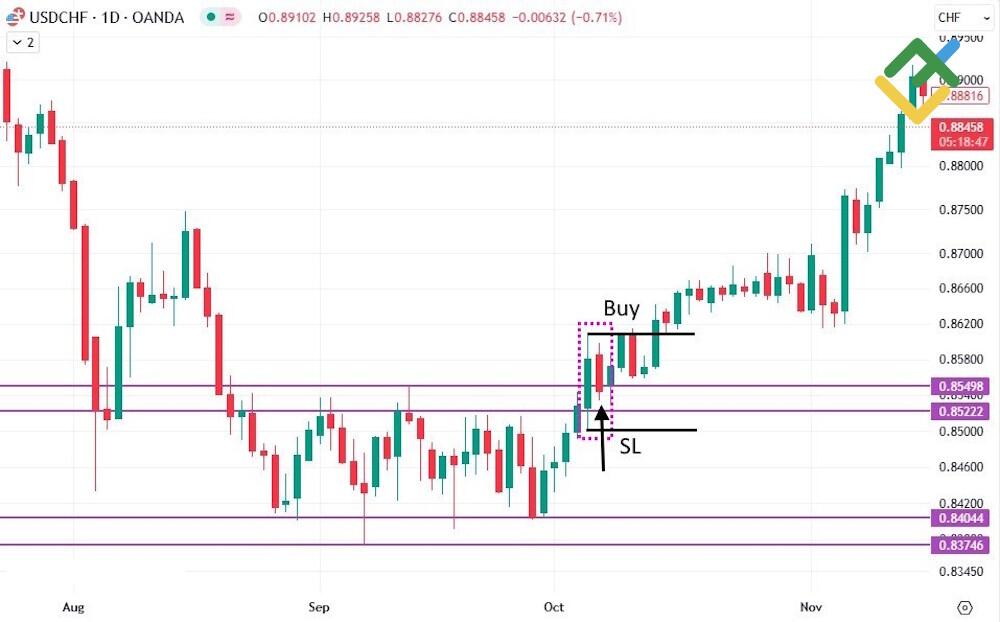
Look for an inside bar on the chart and place a buy stop or sell stop above or below the end of the mother bar to enter on the breakout. Ideally, the inside bar should form near support or resistance.
Using the Inside Bar with a Moving Average
Another common strategy is to look for signals near a moving average during a trending market. Determine the trend using moving averages: 21-day EMA for the short-term trend and 190-day EMA for the long-term.
In an uptrend, the price should be above EMA 21 or above EMA 190. Then wait for a pullback either to the first dynamic support or to the second. After the pullback, look for a market entry for an inside bar.
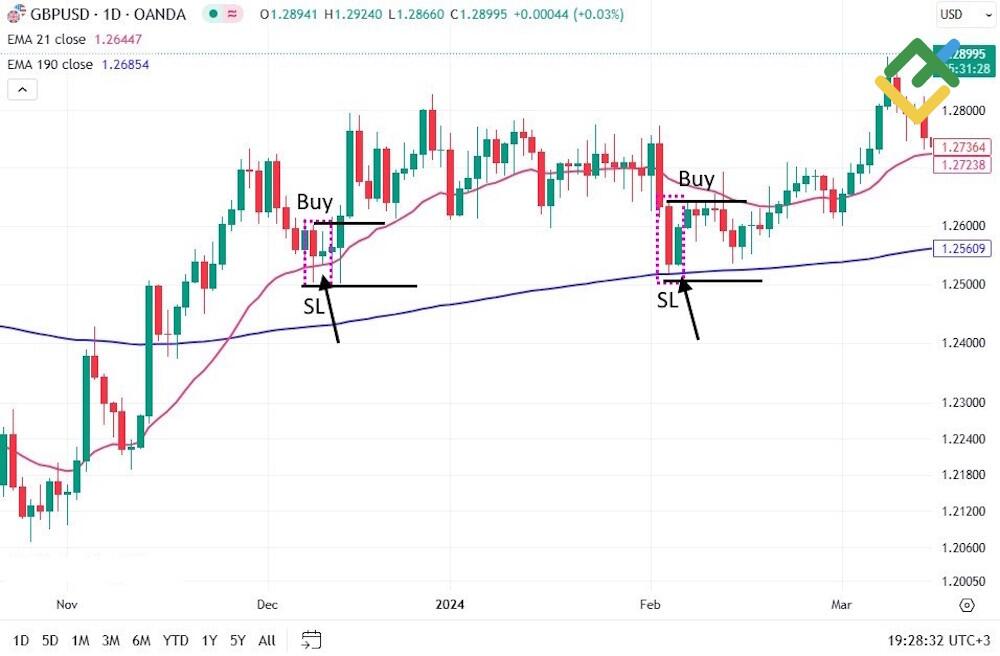
Place a stop loss just beyond the pattern. Set your take-profit level based on a risk/reward ratio of 3:1 or 2:1.
Breakout of Consolidation
The market trends for up to 20% of the time and trades sideways for about 80% of the time. Trading within the range follows slightly different rules. After the price leaves the range, there is usually a strong directional move, which you can exploit by trading breakout patterns like the inside bar.
First, wait for the trend to stop and for a period of consolidation to form. Once the range has clear boundaries with support and resistance levels, look for a breakout as price breaks through the established range. After the breakout occurs, do not place an entry order immediately — wait for an inside bar to appear. After a longer period of consolidation, the breakout can be particularly strong, especially if confirmed by an inside bar.
Tips for Trading Inside Bars
- Trading with the inside bar should follow the trend. It's more likely that an existing trend will continue than that the market will reverse.
- If the previous price movement slowed before the pattern formed and then entered consolidation, a trend change is possible. You can then expect a potential breakout and the formation of an inside bar. Trade in the direction of the breakout.
- In rare cases, the inside bar acts as a potential reversal signal. Only trade these setups after you have mastered trading within a trending market. A reversal doesn't happen out of nowhere — it can be triggered by fundamental factors, false breakouts of key levels, or reaching support or resistance on higher intervals.
- When a key level is broken, you can open a trade and place a stop loss beyond the mother candle. Proper loss placements for an inside bar depend on volatility and market structure. Conservative placements for an inside bar are usually beyond the high or low of the mother bar. If the stop loss is too wide, either skip the signal or confirm it with technical analysis indicators. You can also look for other confirmation signals, such as divergence patterns. In volatile markets, a tight stop loss placement may reduce risk, but could also lead to being stopped out too early.
- Along with the inside bar, explore other price action patterns.
- Sometimes, several smaller candles form within the mother bar.
- Avoid trading the pattern in the middle of a consolidation range.
- If a pin bar forms after our setup, it's a very strong signal.
- If the inside bar forms near support or resistance levels, it offers a more favorable market entry.
- If the price breaks the mother bar in one direction and then quickly reverses to break the opposite extreme — hitting your stop loss in the process — a Fakey pattern may be forming. Consider trading in the opposite direction. This is a strong signal, also known as a "false breakout" or "false pattern."
- The higher the time frame, the more reliable the pattern becomes. For example, an inside bar during a daily chart trend attracts far more attention than one on a lower time frame. More participants notice the indecision in the market, which means more traders are involved in forming the pattern, resulting in less market noise and a higher probability of success. I recommend looking for IB setups on daily charts and above, as they work best on the daily chart.
- A few words about take-profit orders. Close the trade either at support or resistance, or set your take-profit target at two to three times your stop loss. If you believe the move could continue, it makes sense to use a trailing stop.
- Finally, the inside bar alone means nothing, and its candle color is irrelevant. To trade effectively, you need a system — at minimum, one that accounts for key levels; at best, one based on comprehensive technical analysis.
Inside Bar vs. Outside Bar
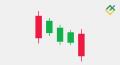
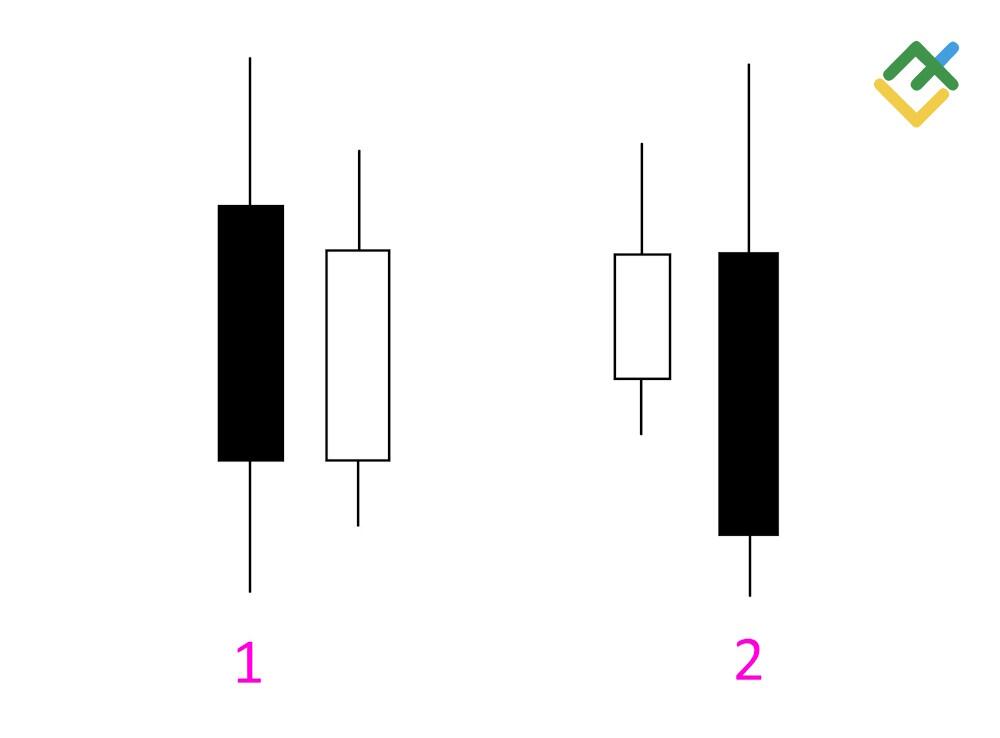
An inside bar is a bar that is contained within the high-to-low range of the previous bar (1 in the screenshot below). An outside bar (2) is a bar that completely covers the trading range of the preceding bar.
Both are two candlestick formations.
Parameters | Inside bar | Outside bar |
Range | Smaller than the preceding bar | Larger than the preceding bar |
Bullish candle | Does not matter — no effect on the pattern | Buy signal |
Bearish candle | Does not matter — no effect on the pattern | Sell signal |
Stop Loss | Beyond the high or low of the entire pattern | Beyond the high or low of the entire pattern |
Market entry | On the breakout of the first candle | On the breakout of the second candle |
As we can see from the table, the outside bar is the mirror pattern of the inside bar.
It completely covers the range of the previous bar and can be either bullish or bearish.
Conclusion
The inside bar is a useful tool for finding market entry points. The pattern primarily generates signals in line with the existing trend. Experienced traders can also use it to trade inside bar reversals.
A key factor in trading the IB is that it should be supported by a strong level, such as support/resistance levels. It's also worth paying attention to other formations. Combining the inside bar with key levels and other patterns helps make more confident trading decisions. If pin bar patterns appear after an inside bar, or the pin bar itself is an inside bar, this is a strong signal./p>
Before using this inside bar setup in your trading, I strongly recommend practicing on a LiteFinance demo account.
Get access to a demo account on an easy-to-use Forex platform without registration
Inside Bar Pattern FAQ
The inside bar in trading is also known as an "inside candle". Sometimes, depending on the context, it may be referred to as a "narrow range bar" (NR bar), especially when the focus is on decreasing volatility.
It all depends on the context: if there was a strong upward move before the bar appeared, the pattern is likely to be a bullish inside bar. If the move was downward, it is likely to be bearish. It is also important to pay attention to the support and resistance levels where the setup appeared.
A false breakout of an inside bar is called a fakey pattern. This means the price triggers your entry order above or below the mother bar, and then quickly reverses in the opposite direction. In this case, you can consider trading in the opposite direction.
If you trade the inside bar with the trend, the probability of success is quite high. When the inside bar appears within corrective patterns, the probability of success drops significantly. Some traders also use it as a potential reversal signal — but only after the preceding trending move has slowed down.

The content of this article reflects the author’s opinion and does not necessarily reflect the official position of LiteFinance broker. The material published on this page is provided for informational purposes only and should not be considered as the provision of investment advice for the purposes of Directive 2014/65/EU.
According to copyright law, this article is considered intellectual property, which includes a prohibition on copying and distributing it without consent.