Financial market participants are constantly seeking effective methods for forecasting price movements. One such method is divergence—when the price chart and a technical indicator move in opposite directions. Divergence can signal weakening momentum or an impending price reversal.
Understanding divergence can help traders assess market conditions more effectively and identify potential entry points. In this article, we will explore the main types of divergence, examine how they form across different markets, and discuss practical ways to incorporate this signal into a trading strategy.
The article covers the following subjects:
Major Takeaways
Divergence is a discrepancy between price movement and a technical indicator's readings. It can signal weakening momentum and indicate a potential trend reversal or correction.
Divergence occurs when the asset's price reaches a new high or low, but the indicator fails to confirm the move and instead forms a weaker corresponding peak or trough. This discrepancy suggests that price momentum may be losing strength and could precede a change in trend direction.
You can use a range of technical analysis tools to identify divergence, including moving average convergence/divergence (MACD), the RSI, Stochastic, CCI, Momentum, OBV, MFI, and the Awesome Oscillator. Oscillators with clearly defined overbought and oversold zones can be particularly useful for this purpose.
Divergences are generally most meaningful when they form near significant support or resistance levels and are confirmed by additional signals. For example, a candlestick reversal pattern or a breakout of a key level can provide confirmation. A stop-loss is typically placed beyond the nearest price extreme, while profit targets can be set around the next significant support or resistance level.
What Is Divergence in Trading?
Divergence in trading is a technical signal that occurs when price action and a technical indicator move in different directions. Traders use divergence to assess the strength of the prevailing strong trend and identify potential reversal points. The key feature of divergence is that price and the indicator form different patterns relative to their respective highs and lows.
For example, the price may reach a new high while the oscillator forms a lower high. Conversely, the price may make a new low while the indicator makes a higher low. Such divergences can indicate weakening price momentum and a potential change in the prevailing trend. However, divergence should not be treated as a standalone trading signal and is best confirmed using other technical analysis tools and market signals.
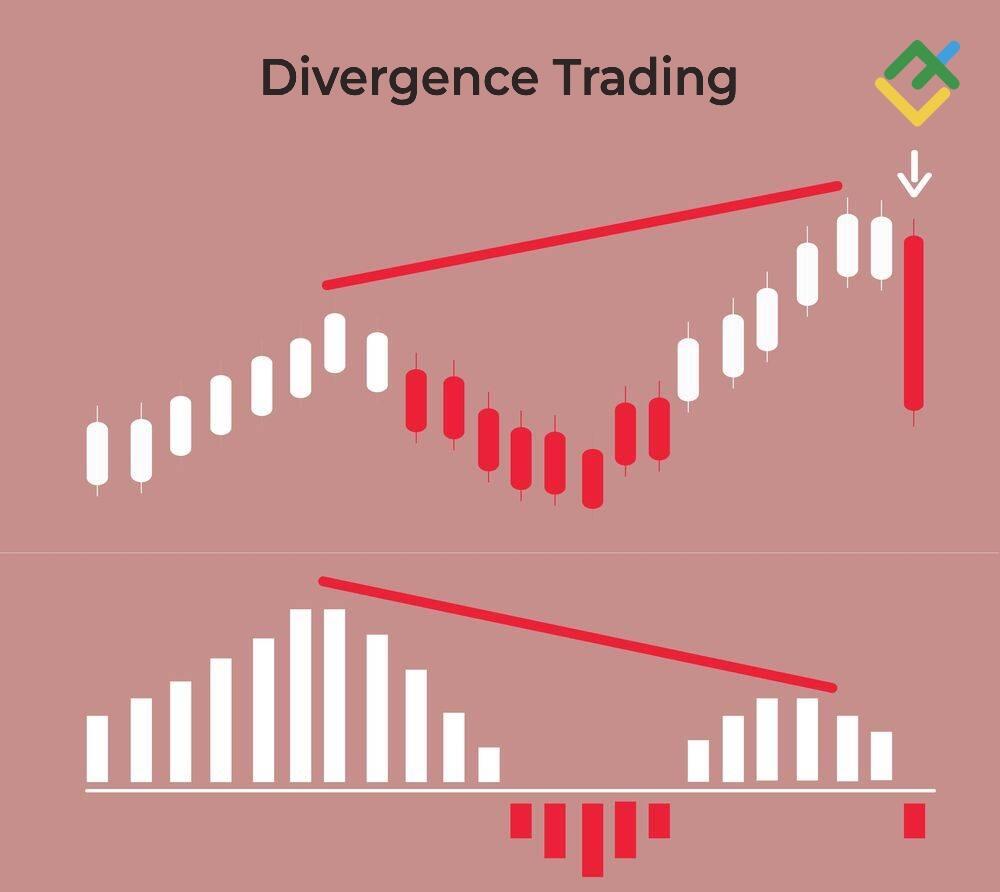
There are two main types of divergence: classic and hidden. Classic divergence may signal a potential trend reversal, while hidden divergence can indicate that the current trend is likely to continue.
What is divergence trading in simple terms? Divergence occurs when the price and a technical indicator move in opposite directions. This discrepancy can signal weakening momentum or a potential trend change. Traders typically use divergence alongside support and resistance levels, volume analysis, and other technical indicators to confirm signals and reduce the risk of false market divergence.
How Divergence Works
Divergence occurs when a technical indicator's trend diverges from price movement. For example, the price reaches a new high or low, but the RSI or MACD does not confirm the new extreme. This may indicate a weakening of price momentum. These useful tools consider not only price changes but also the strength and speed of price movement.

If the price is rising but upward momentum is weakening, the indicator may form a lower high while the price chart reaches a new high. This bearish divergence can signal weakening momentum and a potential trend reversal. The opposite occurs during a downtrend: the price reaches a new low while the indicator forms a higher low. This bullish divergence may indicate easing selling pressure and a downtrend losing strength.
Convergence and divergence describe the relationship between price movements and indicator readings. Divergence occurs when the price and indicator form conflicting highs or lows. Traders can use divergence as an early warning signal of weakening momentum and a possible change in the prevailing trend, although it is generally best confirmed by other technical analysis tools.
Types of Divergence
There are several types of divergence, which can be classified based on the direction of the trend and the nature of the signal. The two main categories are bullish and bearish divergence, each of which can be either classic or hidden. Classic or regular divergence may signal a potential reversal of the prevailing trend, while hidden divergence can indicate that the current trend is likely to continue. Below, we'll examine the characteristics of each type of divergence and explore how they can be applied in trading.
Regular Bullish Divergence
A regular bullish divergence occurs during a downtrend when the price forms a lower low while the indicator forms a higher low. This positive divergence suggests that selling pressure is weakening and may precede an upward trend reversal. Bullish divergence can be viewed as a potential buy signal, but it should be confirmed by additional technical signals. It can be particularly significant when it develops near a key support level.
Here is a bullish divergence example. The price may fall to 1.2000 while the RSI forms a higher low than it did during the previous decline. This creates a bullish divergence. Before entering a trade, traders typically wait for confirmation, such as a bullish candlestick reversal pattern or a breakout above a nearby resistance level.
Classic divergence does not always lead to an immediate trend reversal. The price may continue moving in one direction for some time. Therefore, traders may consider entering a position only after additional signs of an emerging uptrend appear, such as the price crossing above a short-term moving average.
Bullish divergence tends to produce more reliable signals on higher time frames, such as H4 and D1. False signals are more common on lower time frames, so divergence should ideally be confirmed using additional technical tools, such as trend lines, support and resistance levels, or volume analysis.

Regular Bearish Divergence
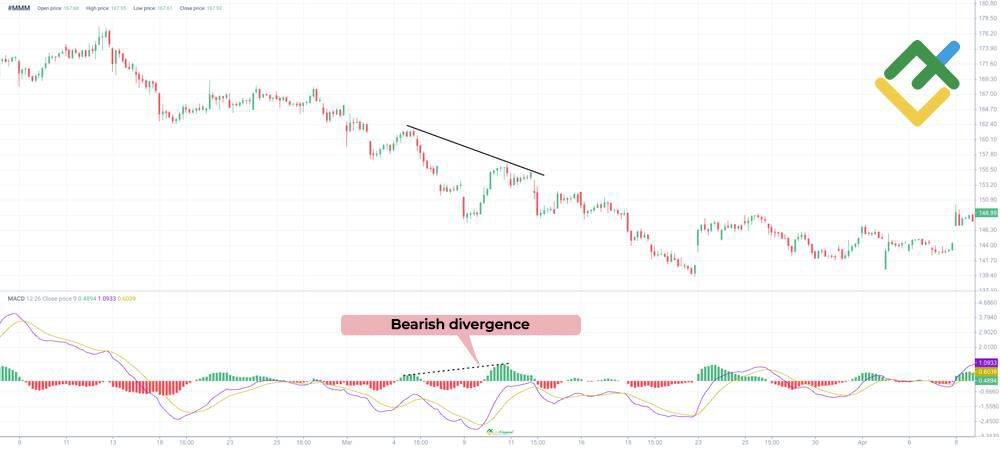
Bearish divergence is the opposite of bullish divergence. Bearish divergence occurs during an uptrend when the price reaches a new high while the indicator forms a lower high. This negative divergence may signal weakening buying pressure and a potential downward reversal.
Classic bearish divergence often develops near significant resistance levels. For example, if the price reaches a new high while the RSI forms a lower high, the divergence may be interpreted as a potential sell signal.
Traders can use bearish divergence to identify potential entry points for short positions. However, it is generally advisable to wait for additional confirmation, such as a bearish candlestick reversal pattern or a break below a trend line, before entering a trade.
Bearish divergence can be either classic or hidden. Classic bearish divergence indicates weakening bullish momentum and may signal a potential reversal or correction, while hidden bearish divergence typically signals the continuation of the prevailing downtrend.
However, the prevailing trend may continue even after a classic divergence appears. Therefore, traders typically wait for additional confirmation before entering a position. For short trades, a stop-loss can be placed above the most recent swing high, while the take-profit target can be set near the nearest significant support level. Bearish divergence should be used in conjunction with other technical signals and proper risk management.
Hidden Bullish Divergence
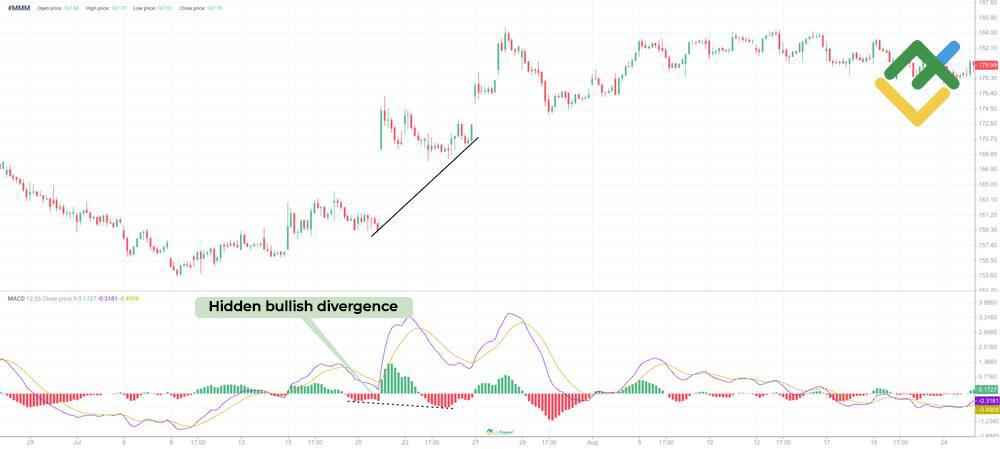
Hidden divergence is a technical pattern that may signal the continuation of the prevailing trend. Hidden bullish divergence occurs during an uptrend when the price makes a higher low, while the indicator forms a lower low.
This divergence suggests that the correction may be temporary and that the underlying uptrend remains intact. Unlike classic divergence, which can signal a potential reversal, hidden divergence points to a possible continuation of the existing trend. Traders can use it to look for entry opportunities after a correction or to add to an existing position.
For example, the price may undergo a correction while remaining above its previous low, whereas the MACD falls below its previous low. This creates a hidden bullish divergence. Such patterns can occur during strong uptrends, when a temporary correction is followed by a resumption of the upward movement.
Hidden divergence requires confirmation, as a divergence between the price and an indicator does not by itself guarantee that the prevailing trend will continue. Additional tools, such as trend lines or moving averages, can be used to confirm the signal.
Hidden bullish divergence can help traders assess the likelihood that the price will resume moving in the direction of the prevailing uptrend after a correction.
Hidden Bearish Divergence
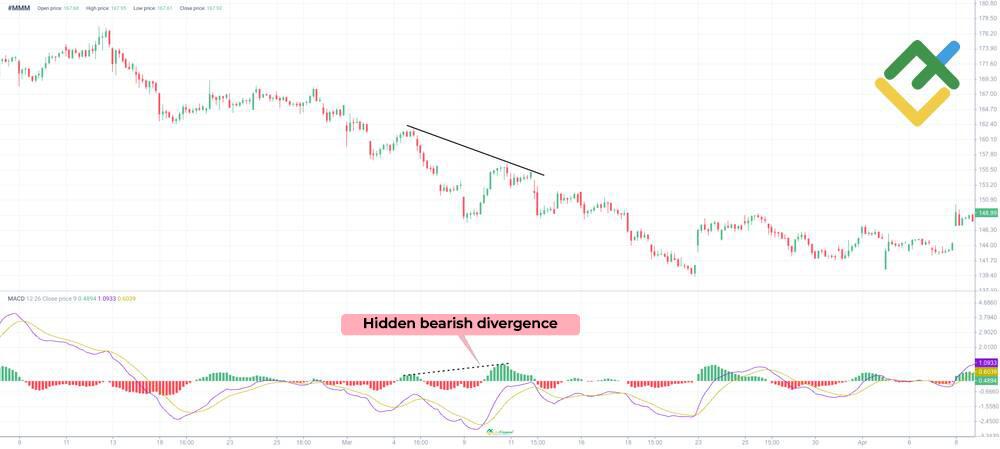
Hidden bearish divergence is the opposite of hidden bullish divergence. It occurs during a downtrend when the price forms a lower high while the indicator forms a higher high. This may indicate that an upward correction is losing momentum and that the broader downtrend is likely to resume.
Hidden bearish divergence often develops during strong downtrends. For example, the price forms a swing high below the previous high, while the MACD reaches a higher high. This pattern may provide a potential sell signal.
Traders can use hidden bearish divergence to identify entry points for short positions in the direction of the prevailing trend. However, additional confirmation is recommended before entering a trade, such as a bearish candlestick reversal pattern or a break below a support level. A rejection from resistance can also strengthen the signal.
In sideways markets, hidden bearish divergence can produce false signals, so it is generally more reliable during a well-defined downtrend. For risk management, a stop-loss can be placed above the relevant swing high, while a take-profit target can be set near the nearest support level or previous low.
Divergence Indicators
Various technical indicators can be used to identify divergence, with RSI and MACD being among the most commonly used.
The Relative Strength Index (RSI) is an oscillator that measures the magnitude and speed of recent price movements. RSI divergence occurs when a price high or low is not confirmed by a corresponding high or low in the indicator.
MACD divergence highlights discrepancies between price movements and the MACD indicator, which is based on the relationship between moving averages. Traders also use the Stochastic Oscillator to identify divergence and assess overbought and oversold conditions, as well as the Momentum Oscillator, which measures the rate of price change.
Notably, divergence is not limited to a single indicator. It can occur whenever price movements are compared with readings from various oscillators and momentum-based technical indicators.
The parameters of a technical indicator should be selected according to the chosen time frame and strategy. To filter out false signals, traders can combine several tools, such as the RSI and MACD. Other indicators, including the CCI and Stochastic Oscillator, can also help identify divergences between price and momentum.
A divergence indicator can be a standalone technical tool that automatically detects discrepancies between price movements and oscillator readings. However, traders can also identify divergence manually by comparing price highs and lows with those formed by an indicator. Momentum indicators such as the RSI can help identify weakening momentum, while the MACD can provide additional confirmation of the signal. Combining multiple technical tools can help filter out false signals and support more informed trading decisions.
How to Trade Divergence Step by Step
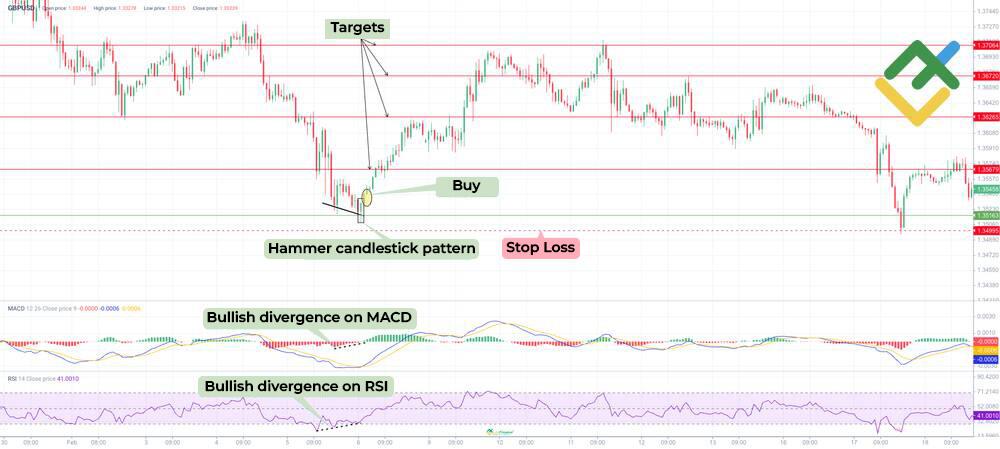
Let's consider a practical divergence setup based on classic divergence day trading. Suppose a bullish divergence forms on the daily chart near a key support level.
The price forms a lower low, while the RSI forms a higher low. A similar signal can be identified using the MACD: the price reaches a new low, while the indicator forms a higher low.
The next step is to wait for confirmation, such as the formation of a Hammer candlestick pattern, which may indicate increasing buying pressure. Once the candlestick closes, traders can consider entering a long position. A stop-loss can be placed slightly below the Hammer's low, while the take-profit target can be set near the nearest significant resistance level, such as the previous swing high.
The choice of a time frame is important when applying a divergence strategy. For intraday trading, traders can use H1 or H4 charts, while D1 is generally more suitable for swing trading. A trade should be considered only after the divergence has been confirmed by additional signals, with price and the indicator forming the corresponding divergence pattern.
This strategy can be applied to stocks, cryptocurrencies, and other financial markets. However, divergence can generate false signals, particularly during periods of high volatility. Therefore, divergence analysis should be combined with other technical tools, while appropriate risk management rules should always be followed.
Start trading with a trustworthy broker
Conclusion
Divergence is a useful technical analysis tool for assessing the strength of a market trend and identifying potential reversal or continuation signals. Bullish and bearish divergence are among the basic patterns used in market analysis, while combining RSI and MACD divergence with other technical tools can help filter out false signals.
However, divergence alone does not guarantee a price reversal or signal trend continuation and should be confirmed by additional signals. When analyzing divergence, traders should also consider the time frame and the broader price structure. Classic divergence can provide clues about a potential trend reversal, while hidden divergence can help identify opportunities for trend continuation. Whether applied to the Forex, stock, cryptocurrency, or other financial markets, divergence is based on the same core principle: analyzing discrepancies between price movements and technical indicator readings.
What is Divergence FAQs
The key difference between divergence and convergence is the relationship between price movement and a technical indicator. Divergence occurs when price and the indicator move in opposite directions, potentially signaling weakening momentum or a reversal. Convergence occurs when price and the indicator move in the same direction.
The most commonly used indicators for identifying divergence are the RSI, MACD, and Stochastic. RSI divergence can respond more quickly to changes in momentum, while MACD divergence may generate signals with a greater lag. The Momentum is also used. Combine multiple indicators to confirm signals and filter out false divergence.
Higher time frames, such as H4, D1, and W1, generally show less market noise and may produce fewer false divergence signals. On lower time frames, such as M5 and M15, divergences occur more frequently but can be less reliable. On H1, it is best to wait for additional confirmation.
Divergence in stocks and cryptocurrencies works much the same way as in other financial markets. Bullish and bearish divergence can help identify weakening momentum and potential changes in trend direction. Traders should pay attention to the time frame, signal confirmation, and the use of additional technical indicators.
Price chart of EURUSD in real time mode

The content of this article reflects the author’s opinion and does not necessarily reflect the official position of LiteFinance broker. The material published on this page is provided for informational purposes only and should not be considered as the provision of investment advice for the purposes of Directive 2014/65/EU.
According to copyright law, this article is considered intellectual property, which includes a prohibition on copying and distributing it without consent.