Divergence is a favorite signal among many traders. It occurs infrequently but allows market participants to determine entry and exit points, knowing when the price direction will change. Divergence is a universal signal that is determined by various indicators. Due to this, to trade bullish or bearish divergences, you do not need to radically change your trading strategy.
The article discusses divergence and its types in detail. You will also learn ways to identify divergences on price charts using the technical indicators MACD, Stochastic, and RSI.
The article covers the following subjects:
What is a Divergence?
Divergence is a classic discrepancy between trend highs and lows on the price chart and indicator readings. Divergence, as a rule, indicates an imminent trend reversal.
It can be used in analysis in combination with any market research methods, for example, Price Action and indicator analysis. Depending on the direction of movement of the trend line, divergences are divided into bullish and bearish.
There is also convergence in the market, which is the opposite of divergence. When conducting technical analysis, many often confuse these concepts. To avoid confusion, in the article, all convergences and divergences of the price direction and technical indicator are called divergence.
The article “Divergence Forex: What is Divergence Trading and How Does it Work” discusses examples of divergence and convergence based on the Double Top and other TA patterns.
What is Bullish Divergence?
A classic bullish divergence is formed before an upward reversal of the current trend. It occurs when the price chart forms a new low and an indicator (for example, the relative strength index RSI) tends to rise. In the case of bullish divergence, convergence occurs along lines drawn along the minimum indicators of the indicator and chart. To better understand it, let's look at the bullish divergence pattern as an example.
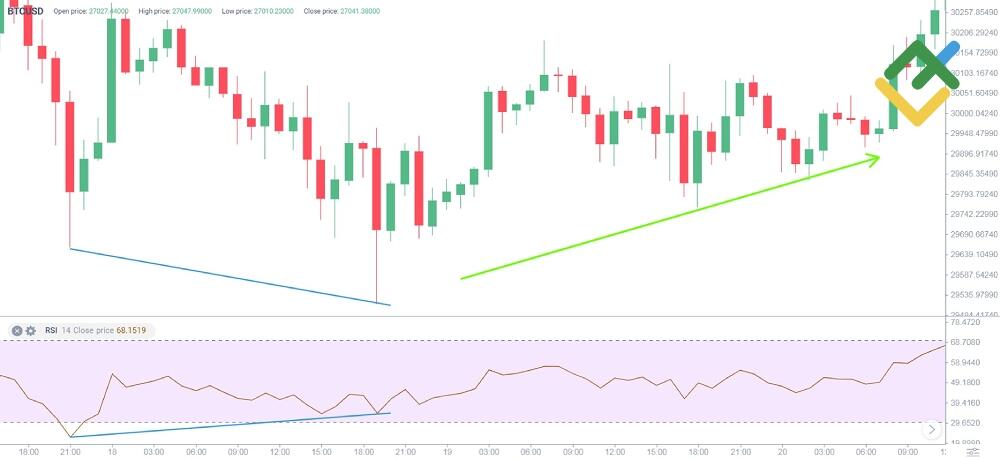
The BTCUSD chart above shows a bearish trend and an increase in the RSI technical indicator curve. The blue lines drawn along the minimums of the indicator and the price chart differ in direction, that is, a sign of divergence. This strong signal subsequently results in a change in market sentiment to bullish.
There is also a hidden bullish divergence. Its signal and meaning are the opposite of the classical divergence. With hidden divergences, the lines drawn from the lows diverge. For some time after the signal is formed, the bullish trend continues.
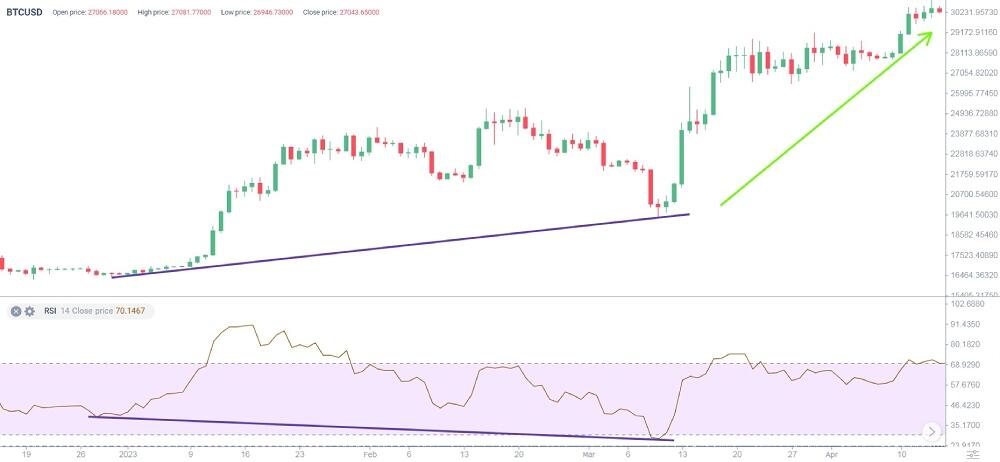
Above is an example of a hidden bullish divergence. Please note that the price chart shows increasing low levels, while in the RSI window, the previous local low was higher than the next one. As a result, the signal lines indicate a divergence.
Hidden bullish divergence signals trend continuation. After the signal is formed, the market does not seek to change direction but, on the contrary, maintains a strong uptrend.
What is Bearish Divergence?
Bearish divergence indicates that the trend is weakening, and the upward direction will soon reverse. It occurs when an upper maximum is formed on the price chart, exceeding the previous one, and a smaller maximum is formed on the stochastic indicator.
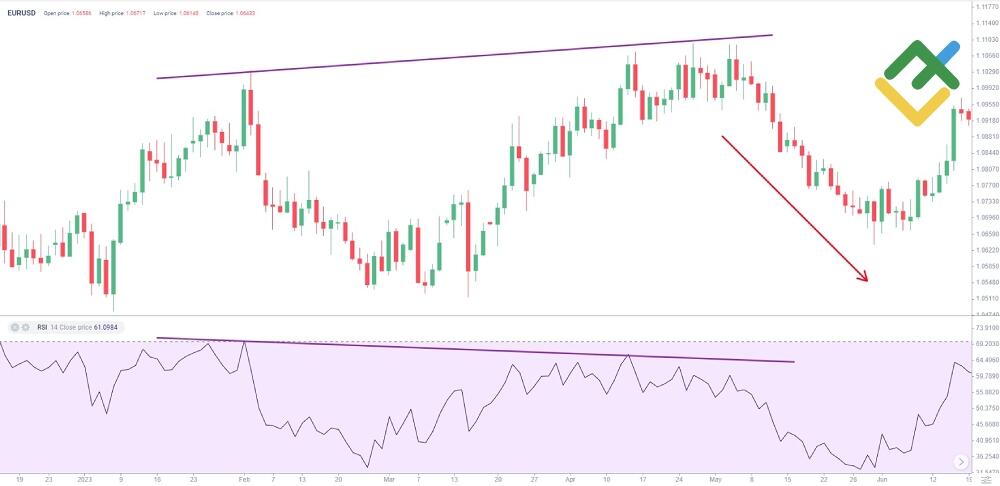
Above is an example of bearish divergence. The EURUSD price chart shows increasingly higher highs and the RSI indicator window shows increasingly lower highs. Therefore, we can conclude that there is a classic bearish divergence and a subsequent downward price reversal.
Hidden bearish divergence occurs on downtrends when the price chart forms lower maximums and the indicator chart forms higher maximums. That is, the lines drawn along two local maxima converge. This figure indicates that signals for a trend reversal are false, that is, a continuation of the downward price movement.
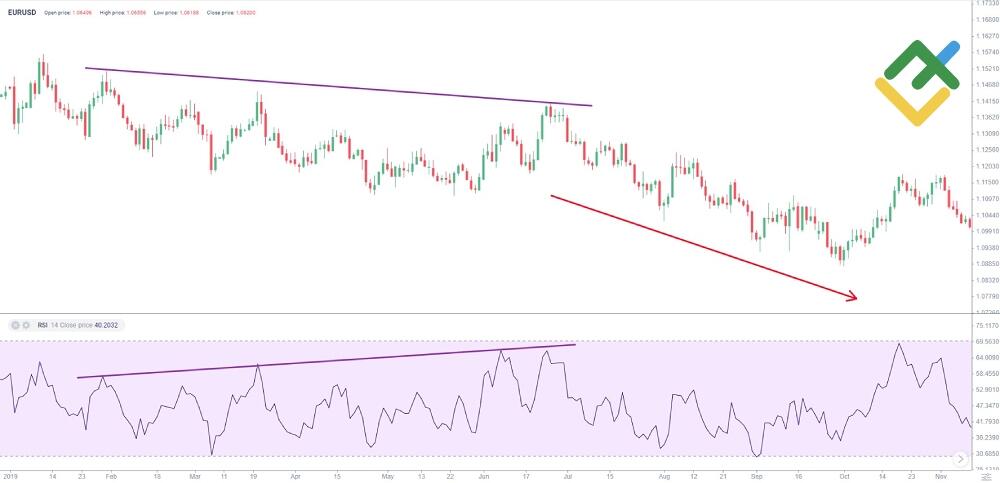
The chart above shows how a hidden bearish divergence occurs. After the formation of such a bearish divergence, the downward momentum continues to move and increases the downward slope.
How to Identify Bullish and Bearish Divergence
To identify a bullish divergence pattern, a prolonged trend and the formation of a double bottom pattern are required. Let's search for divergence using the EURJPY currency pair as an example.

The weekly chart above shows a long-term bearish trend with a double bottom forming (marked in blue). This is the most suitable place for the formation of bullish divergence.
By connecting the local lows in the found pattern, you can see that the signal line has a downward slope.
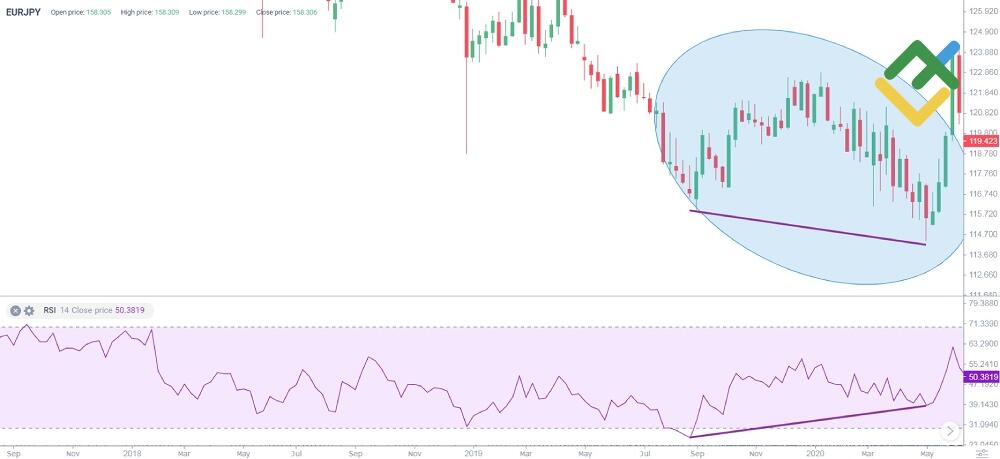
Let's draw a similar line on the RSI indicator chart. We see that the signal lines of the price chart and the indicator are different. The highest RSI minimum within the pattern, coinciding with the lowest price point, indicates the formation of a bullish divergence and an imminent trend reversal.
The market entry point appears immediately after the price impulse is indicated. This is clearly visible in the chart above. In this case, the stop loss should be below the local price low.
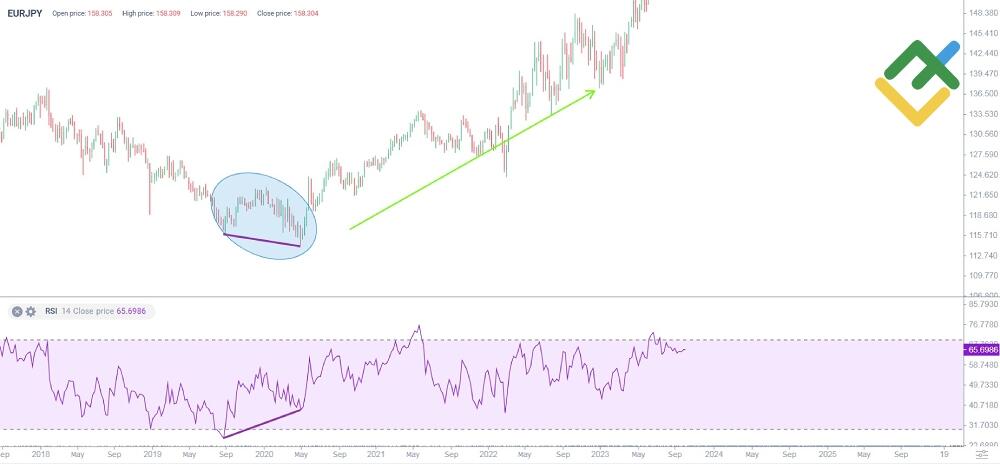
As a result of the bullish divergence, there was a change in market sentiment, and the current upward trend was formed.
To search for divergences, you can use not only RSI but also any other technical analysis indicators. Let's take a look at the chart below to confirm the divergence using the MACD indicator.
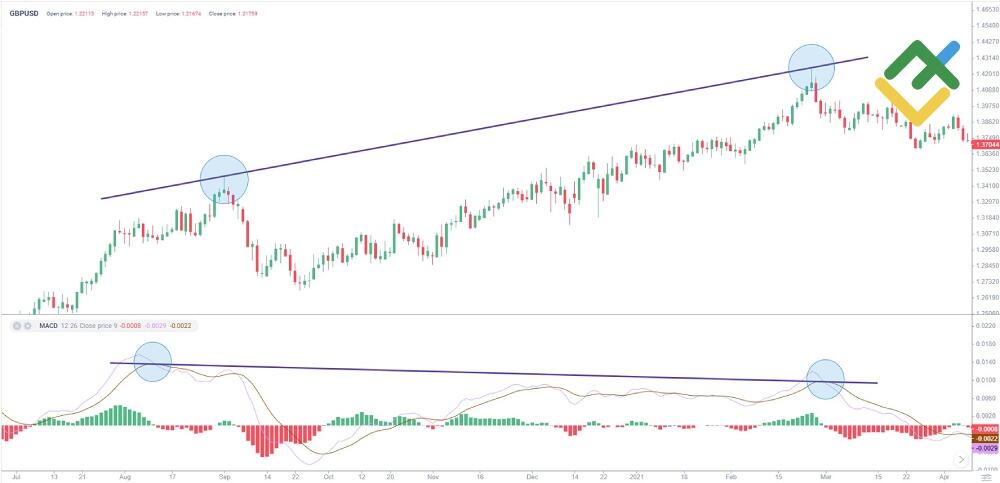
In the GBPUSD chart, blue circles mark the local highs of the price chart and MACD indicator. They show that the indicator's high does not correspond to the highest maximum of the price. The signal lines drawn along the marked points diverge. Therefore, bearish divergence occurs.
Note that when using MACD to determine divergence, it is better to use the highs of a smoothed moving average, which represents the state of the market without short-term noise.
Thus, to determine divergence, the extreme points of the price chart and the indicator of the same time order and the same type are always used. In other words, price highs are compared with indicator highs, and price lows are compared with indicator lows.
Bullish and Bearish Divergence Trading Indicators
To identify divergence, you can use any indicators that display market volatility. However, there are nuances here that are worth paying attention to.
For example, indicators with a large lag may give false signals. Therefore, most traders use the popular oscillators RSI, MACD, and Stochastic Oscillator to trade divergences.
MACD
The MACD indicator shows the convergence and divergence of moving averages, one of which is fast, with a minimum period, and the other is a signal one, smoother and slower. In addition to these two lines, the indicator displays a histogram showing the difference between the two curves. The greater the distance between moving average points, the longer the histogram column.
Divergence using the MACD indicator can be constructed in two ways:
according to the signal line (as in the example above);
according to histogram columns.
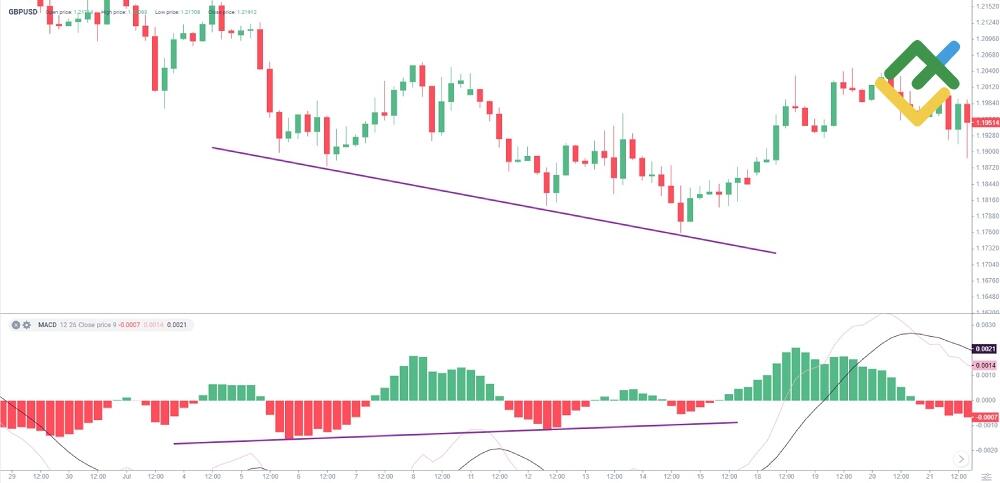
The chart above shows that prices fall. In other words, there is a downward movement with the lows updating. At the same time, an increase in the minimums on the MACD histogram is visible. By all indications, this is a classic bullish divergence, so expect an upward price movement.
Stochastic Oscillator
The stochastic oscillator shows the position of the current price relative to the price range for the time period selected by the trader. This indicator determines the future direction of the current trend, its strength, and overbought and oversold levels.
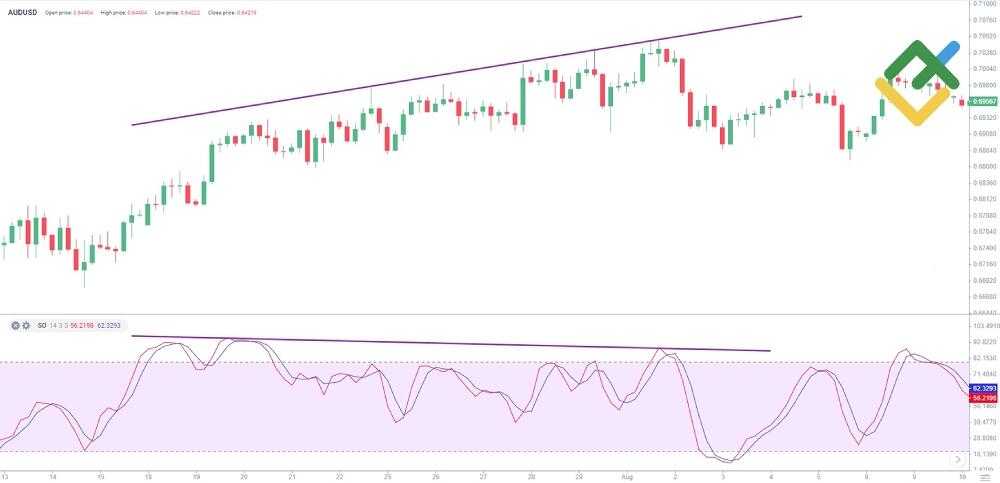
Stochastic is also used to identify a divergence signal. It is built along the indicator line, which displays changes in the market with minimal delays. The picture above shows bearish divergence detected using the stochastic oscillator.
RSI
RSI, or the Relative Strength Index, is one of the most used indicators for identifying divergences. The indicator displays the relationship between positive and negative price changes. Using RSI, traders can monitor price trends, their strength, and the level of market volatility and also look for reversal points.
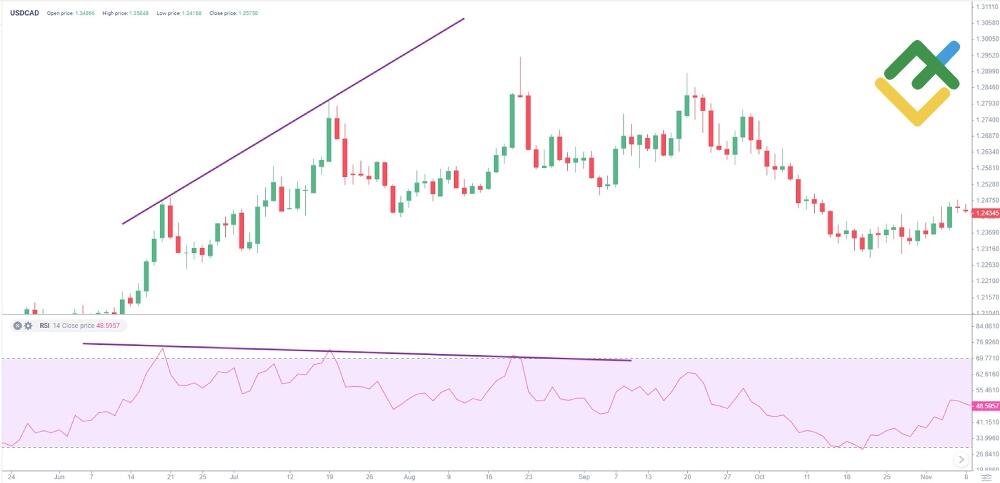
Divergences on the RSI indicator are plotted at the highs of the signal line, as in the chart above. Often, divergences cascade, forming one after another. The signal can be additionally confirmed by the overbought or oversold market, that is when the chart goes beyond the 30% and 70%.
The chart shows that at the moment of divergence, there was an overbought market. This means that the bullish trend is weak and will end soon.
Bollinger Bands
Bollinger Bands are trend indicators that show the direction of price and the strength of market trends. It consists of a moving average and standard deviations that form a price channel.
Identifying divergences using Bollinger Bands differs from the methods discussed earlier. This indicator helps filter divergences and confirm them.
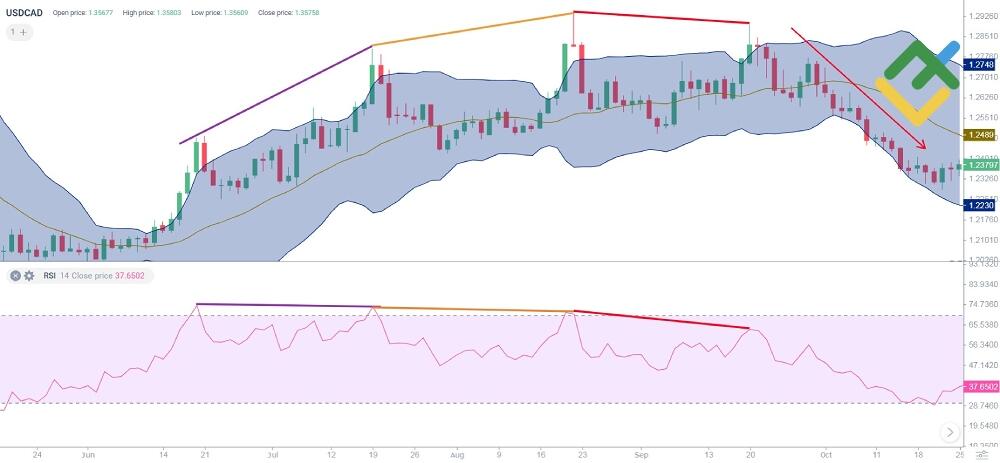
To identify convergence and divergence, you still need an oscillator. The chart above shows a bearish divergence using RSI. One of the Bollinger Bands features is that entering an overbought or oversold market is also considered a divergence.
Also, the chart above shows several divergences in a row. The purple and orange lines highlight the usual bearish divergences plotted on the price chart. The last divergence, marked with a red line, is not visible. However, using Bollinger Bands, you can find that the price has moved beyond the upper line into the overbought zone. At the same time, in the RSI indicator window, the line remained in the market equilibrium area. This is a false price movement divergence, which is the last among consecutive divergences.
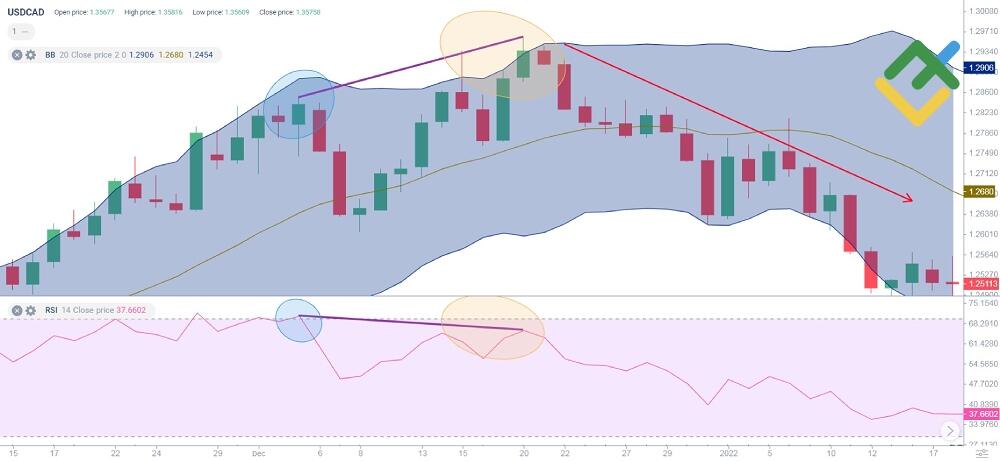
The chart above shows another example of using Bollinger Bands. The blue circle marks an early reversal signal, where the RSI curve entered the overbought zone, and the price chart remained in the indicator bands zone. Then, you can see the formation of a classic bearish divergence, confirmed by indicator signals. The price extremes in the orange circle are higher than the previous ones and go beyond the borders of the bands. The highs of the indicator curve are lower and are in the market equilibrium zone. The signal is confirmed by a large red candle. In this situation, it is reasonable to enter short trades.
Conclusion
Divergence is a universal trend reversal and continuation signal that works on any time frame. It is relevant for crypto assets, currency pairs, stocks, and other trading instruments. The main advantage of divergence is that its signal is leading.
At the same time, it would be a big mistake to base a trading strategy solely on divergence. Like all leading indicators, divergence is often false. At the same time, divergence signals can qualitatively improve trading, increase forecasting accuracy, and reduce the backlog.
Bullish and Bearish Divergence FAQs
Divergences can be either bullish or bearish. Bearish divergences indicate an upcoming price decline, while bullish divergences indicate its growth.
Depends on what your position is in the market. If you are looking for an exit point from the market, selling assets, or planning to enter short trades, then this is definitely a good signal for you.
Oscillators such as Awesome Oscillator, Stochastic, MACD, and RSI are best suited for identifying divergences on a chart. Using Bollinger Bands and the oscillator to find divergences is suitable for beginners. Advanced traders often look for divergences using on-balance volume.
Classic bullish divergences occur in a bearish trend and precedes an upward reversal. They occur when the oscillator lows do not update following the price. It is important to consider that divergences can follow one another, so to make a final trading decision, you need to wait for confirming signals.
A classic bearish divergence appears on a bullish trend before a downward reversal. It is easy to identify at the moment when the oscillator highs do not update following the price. After the formation of a bearish divergence, wait for a confirmation signal and only then open a short trade.
Many people mistakenly believe that divergence is exclusively a reversal signal. It is important to understand the types of divergences and correctly identify them. Classic divergence indicates a trend reversal, while hidden and extended ones indicate its continuation. It must be taken into account that these signals can be formed in a row one after another. Therefore, it is necessary to confirm divergences using other trading instruments and market reaction.
Divergence can be considered triggered if it is accompanied by a strong market momentum. The more consecutive divergences there are, the stronger the trend can be expected. They can also be confirmed by identifying other divergences at higher and lower timeframes.
If the RSI divergence with the price occurs at the highs of a bullish trend, it indicates a downward reversal. If the divergence occurs at the lows, it is a normal bullish divergence, which serves as a signal for an upward reversal.
Based on the trend direction, divergences are divided into bullish and bearish. According to their structure, signals, and method of definition, divergences can be classical, hidden, and extended.
Bearish divergence is a leading signal of a future downward price movement based on the divergence between the extremes of the price and the indicator (oscillator).
Divergence in stocks is no different from divergence in other trading instruments and in the Forex market. It is determined according to the same principles and gives the same signals.
Bullish regular divergence occurs when the price chart in a bear market forms lower lows and the indicator forms higher lows. It precedes an upward price reversal.
The content of this article reflects the author’s opinion and does not necessarily reflect the official position of LiteFinance broker. The material published on this page is provided for informational purposes only and should not be considered as the provision of investment advice for the purposes of Directive 2014/65/EU.
According to copyright law, this article is considered intellectual property, which includes a prohibition on copying and distributing it without consent.