A trader's solid grasp of candlestick patterns is essential for identifying potential market moves. Understanding candlestick patterns, particularly the bullish belt hold, is crucial for traders to spot potential market reversals. This guide delves into the bullish belt hold, covering its appearance, underlying psychology, and trading tactics.
Recognizing this pattern can significantly improve success in breakout trades and new uptrends. Ideal for seasoned and aspiring price action traders, this resource enhances your technical analysis skills, focusing on the bullish belt hold to identify high-probability market opportunities better. Dive into this guide to master a key candlestick signal and elevate your trading strategy.
The article covers the following subjects:
Bullish Belt Hold Definition
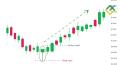
In the trading world, the Bullish Belt Hold pattern is a harbinger of change, especially noteworthy amidst a downtrend. It signals a possible pivot in market trends.
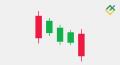
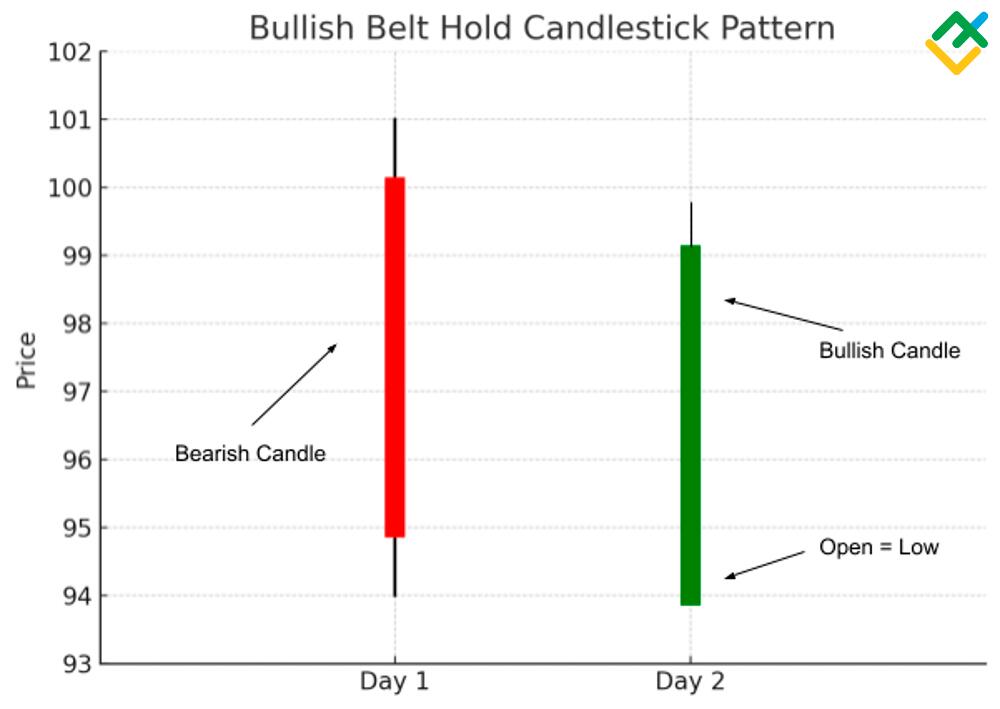
A distinctive two-candle formation marks this pattern. It begins with a bearish candle, indicative of a continuing decline. The plot thickens the following day: the market opens at a lower point, forming a gap. Yet, as trading unfolds, the scenario shifts dramatically. The market bridges this gap and achieves a close that is at par with or surpasses the previous day's close. This second candle, the belt hold, is a strong marker of a likely bullish turnaround.
For traders, the emergence of this pattern is a critical juncture. The bearish trajectory may be waning, potentially ceding ground to bullish influences. The crux of this pattern is its second candle, which, despite a lower start, finishes with vigor, signifying a pivotal transition in market forces from bearish to bullish tendencies.
What Does a Bullish Belt Hold Tell Us About the Market?
The Bullish Belt Hold pattern emerges during a downtrend, marked by a long bearish candle followed by a gap down. However, the key lies in the subsequent action: the price recovers the gap and closes near the previous candle's close. This movement is a strong hint that the bears are losing their grip and the bulls are starting to take charge.
For traders and investors, recognizing a Bullish Belt Hold can be a strategic signal to consider long positions, as it often precedes a new bullish phase in the market. However, it's crucial to approach this pattern cautiously and corroborate it with other market indicators and analyses.
Bullish Belt Hold Examples
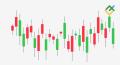
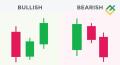
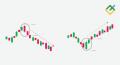
The Bullish Belt Hold pattern is identified by a prominent bullish (green) candle, notable for its opening at the day's low and closing near the day's high. This formation typically follows a downward trend, hinting at a possible trend reversal. Preceding this pattern, one usually observes a series of bearish (red) candles.
In the realm of Forex trading, the Bullish Belt Hold often makes its presence known after a currency pair has experienced a significant downtrend. This is marked by a long green candle, which represents a substantial surge in buying activity. When it comes to the stock market, this pattern tends to surface amid bearish periods. Here, the candle begins trading at or close to its lowest point of the day and concludes near its peak, suggesting a potential transition to a bullish market phase.
In the commodities sector, particularly with assets like gold or oil, this pattern also plays a critical role. It indicates a potential pivot point after a period of decline. The elongated bullish candle in this scenario is a clear sign of heightened buying interest, which may herald the onset of a prolonged upward movement.
Start trading with a trustworthy broker
How to Trade the Bullish Belt Hold
Understanding how to trade this pattern effectively can enhance your trading strategies. Here are some approaches.
Delaying the Entry
One key strategy is delaying entry after identifying a Bullish Belt Hold. This pattern only sometimes leads to an immediate trend reversal. Sometimes, the market may continue its downward trajectory before the bullish trend takes hold. By waiting, the market can reveal its direction following the pattern. This delay can confirm the signal's strength and avoid premature entries.
Applying Market Breadth or Sentiment Indicators
Incorporating market breadth or sentiment indicators can significantly bolster your trading strategy. These indicators provide a broader market perspective, helping you understand whether the overall market conditions support the Bullish Belt Hold signal. For instance, if most stocks are declining but the stock you're analyzing shows a Bullish Belt Hold, it might indicate a stronger bullish sentiment for that particular stock. This approach helps make more informed decisions by considering the market's aggregate state.
Measure the Length of the Current Trend
The efficiency of the Bullish Belt Hold pattern also depends on the duration of the preceding bearish trend. If the current downtrend has extended beyond the average trend length for your market and timeframe, the likelihood of a successful reversal may increase. Measuring the average length of past trends provides a benchmark, helping you gauge the potential for a trend reversal when the Bullish Belt Hold appears.
Bullish Belt Hold Trading Strategies
The Bullish Belt Hold pattern offers valuable insights for spotting trend reversals. Two strategic approaches enhance the pattern's effectiveness, combining it with technical analysis tools for more precise trading decisions. These strategies aim to optimize Bullish Belt Hold's potential in diverse market scenarios.
Trading Strategy 1: Bullish Belt Hold With Gap Condition
The Bullish Belt Hold pattern, a significant indicator in trading, becomes particularly potent when combined with a gap condition. This strategy focuses on the pattern's gap between the first bearish and the second bullish candle. The key here is to measure the size of this gap: a more significant gap indicates a more substantial buying pressure, which could signal the start of a new bullish trend.
Traders often quantify this by using the Average True Range (ATR) indicator. The strategy is straightforward: enter a long position when a Bullish Belt Hold pattern appears with a gap more significant than the current ATR. This approach capitalizes on the momentum generated by the shift from bearish to bullish sentiment, aiming to capture the early stages of a trend reversal.
Trading Strategy 2: Bullish Belt Hold With Moving Average Distance Filter
This strategy focuses on the relationship between the Bullish Belt Hold pattern and its position relative to a significant moving average, typically the 200-period moving average. The idea is to identify a Bullish Belt Hold pattern during a downtrend, confirmed by the stock's price being below the moving average.
To add an extra layer of precision, this strategy employs a distance filter: the closing price of the Bullish Belt Hold should be below the moving average minus five times the ATR. This filter ensures that the pattern is not just a random fluctuation but a potential reversal point in a strong downtrend. The trade is executed when these conditions are met, aiming to ride the reversal wave as the market sentiment shifts from bearish to bullish.
Conclusion
In conclusion, the Bullish Belt Hold Candlestick Pattern is a crucial indicator of potential market reversals, particularly valuable after a period of bearish momentum. This pattern, marked by a distinct candlestick formation, signals a shift from bearish to bullish sentiment, suggesting a takeover by bullish forces. Traders must recognize this pattern as it often precedes the onset of a new bullish phase.
However, caution and corroboration with other market indicators are advised to confirm the pattern's reliability. The Bullish Belt Hold is a crucial tool in a trader's arsenal, offering insights into market dynamics and aiding in strategic decision-making for prospective bullish trends. Understanding and leveraging this pattern can significantly enhance trading strategies, especially with other technical analysis tools.
Platform where traders earn more

Trade on LiteFinance’s high-tech ECN platform and open an account so that beginner traders can copy you. Earn a commission for copy trading and boost your income.
Bullish Belt Hold Candlestick Pattern FAQs
The bullish belt hold is a two-candle pattern signaling a potential trend reversal from bearish to bullish price movement in the stock market.
It shows a bullish candle opening lower but closing near the prior candle's close, indicating buyers overtaking selling pressure, which hints at waning bearish sentiment.
A bullish stock exhibits rising price action, high trading volumes reflecting investor optimism, an up-trending 20- or 50-day moving average, and improving financial metrics.
Yes, stocks in established uptrends fueled by solid fundamentals and positive market narratives tend to produce strong returns over the intermediate term.
It's generally better to buy stocks or index funds during bull markets as optimism propels valuations higher over time versus attempting to time tops and sell into strength.
While not definitively predictive, the pattern offers valuable clues regarding shifting market psychology from bearish to bullish, which often precedes new uptrends.
Strategies like breakouts from consolidations, pullbacks to rising moving averages, and momentum continuations harvesting persistent uptrends can profit from sustained bull runs.
Bull markets feature rising prices, high volumes, and greed & euphoria - bear markets exhibit declining valuations, diminishing activity, and fear.
Though there is no definitive timeframe, bull runs in stocks tend to last 2-3 years on average — but can persist for over a decade in robust economic expansions.
Excessive valuations, tightening monetary policy, business/profit growth restrictions, cascading technical selling, and recessions can all end bullish advances.

The content of this article reflects the author’s opinion and does not necessarily reflect the official position of LiteFinance broker. The material published on this page is provided for informational purposes only and should not be considered as the provision of investment advice for the purposes of Directive 2014/65/EU.
According to copyright law, this article is considered intellectual property, which includes a prohibition on copying and distributing it without consent.