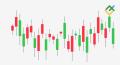
Continuation patterns are reliable indicators that signal a high probability that the existing trend will persist. According to 2025 data, continuation candlesticks have a 73.7% reliability when correctly identified and confirmed by technical analysis.
This article reviews the most effective bullish and bearish continuation patterns, explains how to spot them on charts, and explores trading strategies based on trading signals. It also covers several methods using technical analysis confirmation to evaluate signal reliability.
Trading statistics on the reliability of continuation patterns in 2025:
- The average success rate ranges between 56% and 91.51%.
- The most reliable formations are Bullish/Bearish Flag, Rising/Falling Three Methods, Three White Soldiers, and Separating Lines patterns.
- These patterns are effective in Taiwanese and Japanese stocks (84%); Apple, Tesla, IBM, Amazon, and Google stocks (75.38%); EUR/USD (88.35%) and GBP/USD (90.72%); and the Nasdaq 100 (90–93%).
- The best confirmation indicators are the RSI, MACD, and simple moving average (SMA).
The article covers the following subjects:
- Major Takeaways
- What Is a Continuation Candlestick Pattern?
- Top Candlestick Continuation Patterns
- How to Avoid False Breakouts
- Rules to Follow When Using Candlestick Continuation Patterns
- Common Trading Pitfalls and Psychology
- Pros and Cons of Using Candlestick Continuation Patterns
- Conclusion
- Continuation Candlestick Patterns FAQs
Major Takeaways
- Continuation patterns emerge after an impulse price movement and suggest that the primary trend will continue after consolidation.
- They emerge from a temporary balance of market forces, followed by a resumption of growth or decline.
- Trades are opened in the direction of an established trend after confirmation, with a stop-loss order set above or below a consolidation area.
- Continuation patterns are used in trend-following strategies. Signals are confirmed by trend indicators (MACD, SMA, Bollinger Bands) and volume indicators (Volume, MFI, OBV, A/D, VWAP). Entry points and take-profit levels based on key levels and liquidity zones (order blocks and Fibonacci levels).
- Pros are a high probability of profitable trades. Cons are false breakouts; additional signal verification is required.
- Bullish continuation patterns and bearish continuation patterns are more effective on H1, H4, and D1 in liquid markets (Forex, stocks, and cryptocurrencies).
What Is a Continuation Candlestick Pattern?
A continuation pattern is a candlestick formation that signals the continuation of the current trend after consolidation.
The candlestick psychology is as follows: during a period of consolidation, there is a struggle between bulls and bears, but the pattern indicates that the dominant force remains in control and the trend is likely to continue. Analysis of Japanese candlesticks helps understand market sentiment and make informed trading decisions, while taking technical analysis into account.
Continuation chart patterns show that the trend is sustainable, while reversal patterns signal a possible trend reversal.
Continuation candlestick patterns:
- Indicate a trend continuation.
- Appear after consolidation or correction.
- Reflect the prevailing sentiment in the existing trend.
- Require confirmation from other technical analysis tools.
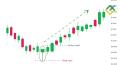
Top Candlestick Continuation Patterns
Candlestick patterns that signal a trend continuation indicate a temporary pause in directional price movement. These patterns help you assess the probability of a trend resuming after consolidation. You can use them to open a profitable trade with minimal risk.
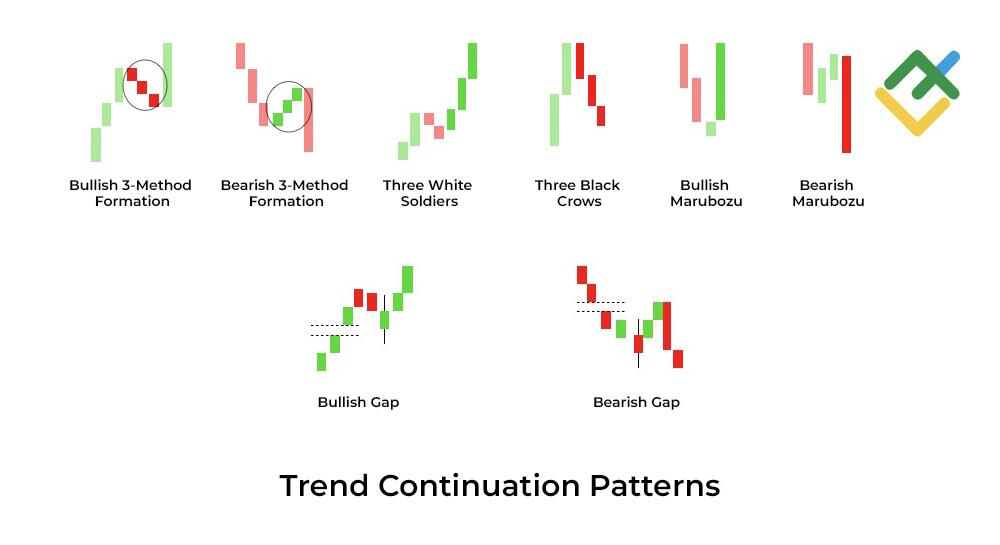
Gaps
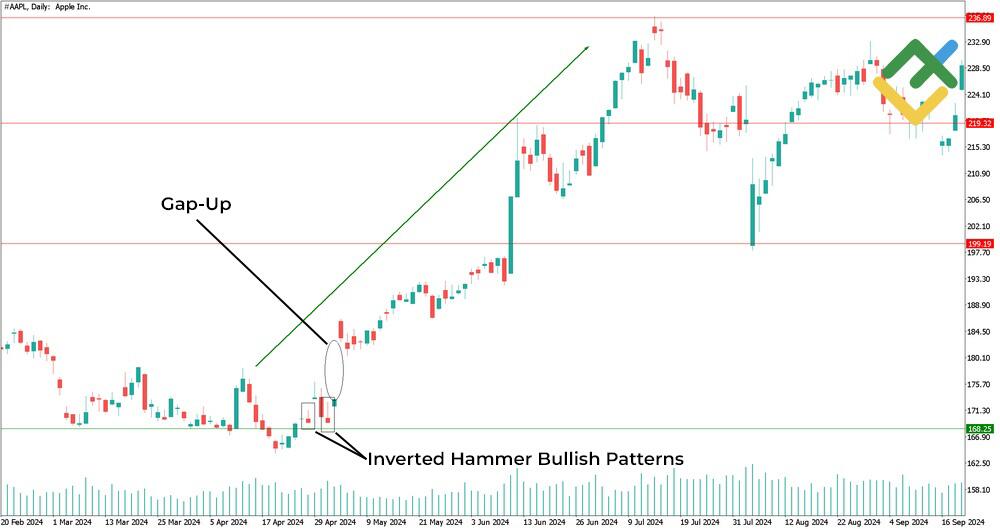
A price gap is a significant break in the price chart that occurs when the opening price of a candlestick differs substantially from the previous candlestick's closing price. For example, a gap that occurs in the Bearish Tasuki Gap continuation pattern signals the strength of the trend.
Quote history shows that patterns confirmed by a gap are 15–20% more likely to reach their target profit level.
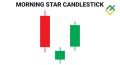
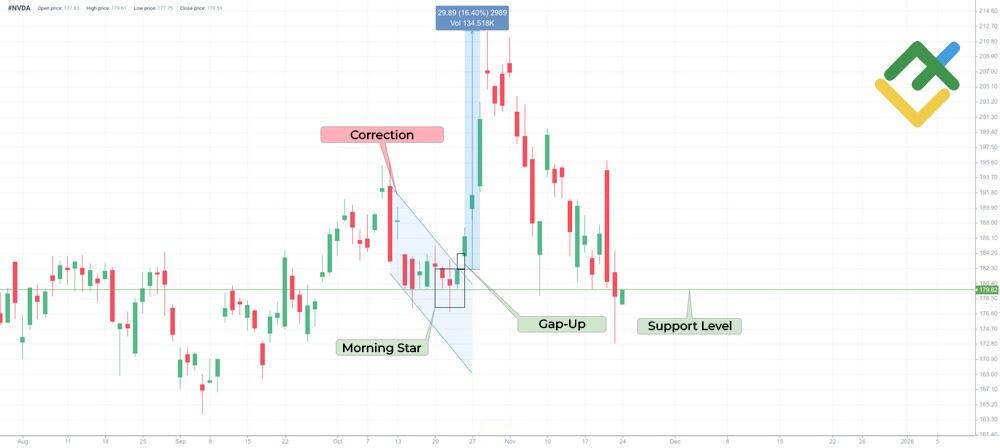
For example, Nvidia Corp.'s share price formed a Morning Star pattern on the daily chart after a short-term correction within a sustainable uptrend. After the pattern appeared, a gap-up formed, offering a confirming signal. As a result, the price rose by 16.40% and reached a new all-time high of $212.15.
Gaps serve as breakout signals for key buying and selling zones and mark new support and resistance levels. Studies show that about 70–80% of gaps are followed by a retest. For example, in a bullish trend, after an upward gap, the price declines, then rises again to new swing highs. This is especially true for highly liquid markets, which can be exploited in trading strategies.
However, the market context is important: with gaps that occur against a backdrop of strong fundamental factors, a retest may not occur. The price momentum after a gap reflects market psychology — mass buying amid fear of missing out on profits or a panic sell-off.
Gap type | Role in continuation pattern | Signal confirmation |
Runaway Gap | It confirms the strength of the present trend and appears in the middle of the trend movement | Increase in trading volume and a gap continuation, when the price moves in the direction of the gap |
Continuation Gap | It signals a trend continuation after consolidation | Breakout of resistance/support levels, acceleration of price momentum |
When trading this pattern, analyze the context in which the continuation gap occurred: the current trend, support and resistance levels, trading volume, and fundamental factors. In addition, place stop-loss orders to limit risks.
Three White Soldiers / Three Black Crows
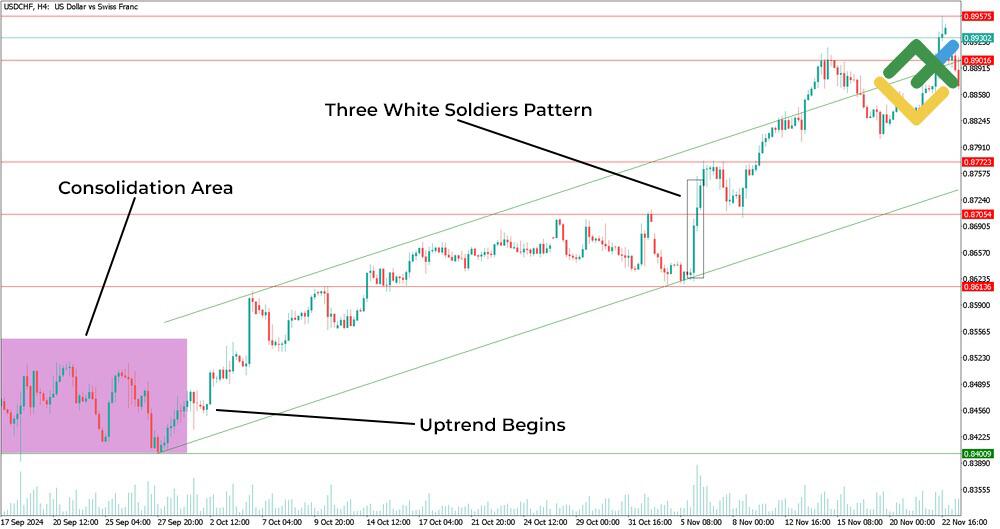
In the Three White Soldiers pattern, each of the three candles opens within the body of the previous one and closes above its high. This pattern indicates strong bullish momentum.
Here is an example of a trading decision: Apple shares are trading in an uptrend, hitting higher highs and forming a Three White Soldiers pattern. A trader could open a long position at the close of the third candle and place a stop-loss order below the low of the pattern's first candle.
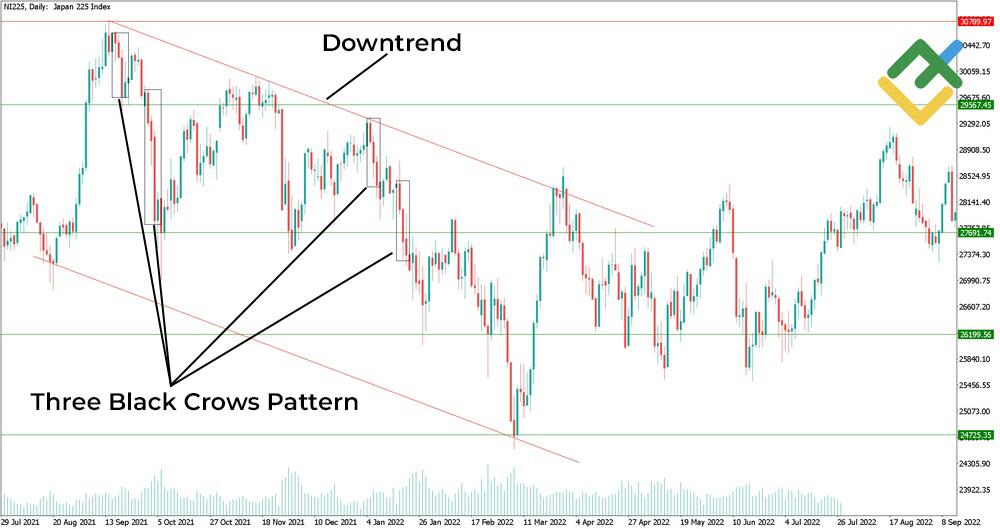
The Three Black Crows pattern is formed by three descending candlesticks, each opening within the body of the previous one and closing below its low. The pattern reflects a change in market sentiment—the downward market momentum indicates increased selling pressure.
For example, the NI225 is trading in a downtrend, and the Three Black Crows pattern appears after an upward correction. A trader can open a short position at the close of the third candlestick. The risk management strategy suggests placing a stop-loss above the first candlestick's high.
According to studies, the Three Black Crows pattern is most effective when trading on a daily timeframe.
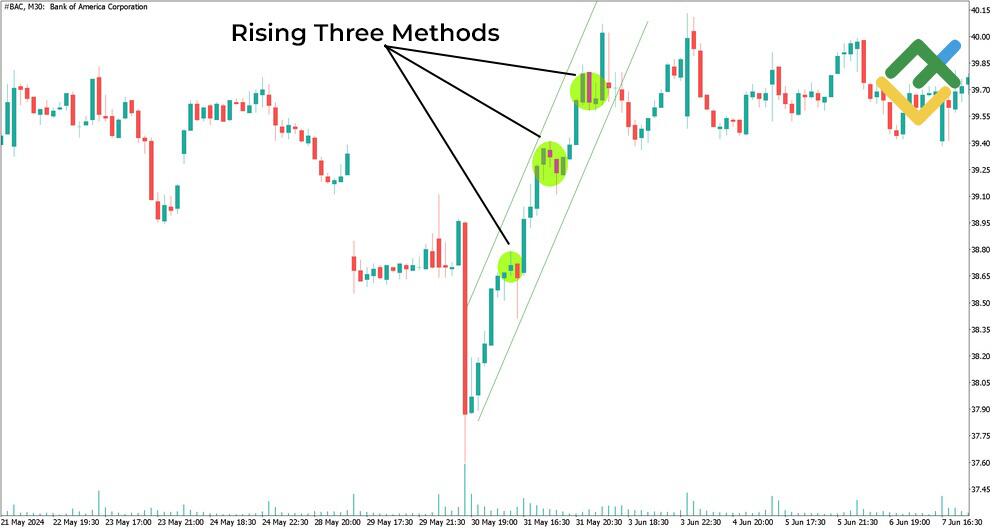
Rising Three Methods / Falling Three Methods
These patterns suggest that the primary trend will likely continue once a consolidation phase is over.
The Rising Three Methods pattern consists of a long bullish candlestick followed by short bearish candlesticks. The pattern ends with a long bullish candle that closes above the first one.
The Falling Three Methods is the opposite pattern: the first long bearish candle is followed by short bullish ones limited by the range of the first candle. The pattern ends with a long bearish candle that closes below the first candle's opening level.
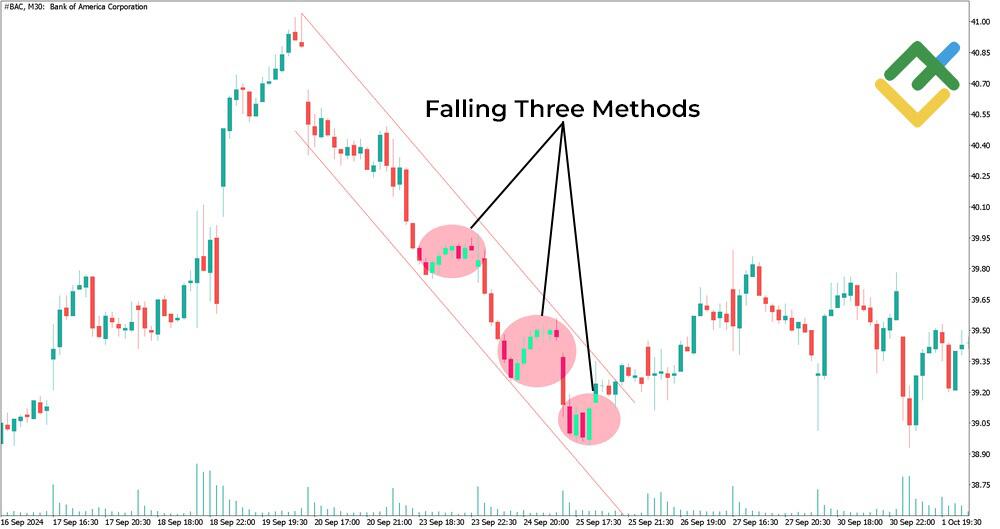
Trading volume decreases as the pattern's first three candles form and increases during the final candle, confirming the trend resumption. This setup indicates a weakening of the corrective movement, allowing traders to open positions in line with the global trend.
Notably, these swing trading patterns provide more reliable signals on daily and weekly charts.
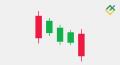
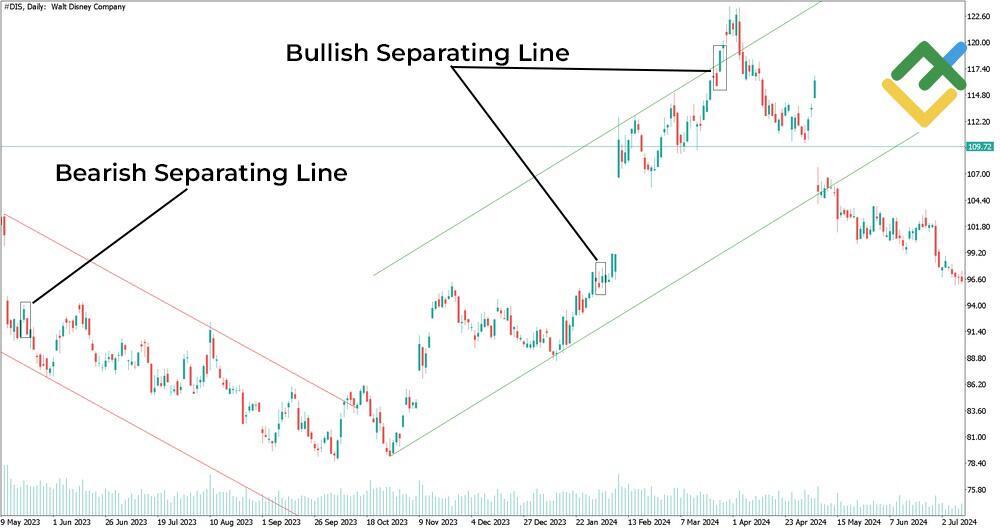
Separating Lines
The Separating Line candlestick pattern appears within the current trend. The pattern can be bullish or bearish.
A bullish Separating Line pattern confirms an uptrend after a correction. This pattern consists of two candles, a bearish one followed by a bullish one. Both candles open at the same level.
A bearish pattern indicates a continuation of the downtrend. It is formed by a green candle followed by a red one.
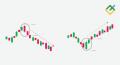
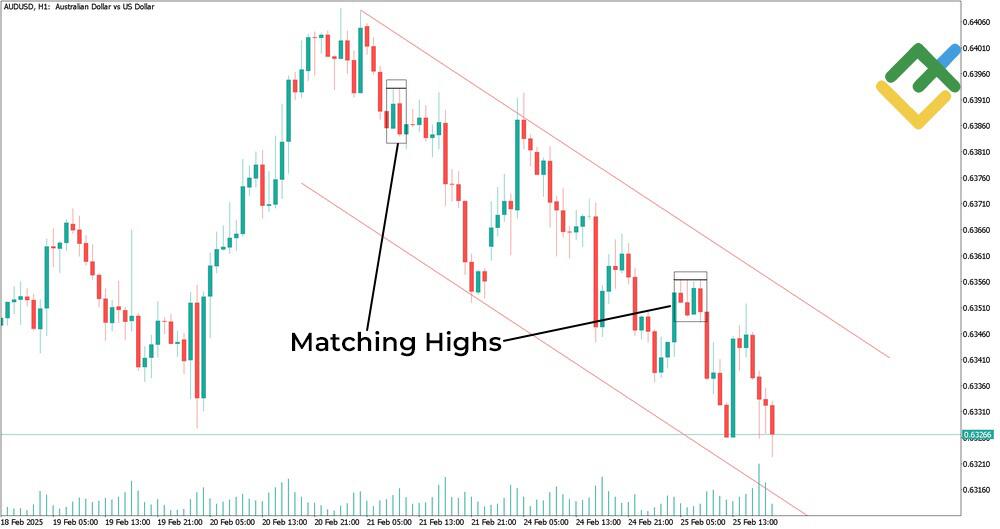
Matching High / Matching Low
Matching highs and lows are chart patterns that signal a trend continuation and can be used to identify optimal entry/exit points.
Matching highs occur when two or more candlesticks reach approximately the same highs, suggesting the price has reached a resistance level and the downtrend may continue.
Matching lows appear when the price of two or more candles reaches the same low. The price has hit a support level, and after a brief consolidation, growth may continue.
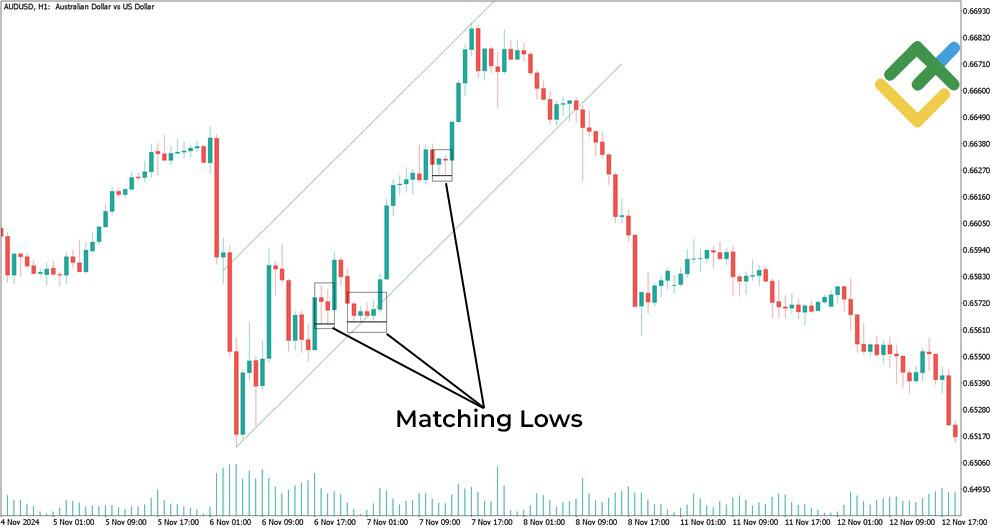
When coupled with technical analysis tools, these patterns can help you make more informed decisions. However, remember that even the most reliable pattern cannot guarantee profits, so it is important to consider the potential risks.
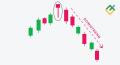
How to Avoid False Breakouts
Increasing volume at a breakout point strengthens the trading signal, while low volume warns of a potential false breakout.
Tips for spotting a false breakout:
- Compare the volume of the current breakout with previous ones. If the volume of the current breakout is significantly lower than in previous cases, it signals a weak movement.
- Time frames. It is important to use several time frames for confirmation. If a breakout is visible on a lower time frame, it should be confirmed on a higher time frame.
Bollinger Bands can serve as an additional confirmation technical indicator, showing how far the current price movement is out of the established boundaries. You can avoid traps using stop-loss orders and hedging positions.
On the four-hour chart of the UKBRENT, you can see an example of a false breakout signal and a bull trap. Additional confirmation is provided by volume analysis using the OBV and MFI indicators.
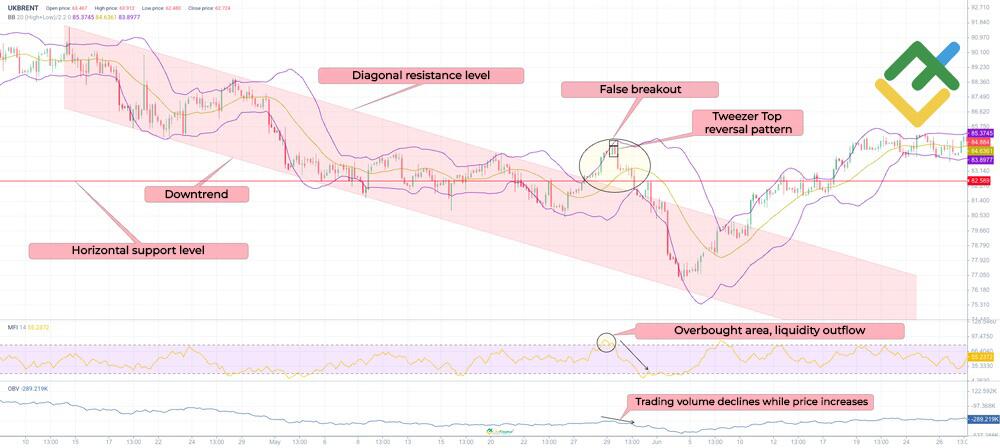
A common mistake is opening a position hastily without confirming a signal. As a result, you may fall into bull or bear traps.
Criteria | True breakout | False breakout |
Volume | High | Low |
Candlestick patterns | Confirm a breakout direction | Reversal or indecision |
Time frame | Confirmation on higher time frames | Mixed signals on different time frames |
Price movement | Sustainable and directional | Weak and uncertain |
Price movement after a breakout | Level retest followed by rise/fall | Swift return to the key level |
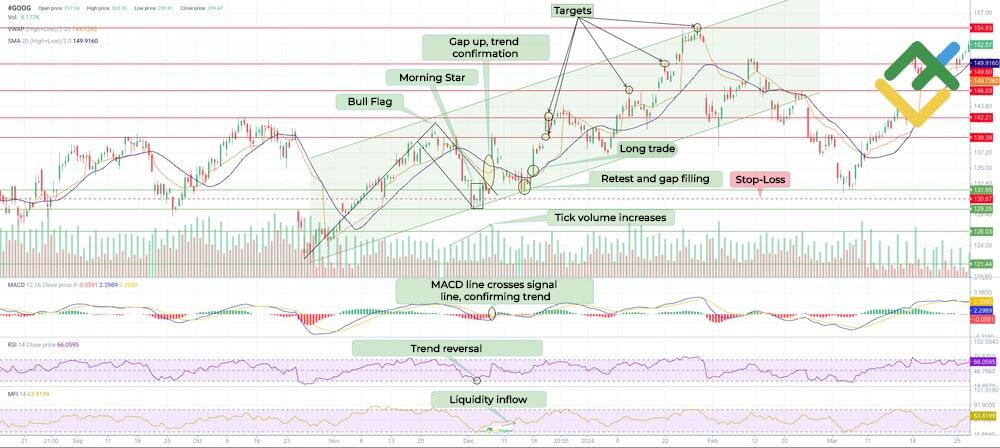
Technical Indicators for Pattern Confirmation
Frequently used technical indicators:
- MACD. If the MACD line crosses the signal line from below, it confirms a bullish pattern. The MACD histogram should be above 0 to amplify the signal.
- RSI. The indicator should be above 50 after a bullish pattern has formed. Values above 70 indicate overbought conditions, and a downward correction is possible. For bearish patterns, the RSI should be below 50.
- Volume indicator. An increase in volume during the formation and breakout of a bullish pattern confirms the strength of the movement. A drop in volume signals a looming correction. Moving averages (MA) help smooth out volume fluctuations. Fibonacci retracement levels can reveal key support/resistance zones.
Rules to Follow When Using Candlestick Continuation Patterns
You can significantly improve your trading efficiency and trend analysis by following these simple rules:
1. Identify continuation patterns:
- Find candlestick patterns that confirm a trend continuation (Three White Soldiers, Three Black Crows, Rising/Falling Three Methods, and Marubozu).
- Make sure the pattern aligns with the existing trend.
2. Confirm the trend:
- Before using candlestick patterns, make sure there is a stable trend – use moving averages (MA) with periods of 50 and 200.
- Use technical indicators such as Fibonacci retracement levels to confirm reversal levels.
3. Analysis of several time frames:
- Analyze price movements on larger time frames (daily, weekly) to confirm the primary trend.
- Use smaller time frames to find entry points.
4. Monitor trading volume:
- Pay attention to trading volume. An increase in volume during pattern formation strengthens the signal.
- Assess the trend strength—an increase in volume usually confirms the stability of the price movement.
5. Support and resistance levels:
Analyze the position of candlestick patterns relative to support and resistance levels. Emerging near key levels, patterns generate more reliable signals.
6. Technical indicators:
A MACD crossover and an RSI in overbought/oversold territory can confirm the pattern.
7. Risk management:
- Place stop-loss orders slightly below/above key support/resistance levels, depending on the trend, or within the boundaries of the candlestick pattern.
- Allocate no more than 2% of your trading deposit per trade.
8. Backtesting:
Test your strategies on historical data and a demo account to make sure they are effective.
9. Psychological resilience:
Maintain your discipline – follow your trading strategy and do not give in to your emotions.
10. Continuous learning:
The market is evolving. Explore new patterns and strategies and enhance your technical and fundamental analysis skills.
Common Trading Pitfalls and Psychology
Trading psychology plays a critical role in interpreting candlestick patterns. Emotion-driven decisions and excessive confidence can seriously distort market perception and lead to losses.
- Pattern obsession: The desire to see a pattern where there is none is a common mistake.
- Confirmation bias: Selecting information that confirms your preconceptions and ignoring other, sometimes more important data. This leads to an inaccurate market assessment and to incorrect trading decisions.
- Premature confirmation of candlestick patterns: Impatience and the desire for quick profits without proper confirmation can lead to losses.
Psychological aspects of trading, expert opinions:
"The problem is not the emotions attached to trading: those are the consequences of the more fundamental problem of not identifying and adapting to changed market conditions." — Brett Steenbarger.
"The desire for constant action irrespective of underlying conditions is responsible for many losses on Wall Street." — Jesse Livermore.
Pros and Cons of Using Candlestick Continuation Patterns
Candlestick continuation patterns indicate a pause in directional price movement followed by a continuation of the main trend. They help traders determine entry points. However, they also have their advantages and disadvantages.
Pros | Cons |
Clear entry/exit signals | False signals requiring confirmation |
Simple identification on the chart | Subjectivity of interpretation |
Combination with other tools | Formation delay |
Confirmation of the trend's strength | Lack of efficiency in flat markets |
Conclusion
Candlestick continuation patterns are a valuable tool for determining optimal entry points. Bullish patterns, such as the Gap Up and Three White Soldiers, suggest growth, while bearish patterns, such as the Gap Down and Three Black Crows, signal a decline in prices.
Candlestick patterns do not guarantee 100% success, but they do increase your chances of making a profit. Try trading with trend continuation patterns on LiteFinance's free demo account to hone your skills and confidently apply them in live trading.
Get access to a demo account on an easy-to-use Forex platform without registration
Continuation Candlestick Patterns FAQs
There are various continuation patterns, such as Three White Soldiers, Falling Three Methods, or Tasuki Gap. Each pattern has its own features and indicates a likely continuation of the trend.
Look for candlestick patterns of a specific size and ratio, and consider the market context. Use confirming signals from technical indicators such as the MACD, RSI, and MFI.
Continuation patterns indicate that the current trend will continue, while reversal patterns signal a change in trend. The difference lies in the market context and the interpretation of the signal they generate.
Yes, the bearish Pennant formation, like the bullish Pennant, is a continuation pattern. They form after a sharp movement and consolidation, after which the price resumes moving in the previous direction.
Descending and Ascending Continuation Triangles, like Symmetrical Triangles, can be continuation or reversal patterns. Ascending and descending triangles more often point to a continuation of the trend, while symmetrical triangles require additional confirmation.
Yes, the Flag, like the Rectangle pattern, is a classic continuation pattern. It forms after a sharp movement and consolidation. Then the price continues to move in the main direction.
To confirm the continuation pattern, use the RSI, MACD, and moving averages. For example, a breakout of the Flag may coincide with an increase in the RSI, confirming the trend's continuation.
High volume during the formation and breakout of a pattern increases its reliability. If trading volume falls, a correction is likely to occur in the near future.
Insufficient volume, rapid return of the price within the pattern, and lack of confirmation from indicators. Breakout patterns are less common but also indicate a false breakout.
Signals are usually more reliable on daily and weekly charts. The Falling Three Methods pattern performs better on higher time frames. The On Neck is a rare candlestick pattern that requires confirmation from additional indicators on any time frame.

The content of this article reflects the author’s opinion and does not necessarily reflect the official position of LiteFinance broker. The material published on this page is provided for informational purposes only and should not be considered as the provision of investment advice for the purposes of Directive 2014/65/EU.
According to copyright law, this article is considered intellectual property, which includes a prohibition on copying and distributing it without consent.