A bear trap in trading is a technical reversal pattern at the bottom. The pattern gives a false signal for the continuation of the downward trend, presenting that the price declines and encourages bearish traders to open short-selling positions. But in fact, this pattern signals a change in trend for bearish investors and occurs in all types of trading instruments, including currency pairs, securities, cryptocurrency assets, and derivatives.
A bear trap occurs when institutional traders trap less experienced retail investors, that chase constantly a lower price, in order to provide liquidity to the market. A trader who fell into the bear trap finds themselves in the red, then stop losses of unprofitable trades get triggered, which is the fuel for the development of a bullish trend. This rapid price reversal can trigger a short squeeze, as trapped sellers rush to exit their positions by buying back the asset, which accelerates the upward movement.
The material below will help you identify how a bear trap works in a timely manner and determine favorable entry points to the market using trading strategies for this pattern. It is crucial to identify bear traps in financial markets to avoid misleading downward trends and potential losses. The convenient high-performance LiteFinance terminal will allow you to try out these strategies for free on a demo account.
The article covers the following subjects:
What is a Bear trap and why does it happen?
A bear trap on the financial markets means a period of time when a certain instrument declines and breaks through a key support level before reversing, thus restoring the lost long or short positions. A breakout of a support level can be as sharp as a reversal. However, a situation can occur on the market when the asset stays below the support for some time, luring short sellers into a bear trap and forming a reversal of movement.
The bear trap is a frequent event. The reason is that bullish traders are dominating the force balance. This decline creates a situation where there are more people who want to buy the financial instrument than those who want to sell it. This leads to overpricing by buyers who want to attract more sellers as market participants.
This is where the interesting thing happens. A false breakout of the key support level encourages inexperienced traders to enter short selling positions and set stop losses higher, which subsequently leads to panic-induced exiting at a loss. This is basically large players, banks, market makers collecting liquidity, which serves as a momentum for the development of an upward trend. This action forces short sellers to buy back shares, contributing to upward price momentum.
This sudden buying pressure can trigger a short squeeze, as trapped short sellers rush to exit their positions, further accelerating the price increase.
Bear trap examples
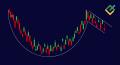
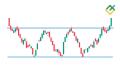
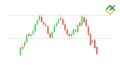
Traditionally, as an example, let us look at the daily EUR/USD chart. Before the uptrend, three false breakouts of the support level formed, which drove less experienced traders into a bear trap.
The picture shows that the asset consolidated for a long time and subsequently formed a bullish divergence on the RSI technical indicator, which was the first signal for an upward trend in the instrument. In addition, all three false breakouts were accompanied by the formation of bullish trend reversals, such as piercing, morning star and doji. The formation of these candlestick patterns was a confirmation signal for the bulls and a warning signal for the bearish investors.
![]()
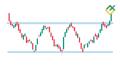
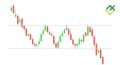
We can see another bear trap chart example in the stock quotes of McDonald's, Corp.
In the daily chart below, you can see that the bulls made an attempt to drive the bearish investors into a trap by entering a short position, after which a three-week rally began in the asset. The positive dynamics was preceded by the formation of a bullish divergence on the MACD indicator, and the confirming buy signal was the bullish belt hold candlestick pattern and the recovery of the asset above the support level.
![]()
How to identify a Bear trap — Bear trap technical analysis
Psychology is important when trading on financial markets. A trader needs to keep their composure, practice restraint, avoid impulsive actions and exercise patience. Remember about following risk management and limiting the possibility to lose money.
To define when is the best time for short selling, and avoid falling into a bear or a bull trap, it is important to do a comprehensive technical analysis first. Below is a step-by-step guide that helps traders to spot when bear traps happen:
- First you need to select the appropriate time period. The higher the timeframe, the more accurate the signal will be. The four-hour timeframe is optimal.
- Next, identify the support and resistance levels for the instrument.
- Next, you need to add one of the stochastic oscillators to the bear trap chart, for example, the RSI, Stoch or MACD. This is necessary to notice the instrument's bullish divergence during the breakdown of the key support level. If there is a divergence, it means that while the price drops is more likely to form a bear trap and after a short-term breakout down, the quotes will soon recover.
- To determine the entry point to a long position with a wide price range, you need to analyze candlestick patterns. As a rule, patterns that present trend reversals such as morning star, hammer, inverted hammer, piercing, and bullish engulfing are formed in a bear trap. These are clear signs of an uptrend. You can also look for entry points on small timeframes, for example, 30-minute or hourly.
- After determining the entry point, open a position and set a stop loss below the support level. In some situations, the stop loss can be set below the opening of the previous bar.
- You can close a position when the prices rise until the nearest resistance, or in parts, but you need to identify several resistance levels beforehand where the buying pressure is rather strong.
![]()
Bear trap chart patterns
When a bear trap occurs, usually there is a false breakdown of the support level, the purpose of which is to drive as many market participants as possible into a trap by entering a short position, pushing for a lower price. Below we will consider the popular types of the bear trap pattern.
Pattern №1 — Collapse in the gap
We can see how this type of bear trap works in the Apple Inc. stock chart. The breakout of the support level was accompanied by the formation of a gap and the formation of a bullish trend candlestick pattern hammer. This is the collapse of the candle in the gap. By the time the prices rise back above the support level confirmed that the bulls were holding this mark. In addition, the growth of quotes was preceded by the formation of bullish divergence on the RSI technical indicator, which signaled a trend reversal and an impending bear trap in advance.
![]()
Pattern №2 — Pin bar squeeze
This pattern is frequent in all types of financial instruments. Below is an illustration of a pin bar squeeze in the BTC/USD chart. The initial signal for a reversal was also a bullish divergence on the MACD indicator. The moving average crossover point started a new bullish rally of the instrument. In candlestick analysis, a squeeze is accompanied by the formation of a candlestick shadow up or down. In the current situation, the formation of a series of bullish hammer patterns served as confirmation of the upcoming growth.
![]()
Why should you avoid Bear traps and how to do it?
You obviously need to avoid the bear trap in order to save your capital. Due to the frequent appearance of a bear and bull trap in the charts, many traders lose money, and the desire to recover them sometimes can result in a complete loss of the deposit.
It should be emphasized that when a bear or a bull trap occurs in the market, a significant change in price action has taken place. Therefore, no one is immune from falling into it. Below we will consider methods that will allow you to keep safe and earn at the same time.
Method №1 — Identifying the bullish divergence
Before start short selling, the classic method of spotting bear traps is to see the bullish divergence appearing in the chart. Originally, this phenomenon is a strong price reversal signal, in particular, at higher time intervals. To determine the divergence by this method, you can use the MACD oscillator. The entry point to the market is determined by the intersection of moving averages.
The four-hour USD/JPY chart shows the emergence of a bullish divergence followed by two bear traps. It was possible to open a buy trade in two places - at the crossing with the MACD line from the bottom up. Stop loss in such cases should be set below the support level, focusing on the shadows of the candles. With such a conservative approach, it was possible to avoid falling into the bear trap and earn 0.57% of the movement from the trade. It is better to take profit in such uncertain cases after the price movement begins to fade at the point of crossing with the MACD line crosses from the top down.
![]()
Method №2 — Candlestick pattern analysis
In order to avoid bear traps, this method identifies the motive in advance using trend reversal candlestick patterns. To identify if bear traps happen just examine the classic bullish reversal patterns such as hammer, inverted hammer, engulfing, piercing, and morning star. In addition, it is important to know the bearish candlestick patterns to determine the level for locking in profit.
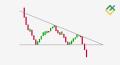
Let’s look at a bear trap example using this method in the EUR/JPY four-hour chart. Bears were driven into a trap twice. In the first case, a collapse trap formed in the gap, creating a bullish morning star reversal pattern. The second signal was the hammer pattern, which warned of the formation of a second trap and an imminent reversal in price action. In this case, it was rational to wait for the second-morning star pattern to form completely and, after consolidation above the support level, open a buy position. The closing signal was the quotes reaching the nearest resistance level before the price breaks up and the appearance of the bearish tweezer top pattern.
![]()
How to trade Bear traps: the best strategies
For successful bear trap trading, it is better to use a mixed strategy and analyze higher timeframes, for example, a four-hour or daily timeframe. To determine a profitable entry point to the market, you can use the 30-minute or hourly timeframes. It is important to combine indicator and candlestick analysis. Choose popular instruments like the RSI, Stoch or MACD as indicators.
Strategy #1 — Trading on exit from the trap
As part of the strategy, the entry into the market is carried out after the instrument completes the formation of the bear trap.
In this section, I will illustrate an example of the strategy using the AUD/JPY currency pair.
1. First you need to open a four-hour chart and identify the support and resistance levels. In addition, you should add one of the stochastic indicators to the chart. In this example, I have chosen the classic RSI indicator. In the chart, there is a divergence from the instrument and the formation of a bullish divergence.
2. After the indicator analysis, we do a study of candlestick patterns. The chart shows that after the downward trend, a bear trap has formed in the form of a pin bar squeeze. In addition, there is a completed bullish morning star pattern, which included the inverted hammer and hammer patterns. Bullish pin bar squeeze candles signaled an upcoming bear trap.
3. The bullish divergence, the morning star candlestick pattern and the exit from the bear trap were a signal to open a trade at 91.515 for 0.01 lots after the instrument consolidated above the support level.
4. As part of my risk management, I will place a stop loss below the support at 90.700 and a take profit just below the resistance at 92.474. This way the possibility to lose money is moderated.
![]()
5. After a short consolidation of the asset, our trade closed with a profit. Net profit was 207.3% or $7.38 with a $100 deposit.
![]()
Strategy #2 — Buy inside the trap
This strategy is more risky and can only be used provided several confirmations with the help of candlestick patterns of price dynamics reversal.
Let’s look at the strategy using the example of the stock of Caterpillar, Inc.
There is a divergence in the MACD indicator in the daily stock quotes chart. In addition, a series of inverted hammer reversal patterns formed in the bear trap. The strength of the buyers was confirmed by the bullish counterattack and bullish belt hold patterns.
In this situation, the growth of quotations was expected. Therefore, it was possible to open a buy trade inside the bear trap after the formation of the bullish counterattack pattern. Stop loss is best set at the level of the previous local support.
Lock in profits after the formation of bearish patterns tweezer top and shooting star just below the resistance level.
![]()
Get access to a demo account on an easy-to-use Forex platform without registration
Escaping a Bear Trap
Escaping a bear trap requires a combination of technical analysis, risk management, and market awareness. Here are some strategies to help you avoid further losses:
Stop-loss orders: Setting a stop-loss order at a reasonable level above your entry point is crucial. This helps limit your losses if the market reverses unexpectedly, ensuring you don’t get caught in a prolonged downturn. In such cases, stop-loss orders can automatically close a position, preventing further losses and protecting the trader’s capital.
Technical analysis: Utilize technical indicators such as the Relative Strength Index (RSI) or stochastic oscillator. These tools can signal oversold conditions and potential reversals, helping you identify when a bear trap might be forming.
Market sentiment analysis: Keep an eye on market sentiment. If the market is overly bearish, it could be a sign of a potential bear trap. Adjust your strategy accordingly to avoid getting caught in the trap.
Diversification: Diversify your portfolio across different asset classes, sectors, and geographical regions. This reduces your exposure to any single market, helping to mitigate the risk of falling into a bear trap.
Risk management: Effective risk management is key. Set position sizes and stop-loss levels that align with your trading strategy and risk tolerance. This approach helps manage your risk and protect your capital.
By combining these strategies, you can manage risks better and avoid the pitfalls of bear traps.
Avoiding Common Pitfalls
To avoid common pitfalls when trading in bear trap markets, keep the following in mind:
Don’t chase losses: Avoid the temptation to chase losses by trying to recoup them quickly. This can lead to further losses and increased risk. Instead, stick to your trading plan and make calculated decisions.
Don’t over-leverage: Over-leveraging your positions can significantly increase your risk and potential losses. Use leverage wisely and ensure it aligns with your risk tolerance and trading strategy.
Stay disciplined: Discipline is crucial in trading. Stick to your trading strategy, even during times of market volatility. This helps you avoid impulsive decisions that can lead to further losses.
Monitor your emotions: Trading can be emotional, but it’s important to keep your emotions in check. Avoid making decisions based on fear or greed, and focus on your strategy and analysis.
Stay informed: Keep yourself informed about market news and events. This helps you make better-informed decisions and adjust your strategy as needed.
By following these strategies, you can increase your chances of success when trading in bear trap markets.
Conclusion
When falling into bear traps, a beginner trader may become confused and take impulsive actions, but this is exactly what you should avoid. It is important to remember the golden rule of trading — cool head, no emotions.
We have shown you the methods that will help you see the bear trap in time and enter the market either by choosing a long or a short position.
In addition, we discussed several working strategies that will help you successfully exit the bear trap by monitoring the price action. You can try them out and apply the acquired knowledge in practice with LiteFinance.
I hope this detailed analysis helps you to save capital by avoiding the bear trap, as well as options to earn in such a situation.
Start trading with a trustworthy broker
Bear trap in trading FAQs
A bear trap in trading means that the price breaks temporarily below the support level indicating an upcoming downward trend, after which the recovery of lost positions will follow.
First you need to select a timeframe - the larger it is, the more accurate the signal. Next, you need to identify the resistance and support levels while monitoring the price. Then do a comprehensive technical analysis. It is very important for short sellers to be very careful with any investment choice and not to do rough moves.
Any situation in the market is potentially good if the trader knows how to behave correctly. The bear trap is no exception. Using the strategies described above, you can get a profit and make more informed investing decisions.
You can understand whether the market is in a bear trap, for example, by analyzing the MACD oscillator. With it, you can accurately determine the entry point to the market using the intersection of moving averages.

The content of this article reflects the author’s opinion and does not necessarily reflect the official position of LiteFinance broker. The material published on this page is provided for informational purposes only and should not be considered as the provision of investment advice for the purposes of Directive 2014/65/EU.
According to copyright law, this article is considered intellectual property, which includes a prohibition on copying and distributing it without consent.