Numerous price chart patterns in technical analysis can be used both in day trading and long-term trading. One of the popular chart patterns is the Pennant pattern, which resembles a Flag pattern.
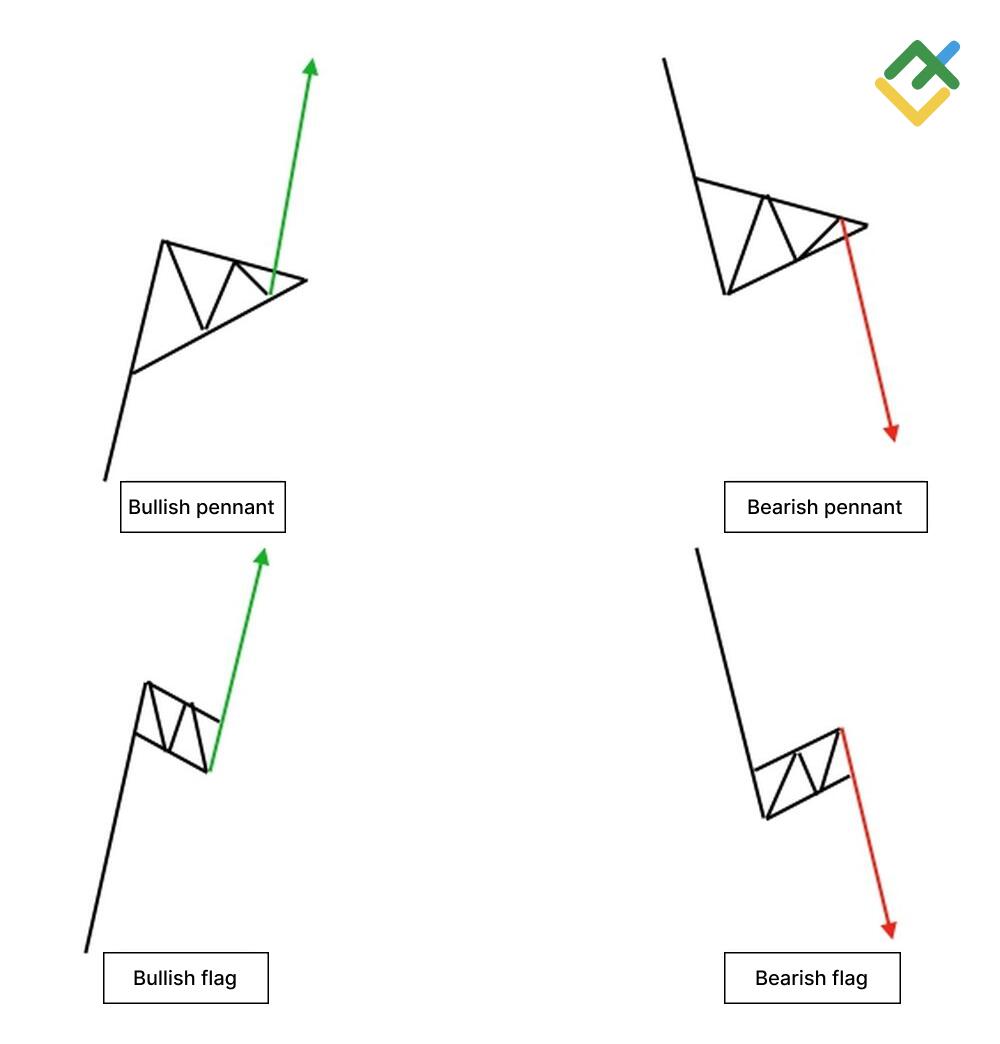
However, the difference between a pennant and a flag is that the flag is formed within the boundaries of two parallel lines, while the pennant is within the boundaries of converging lines.
In addition, pennant patterns are similar to the symmetrical triangle pattern, but here the difference lies in the duration of the formation. The triangle pattern takes longer to build than the pennant.
This article will explain what the pennant formation is, how to detect it in the price chart, and how to trade the pennant pattern.
The article covers the following subjects:
What is Pennant pattern?
The pennant pattern belongs to trend continuation patterns, like other chart patterns, such as the flag or the ascending triangle.
A characteristic feature of the pennant is an impulse movement, after which the stage of price consolidation in a narrowing triangle begins. At the same time, there is a decline in trading volumes for the instrument. Upon reaching a narrow range, there is an intense price breakout in the trend direction with increasing volumes.
In other words, the trend continues to develop in the same direction after a short-term accumulation.
Most often, pennant patterns are found in short-term time frames, for example, from a 15-minute to an hour timeframe. In longer timeframes, the pattern appears less frequently.
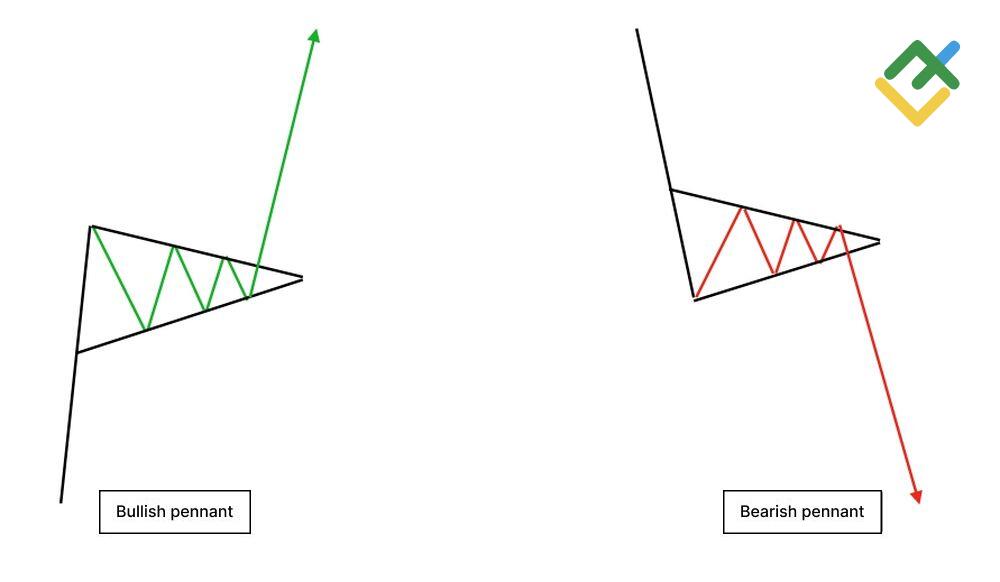
What is the Bullish Pennant?
The bull pennant pattern is a technical analysis pattern, which signals the trend continuation.
Technically, the pattern begins forming after an impulse grows to a certain level. After that, the market calms down, and trading volumes decline.
During this pause, the asset accumulates between converging support and resistance lines.
The pattern should continue after the break out of the upper border, either at the point of the contact of these lines or a little earlier.
At the same time, the trading volume grows intensively, and the price breaks even higher to the level of the previous impulse movement height or to the level of the pennant height.
How to identify Bullish Pennant
Identifying a bullish pennant on a price chart is sometimes difficult, especially for beginners, due to its similarity to symmetrical triangle and bull flag price patterns. However, if you know the peculiarity of constructing this chart pattern, it will not be hard to identify. You can also use technical indicators to determine the entry point.
Bull pennants occur in the Forex market, the cryptocurrency and commodities markets, and the securities market.
The bullish pennant chart pattern has the following features:
- A pronounced impulsive price movement up before building the pennant itself;
- The formation of a pennant as a symmetrical triangle within the boundaries of converging support and resistance lines, while the price impulse should be located at an angle of 90 degrees to the triangle;
- A decline in trading volume when the pattern is forming;
- A substantial rise in volumes when the price breaks out the upper resistance line of the bullish pennant.
What the Bullish Pennant Shows Us
Like most other patterns in trading, the Bullish pennant chart pattern signals to traders that changes are taking place in the market. The bullish pennant pattern in Forex means an uptrend continuation. In some cases, with a protracted downtrend, the pattern signals a bearish-to-bullish reversal.
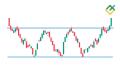
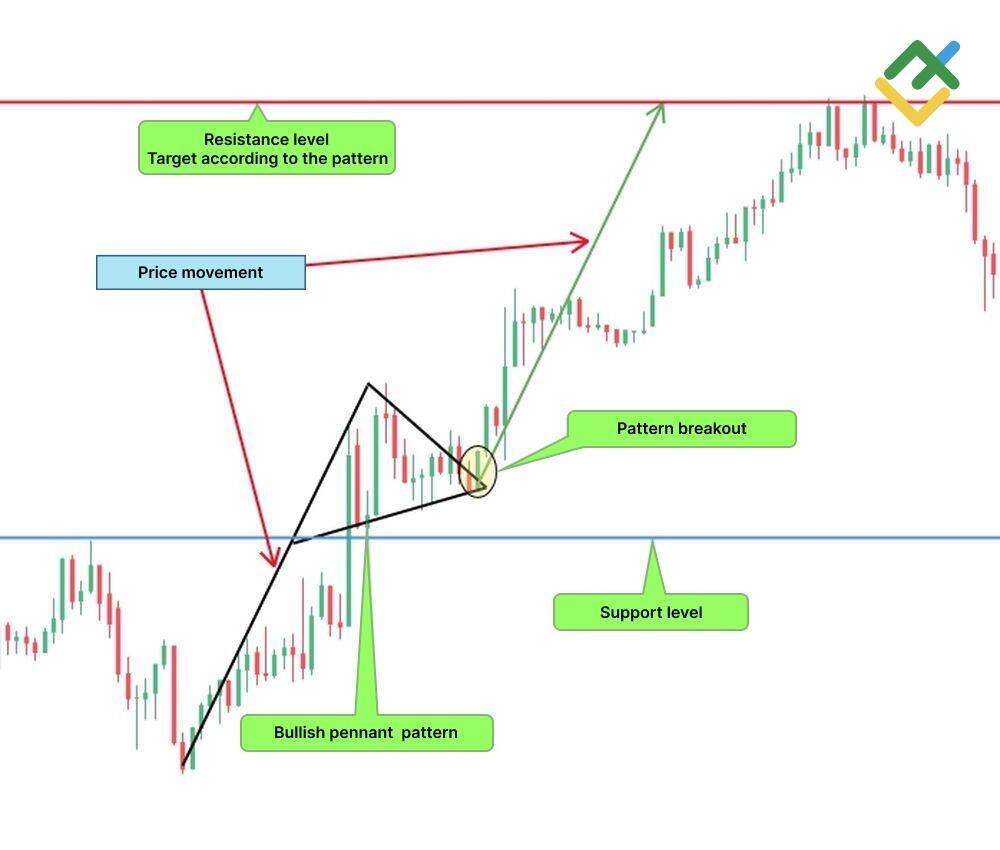
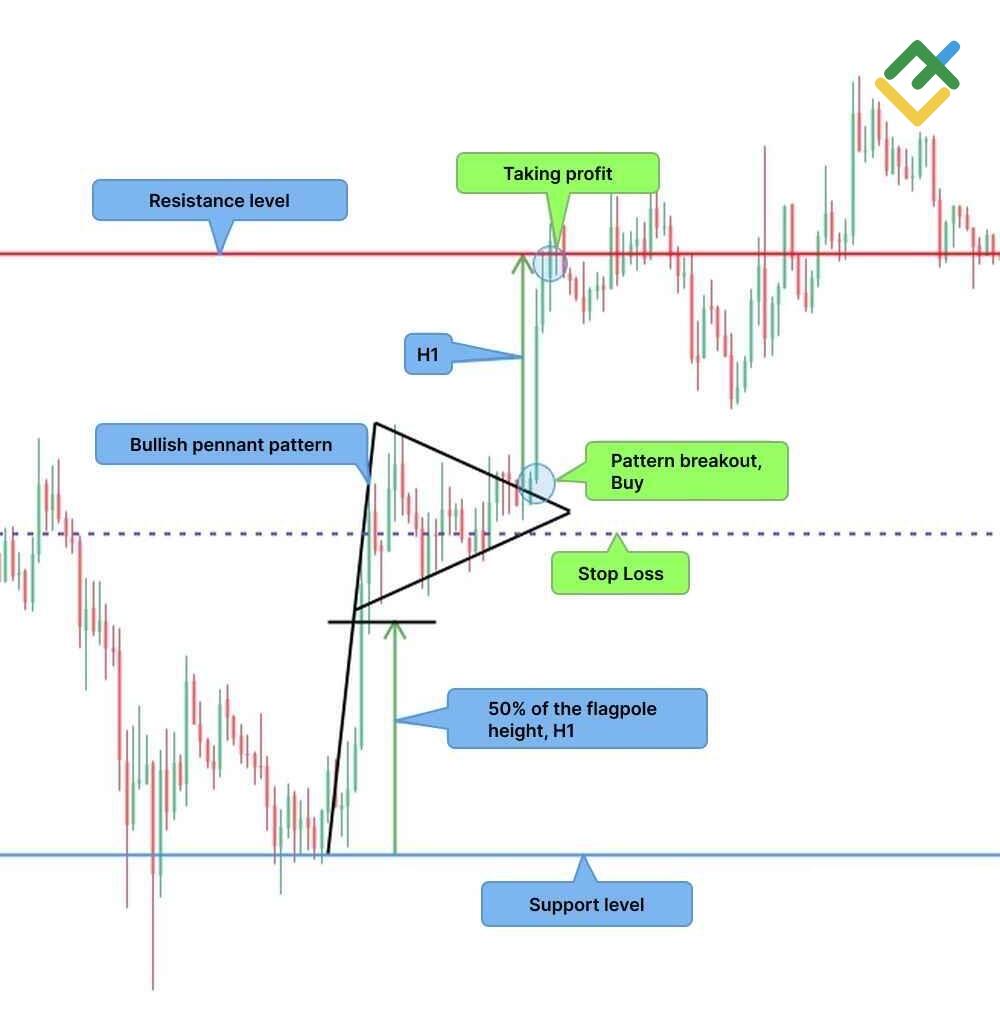
Let me explain the bullish pennant pattern on the example of the USDCHF H4 chart.
The picture below shows that the asset has formed a bullish pennant pattern. After intensive price growth, the price began to consolidate within the borders of the pennant. At the same time, trading volumes on the Volume technical indicator began to decline.
Having determined the support and resistance lines according to the pattern, it is necessary to observe the price behavior.
After narrowing the range, there was a sharp surge in volumes, at which the price broke through the upper boundary of the pennant.
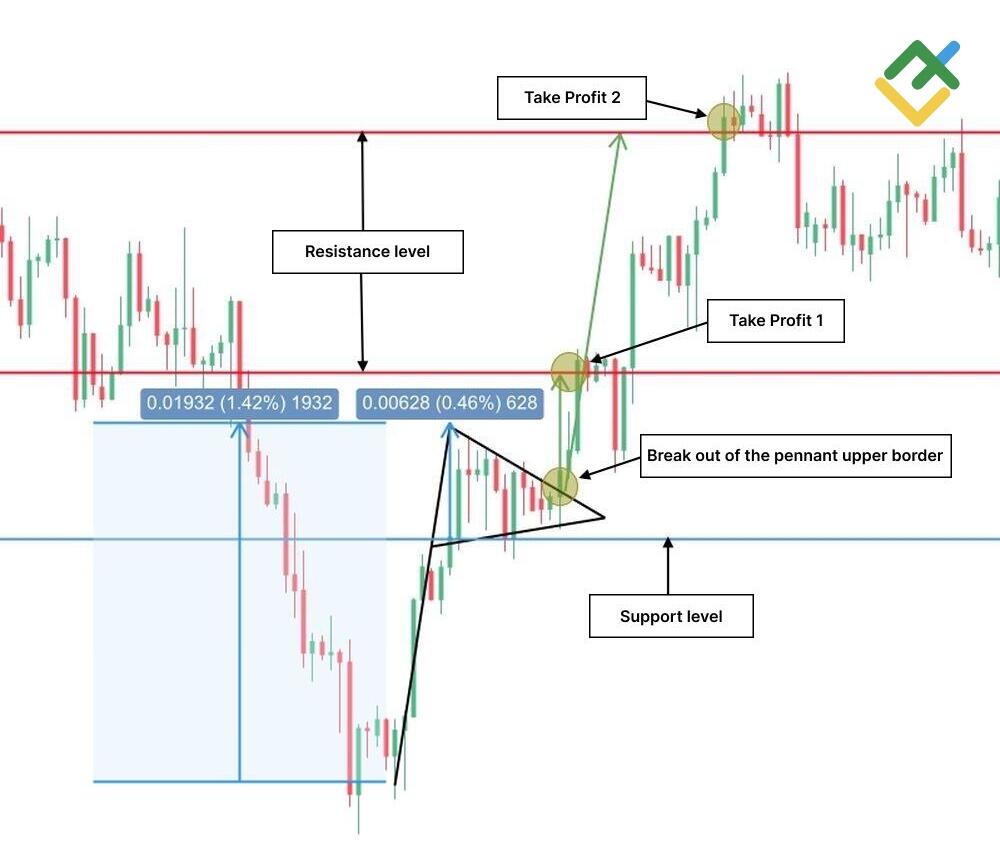
After the first breakout candlestick, which consolidated above the upper resistance line of the pennant, it is necessary to open a long position.
The profit target is also known in advance and is at the resistance level. Take profit is determined either by the height of the flagpole or, as in this case, by the height of the pennant itself.
Therefore, when trading with the bullish pennant chart pattern, you can take profits gradually, closing most of the positions with a gain upon reaching the first goal. Stop loss should be set below the support level according to risk management.
What is a Bearish Pennant?
The bearish pennant pattern is a downtrend continuation chart pattern. The formation of this pattern occurs after an active price decline.
As in a bearish flag, sellers push the price down, after which there is a short-term consolidation phase of the asset and a continuation of the downtrend.
The consolidation phase allows you to open a profitable sell position with predetermined entry and exit points.
The pennant itself looks like a triangle with successive increasing lows and decreasing highs.
The pattern should continue when the price breaks out the lower boundary of the pennant. The price should decline by the height of the pennant or its flagpole amid increasing volumes. Thus, the pattern completes its construction with several candlesticks.
How to identify Bearish Pennant
The principle of determining the bearish pennant pattern in the price chart is the same as with the bullish pennant, only in the opposite direction.
Let us look at the pattern in more detail in the 30-minute BTCUSD price chart.
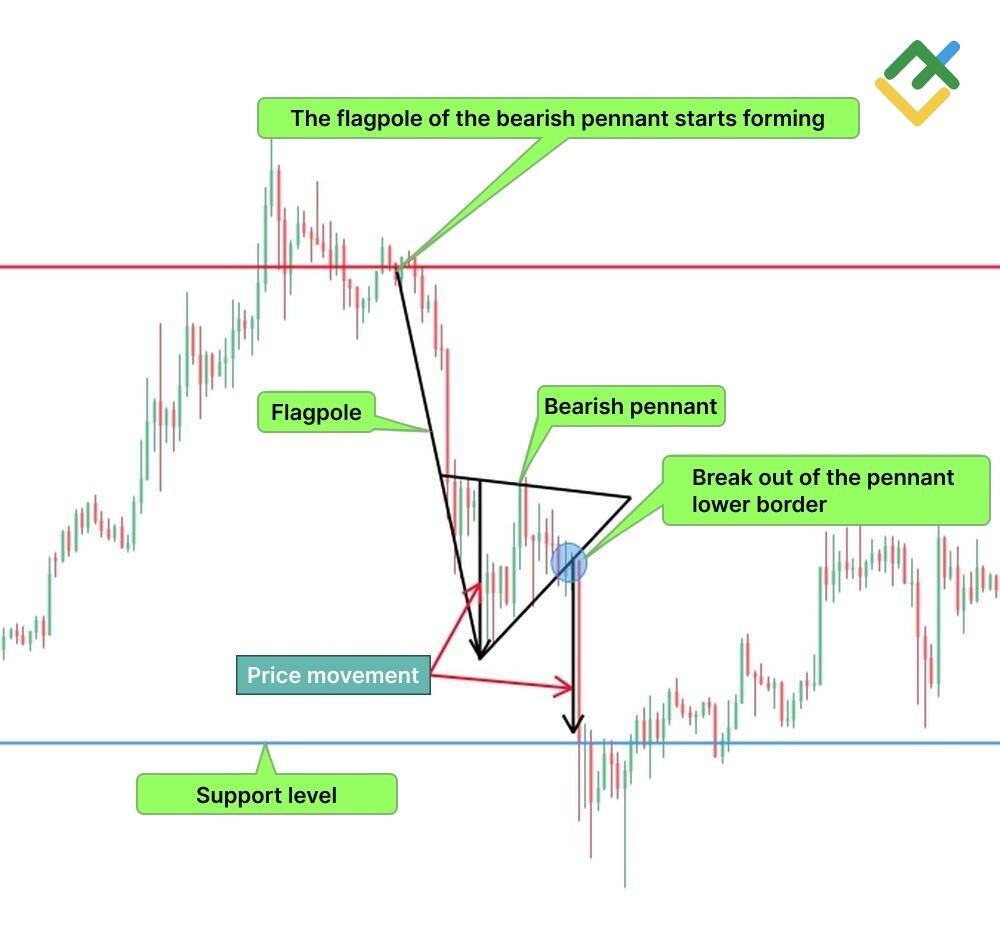
The picture below shows the formation of an impulse price decline, after which the quotes turned up for a short time.
During the period of asset consolidation, an increase in lows and a decrease in highs are seen, which indicates a narrowing price range, from where a breakout should follow.
After a short accumulation period, the price broke through the lower boundary of the pennant with an impulse candlestick, which eventually reached the support level.
Having tested the level, the price subsequently reversed, thus forming a bear trap. However, the bears had the opportunity to open a short position at the point of a downside breakout and take profits.
What the Bearish Pennant Shows Us
The bearish pennant pattern, as a rule, signals the continuation of the downtrend. The formation may sometimes indicate a bullish-to-bearish reversal after a long uptrend.
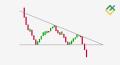
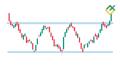
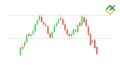
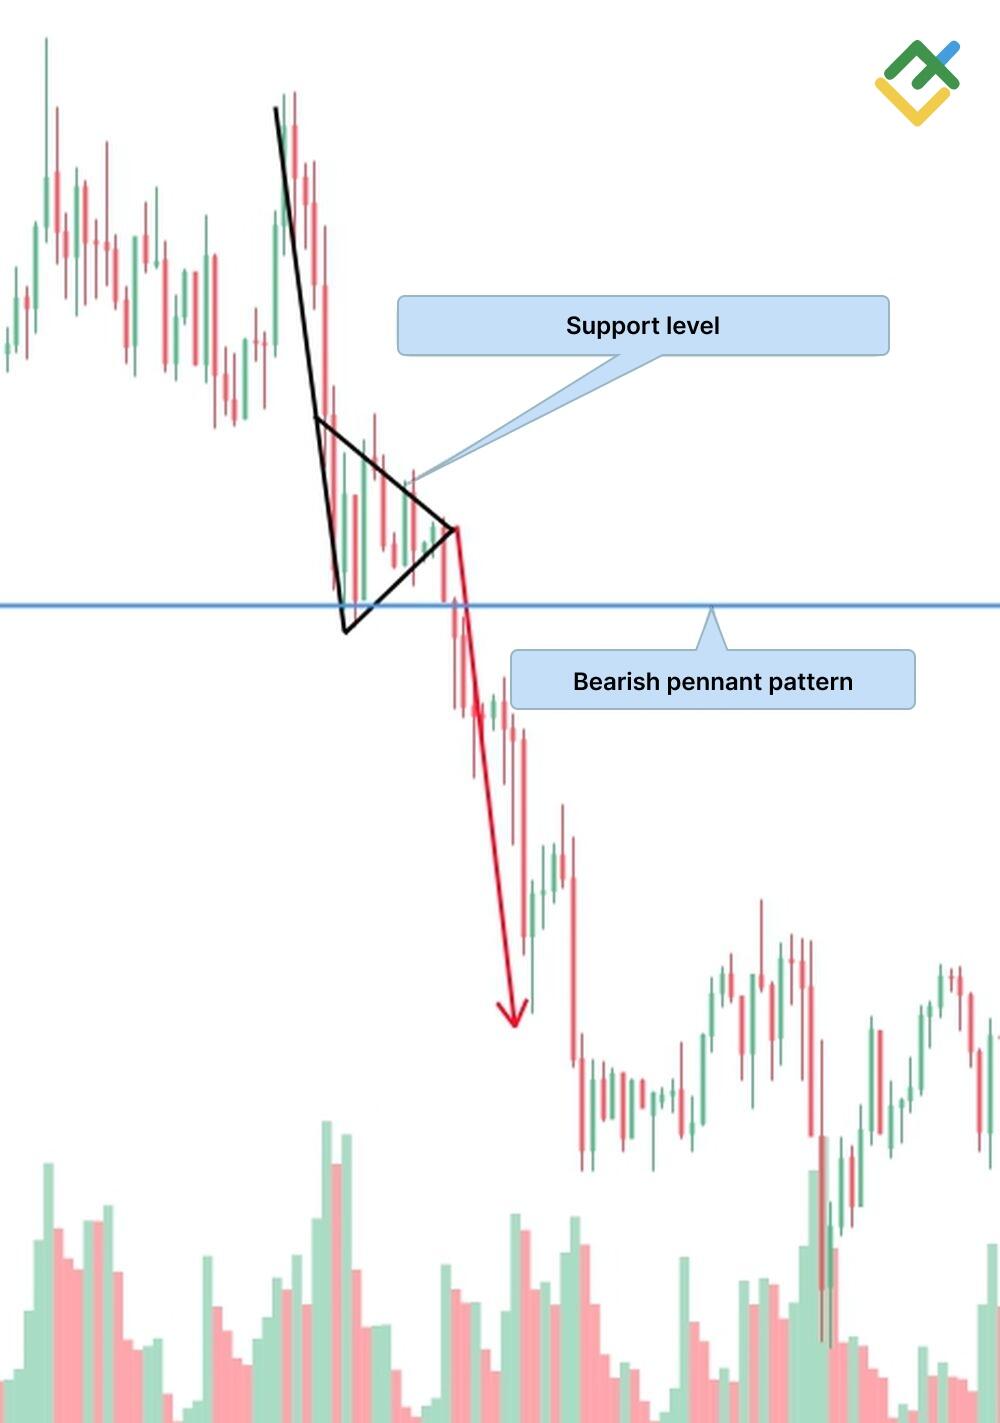
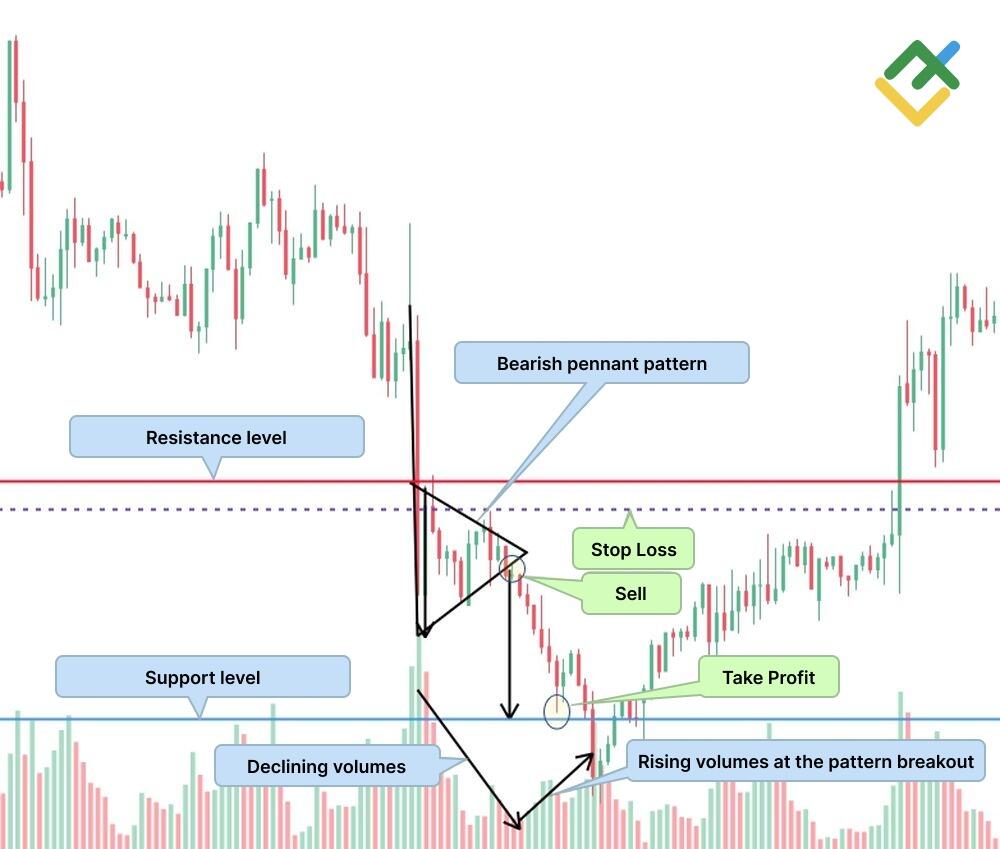
Let us look at the bearish pennant pattern in the 30-minute UKBRENT chart.
The picture below shows a hanging man Japanese candlestick pattern that signals the trend reversal down. You can read more about candlestick analysis here.
From that moment, the formation of a larger bearish pennant pattern began. When the pattern is formed, there is a sharp decrease in volume, which characterizes the pennant.
The breakout of the pennant lower border served as a signal to open a short position. Another indirect signal for this was an increase in trading volumes. The price movement during the formation of a bearish pennant is determined by the height of the flagpole or the height of the pennant itself.
This allows traders to reduce the risks involved and identify the most profitable market entry points and profit-taking.

Pennant vs Flag patterns: What is the Difference?
The pennant and the flag pattern are technical analysis chart patterns that signal the trend continuation. After an intensive price movement, that is, the construction of a flagpole, the pennant or flag is built.
Regarding their structure, the patterns of bullish and bearish flags in Forex are similar to the pennant pattern. However, some differences must be taken into account when determining the patterns in the price chart:
- The pennant pattern is more similar to the symmetrical triangle, the construction of which takes place in a narrowing channel. Depending on the trend, the price breakout is at the point of contact between the lower and upper boundaries of the pattern, but sometimes a breakout can happen even earlier. The difference between a pennant and a symmetrical triangle is the duration of the construction. It takes much longer to form a symmetrical triangle than a pennant;
- The flag pattern, in turn, has two parallel lines of support and resistance. As a rule, the price breakout, depending on the trend, occurs after a short corrective movement in the opposite direction. It should be emphasized that the correction should be no more than 50% of the flagpole height; in case of a larger correction, the pattern loses its relevance. However, there are cases when the flag can also be formed in the shape of a rectangle, moving sideways.
Pennant Flag Patterns Technical Analysis
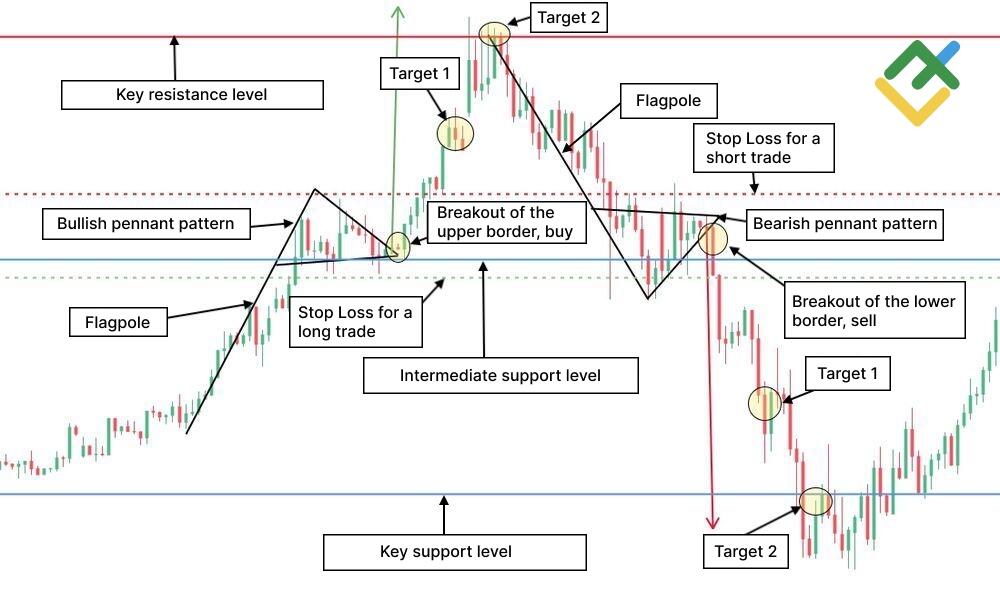
The pennant pattern has certain points at which it is necessary to open and close a position. The pattern also allows you to define stop loss levels in case the market goes against the trader's forecast. As part of the strategy for trading the pennant pattern, it is necessary to form clear criteria before conducting any trades. The pennant trading strategies must meet at least two main criteria:
- Before you start trading Forex, you need to determine the trend for the instrument and the key support and resistance levels. Considering that the chart pattern involves building a flagpole first, which is characterized by an impulsive price movement before building the formation itself, it will not be difficult to determine the trend line. It is important to assess the price movement inside the flagpole or how impulsive the price trend is.
- Correction when building a pennant, as well as in the flag pattern, should not be more than 50% of the length of the flagpole. If this percentage is higher, then the chances of a breakout of the upper boundary of the pennant and a price rebound in the direction of the trend will be less and less.
After defining the main criteria, it is necessary to consider the trading rules when opening long or short positions depending on the trend:
- the flagpole of the pennant pattern should show the impulsive bullish or bearish sentiment of the market participants.
- corrective price movement should not exceed 50% of the flagpole height;
- In an uptrend market, a long position should be opened after the pennant's upper boundary is broken as the price consolidates higher. In the case of a bearish trend, a short position should be opened after the pennant's lower border is broken when the price fixes below;
- A stop loss in a bullish pennant should be placed below the breakout point. In a bearish pennant, the stop loss is set above the breakout point;
- Target profit is defined at two points. The first target is set at 50% of the flagpole height. The second target is set at 100% of the flagpole height.
How to Trade Pennant Pattern
The principle of trading the pennant pattern in Forex and other financial markets is quite simple.
Before opening a position, it is necessary to wait for the breakout of the upper or lower border of the pennant, depending on the trend. Next, the position can be opened after the formation of the first candlestick, which closed outside the broken level.
With more conservative trading, before opening a position, you can wait for a retest of the broken-out level and then open a position. However, the retest does not always occur, and in some cases, the trader may miss a good entry point with such an approach.
With a more aggressive trading strategy, a trade can be entered within the pennant pattern formation since the trend lines are predetermined. With a bullish pennant, you need to wait until the price drops to the lower border of the pattern and enter a bullish long trade.
With a bearish pennant, it is important to wait for the price to rise to the upper limit and open a short position. But here, there is a risk of erroneous pattern assessment since the market may behave irrationally under the news background.
Pennant Trading Strategy 1: Trading based on flagpole height
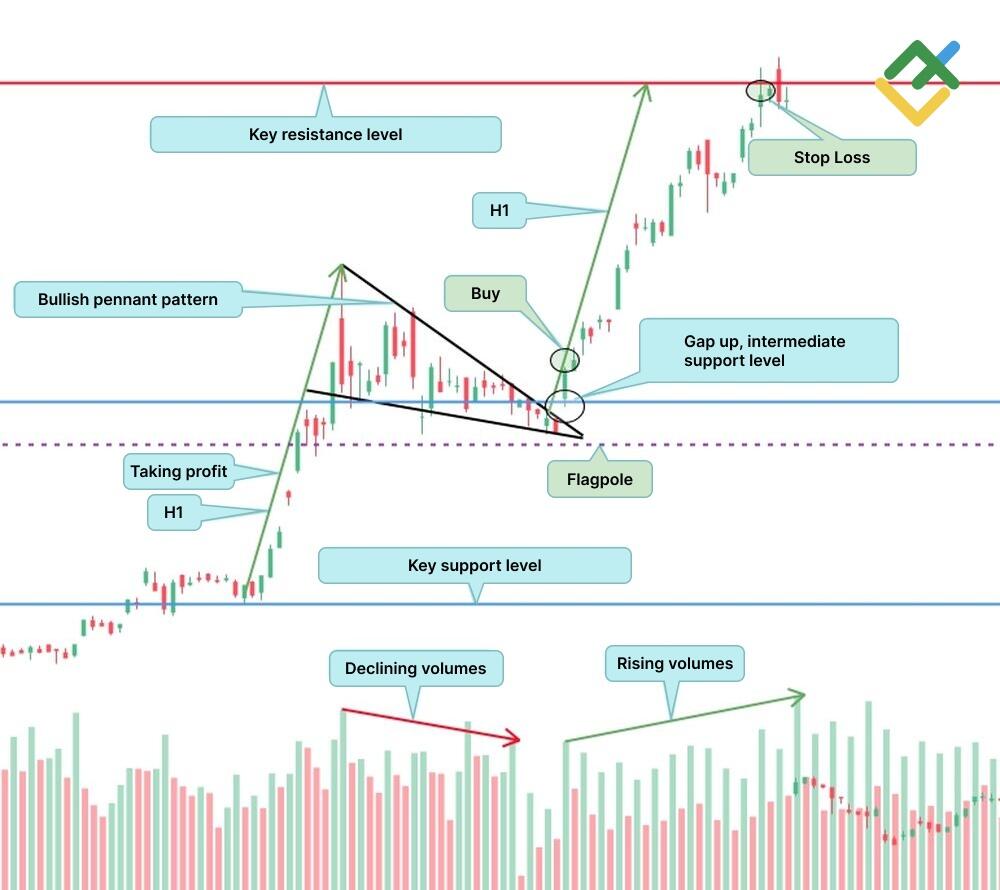
The essence of trading according to this strategy is to determine the target profit at the level of the figure's flagpole height. Let's take a closer look at trading the bullish pennant pattern according to this strategy using Tesla stock as an example.
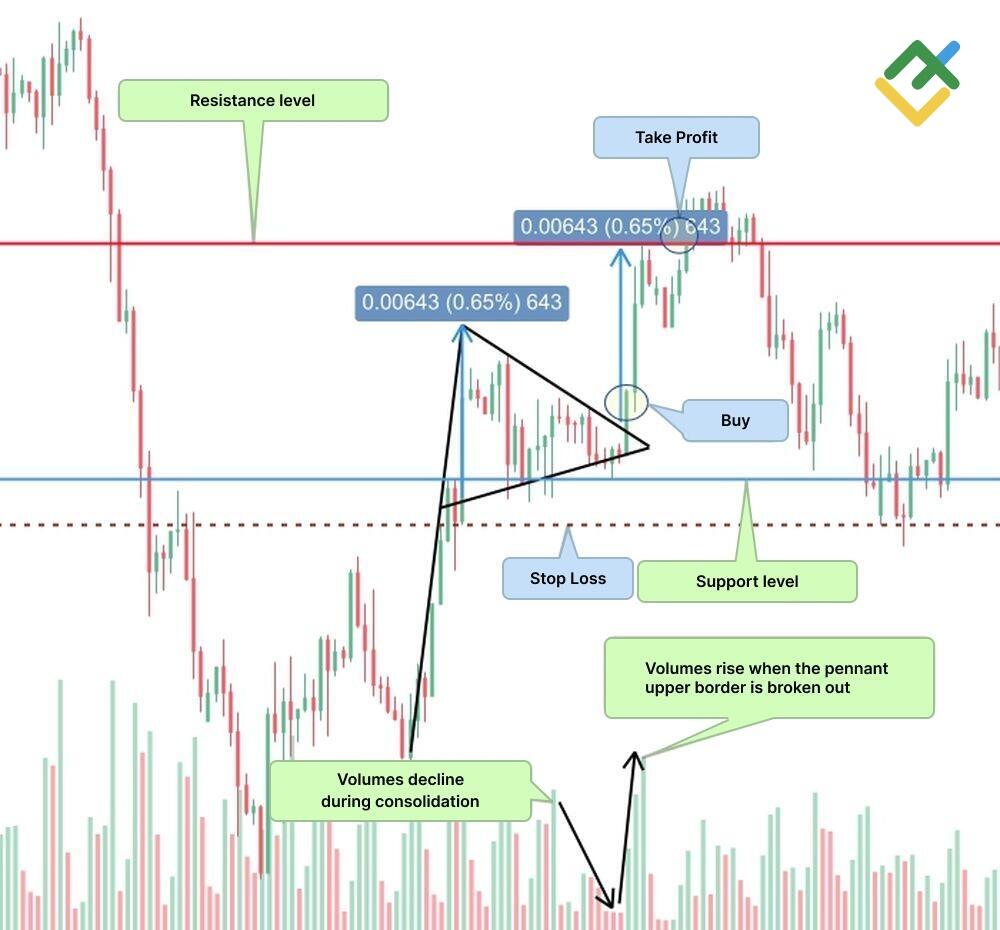
The four-hour chart below shows a bullish pennant pattern. After the formation of the flagpole, the asset began a correction in a narrowing triangle, forming the pennant itself. The decrease in volumes should be emphasized in this case. At the lowest point of the pennant, there was a breakout of the upper boundary on increased volumes.
In addition, a price gap up was formed during the breakout, which indicates the formation of a new intermediate support level. As you can see, there was no retest of the broken level. Therefore, it is necessary to open a long position after the close of the first candlestick formed above the pattern.
Take profit must be set at the distance equal to the flagpole height, where the resistance trend line is drawn. The stop loss is set just below the low of the pennant pattern outside the lower border of the pattern.
Pennant Trading Strategy 2: Trading based on Pattern Height
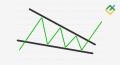
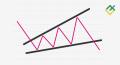
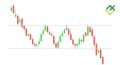
This strategy involves opening a position after building a pattern and breaking the upper or lower border of the pattern, depending on the trend direction. Let's take the USDCHF currency pair as an example of trading the bearish pennant pattern.
The hourly chart below shows a bearish pennant pattern characterized by decreased volumes during construction. Having previously determined the local support and resistance levels, the trader has a rough idea of the scenario where the price will go.
In this case, a short position must be opened after the breakout of the pennant lower border. In addition, the price tested the lower border, where the bears went ahead. This is also emphasized by growing volumes, which is one of the criteria for determining the pattern. According to this strategy, the take profit is defined by the height of the pennant itself. That is, from the highest to the lowest point formed in the pattern.
A stop loss, in this case, should be set a little higher than the converging lines of the pattern.
Pennant Trading Strategy 3: Trading based on 50% of the flagpole
Trading with this strategy means opening a position after the pattern breakout with a take profit at the level of 50% of the flagpole height.
Let us study the strategy on the example of the 30-minute BTCUSD chart.
The picture below shows a bullish pennant pattern.
The pattern construction implied further price movement along the upper trend line after a short stage of asset consolidation in a narrowing range.
A position is opened after the price breaks out the upper edge of the pattern.
A take profit is defined as 50% of the flagpole height.
According to risk management rules, a stop loss is set a little lower than the crossing of the pattern lined.
How to Trade Bullish and Bearish Pennants
Bullish and bearish pennants are predictable patterns in trading.
It will not be difficult for a trader to predict further price movement when these patterns are formed in the market if you know the basic principles and criteria for entering a trade
Below, I will give a step-by-step plan for trading bullish and bearish pennant patterns.
Find the perfect place to open your position
When a pattern is forming in any financial market, a position can be opened in one of three cases
- In a more conservative strategy, it is necessary to open a position after the pennant pattern breakout and re-testing the broken level by the price.
- With moderate trading, it is necessary to open a position after the breakout of the pattern. It is important that this breakout be confirmed by growing volumes and impulsive price movement.
- In a more aggressive trading strategy, a trade can be opened inside the pennant pattern. That is, with a bullish pennant, a long position must be opened around the lower border of the pattern when the price has reached it. And with a bearish pennant, on the contrary, a short position must be opened inside the pattern when the price reaches the upper border of the pattern.
Where to take profit
Profit on the bullish and bearish pennants pattern is also taken at three points. It can be measured by the following parameters:
- 100% flagpole height. After the pattern breakout, the price should be moving in the same direction at the distance equal to the flagpole height (previous impulse movement).
- 50% of the flagpole height. The take profit is set after the pennant breakout at the distance equal to half of the flagpole (previous impulse movement),
- The maximum height of the pennant pattern. the size of the further price movement is defined by the distance between the pattern's lowest and highest points.
Where to Stop Loss
Stop loss is an integral and especially important part of trading with leverage. Stop-loss for the pattern after entering a trade is set as follows:
- in a bullish pattern, the stop loss is placed below the intersection point of the upper and lower borders of the pattern;
- in a bearish pattern, the stop loss is placed above the intersection point of the upper and lower borders of the pattern;
Conclusion
To sum up, it should be emphasized that the pennant pattern is a trend continuation pattern, which has some similarities with the flag and symmetrical triangle patterns.
However, unlike the flag, the pennant pattern is built with converging lines that have an intersection point. Unlike the symmetrical triangle, the pennant pattern is formed much faster.
For successful trading in the financial markets, it is important to understand technical analysis as it reflects the psychological and fundamental components of what is happening worldwide.
And the LiteFinance company will help you with this, as you have the opportunity to get the opinion of the best leading financial analysts.
In addition, you can try out the acquired knowledge for free on a demo account using a wide range of trading instruments provided.
Pennant trading FAQs
After the formation of a bearish pennant pattern, it is necessary to wait for the price to break through the lower border of the pattern and open a short position, placing a stop loss just above the point of intersection of the pennant borders. A take profit must be set at a distance equal to the height of the flagpole or the pennant itself.
The pennant pattern can be either bullish or bearish. It depends on the direction of the trend, as the figure is a trend continuation pattern.
It is necessary to open a long position with bullish pennants after the breakout of the upper border of the pattern, placing a stop loss just below the point of intersection of the converging pennant lines. Take profit is determined by the level of the flagpole height or the maximum height of the pattern.
As a rule, bullish pennants occur in an uptrend. With a bullish pennant, a long position must be opened after the breakout of the pennant's upper border. Stop loss is placed below the crossover point of the pattern. The target profit is measured by the height of the flagpole or the height of the entire pattern. With a bearish pennant, a short position should be opened after the breakout of the pennant's lower border. Stop loss should be placed just above the crossover of the pattern borders. As in the case of bullish pennants, the profit target is set at the height of the flagpole or the entire pattern.
As a rule, a bearish pennant has a fairly clear structure. However, do not forget about market risks, due to which the pattern may not work out. This is due to various fundamental factors.
The pennant pattern is formed within the boundaries of two converging lines, the resistance, and the support. These lines are directed symmetrically, which gives the pattern the shape of a symmetrical triangle. Therefore, the bullish pennants, just like the bearish ones, cannot be rising.
A bullish pennant is formed after an impulse price increase. Therefore, first, you need to find an upward price impulse in the price chart, after which consolidation begins within the boundaries of the converging lines, that is, a bullish pennant is formed.
You open a buy position with a bullish pennant after the price breaks out the pattern's upper border when there is a clear signal of the uptrend continuation.
The bullish pennant pattern is predictable and accurate, as it has a well-established structure and strategy for trading.
The pennant is a trend continuation pattern. Therefore, after the pennant pattern completes, the price will continue moving along the current trend.
The content of this article reflects the author’s opinion and does not necessarily reflect the official position of LiteFinance broker. The material published on this page is provided for informational purposes only and should not be considered as the provision of investment advice for the purposes of Directive 2014/65/EU.
According to copyright law, this article is considered intellectual property, which includes a prohibition on copying and distributing it without consent.