The priority for a trader working in financial markets is profitable trading and investment. To earn a stable income, you need to determine the beginning of a trend correctly. According to most professionals, trading with the trend is the only effective way to get the maximum possible profit with minimum risks.
However, it is not always easy to spot the trend beginning as the market is often unpredictable. Here, one can use different candlestick chart patterns of both trend reversal and continuation. One of the patterns signaling a trend beginning is a descending triangle formation covered in this article. Read on, and you will learn how to identify descending triangles in the chart and trade them to make profits.
The article covers the following subjects:
What is a Descending Triangle?
A descending triangle is a bearish pattern that most commonly occurs in a downtrend. However, the formation can also emerge in a bullish trend, signaling a price reversal down.
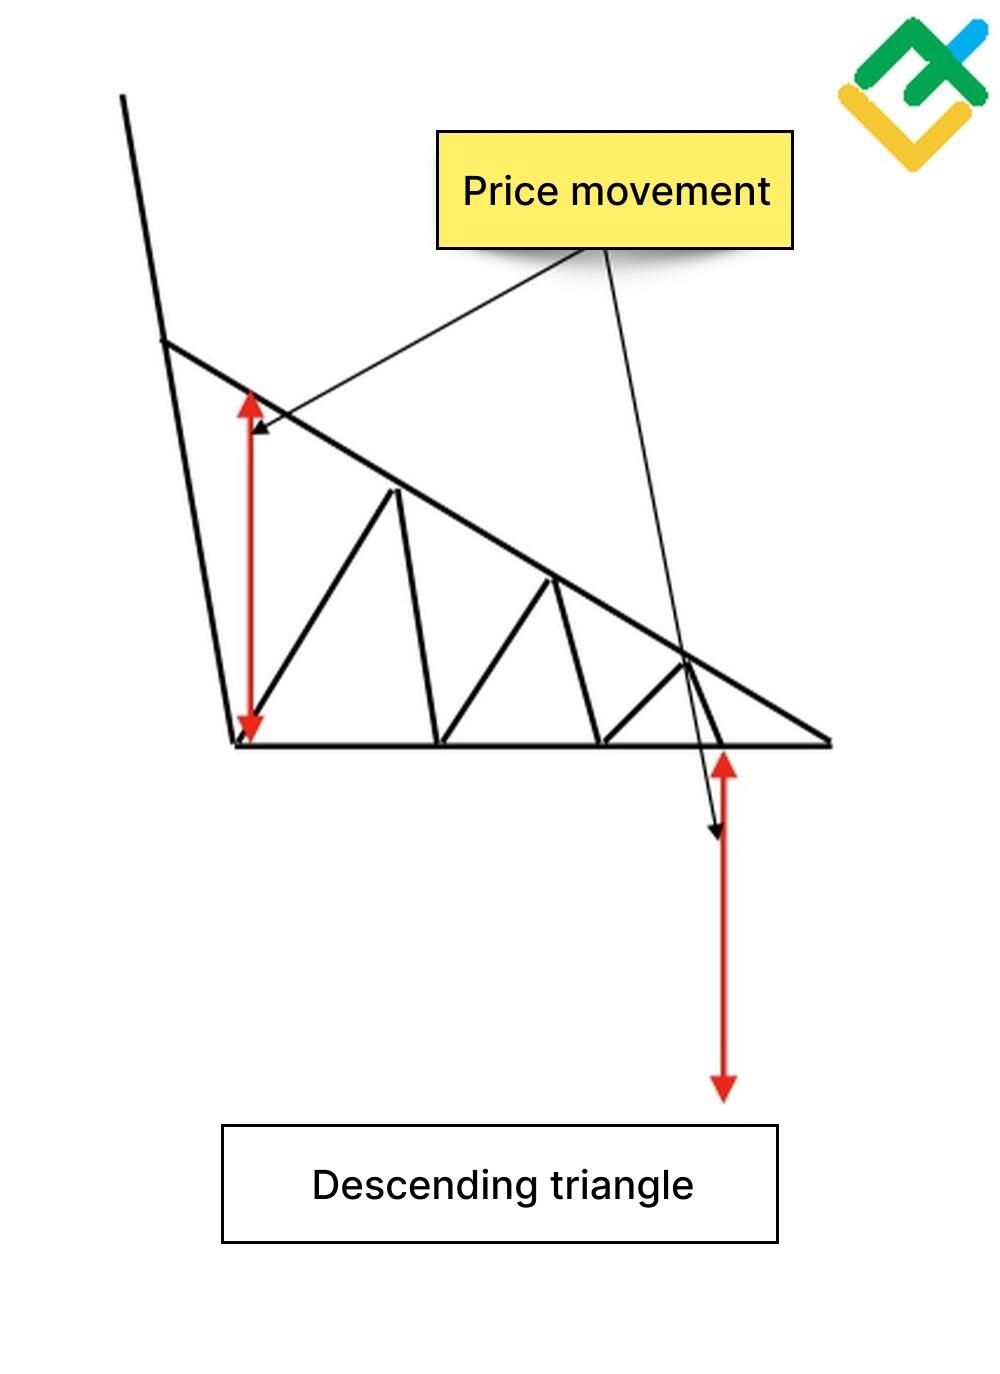
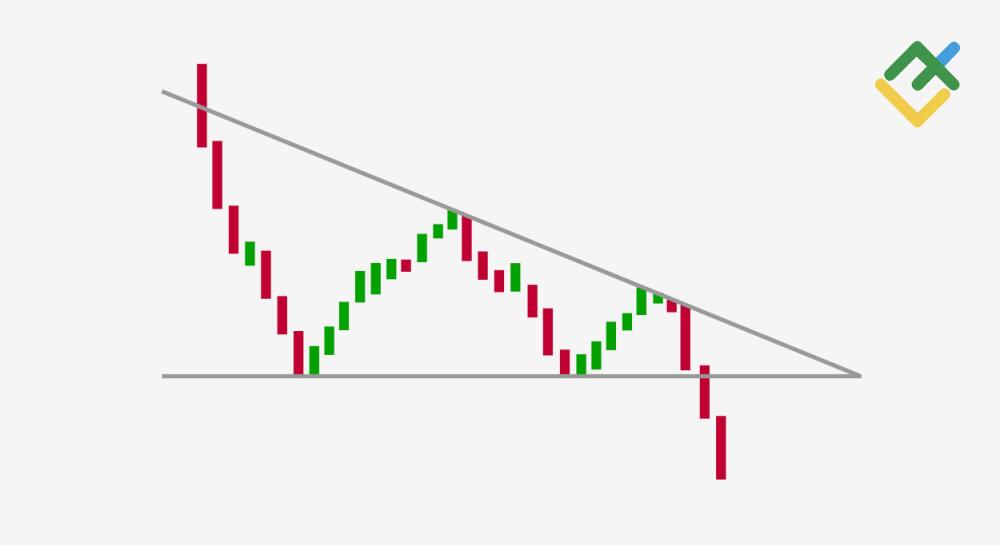
The pattern looks like a triangle with falling highs and a flat support level after a major downward movement. Clearer outlines of the descending triangle can be seen on the timeframes starting from H4 and longer.
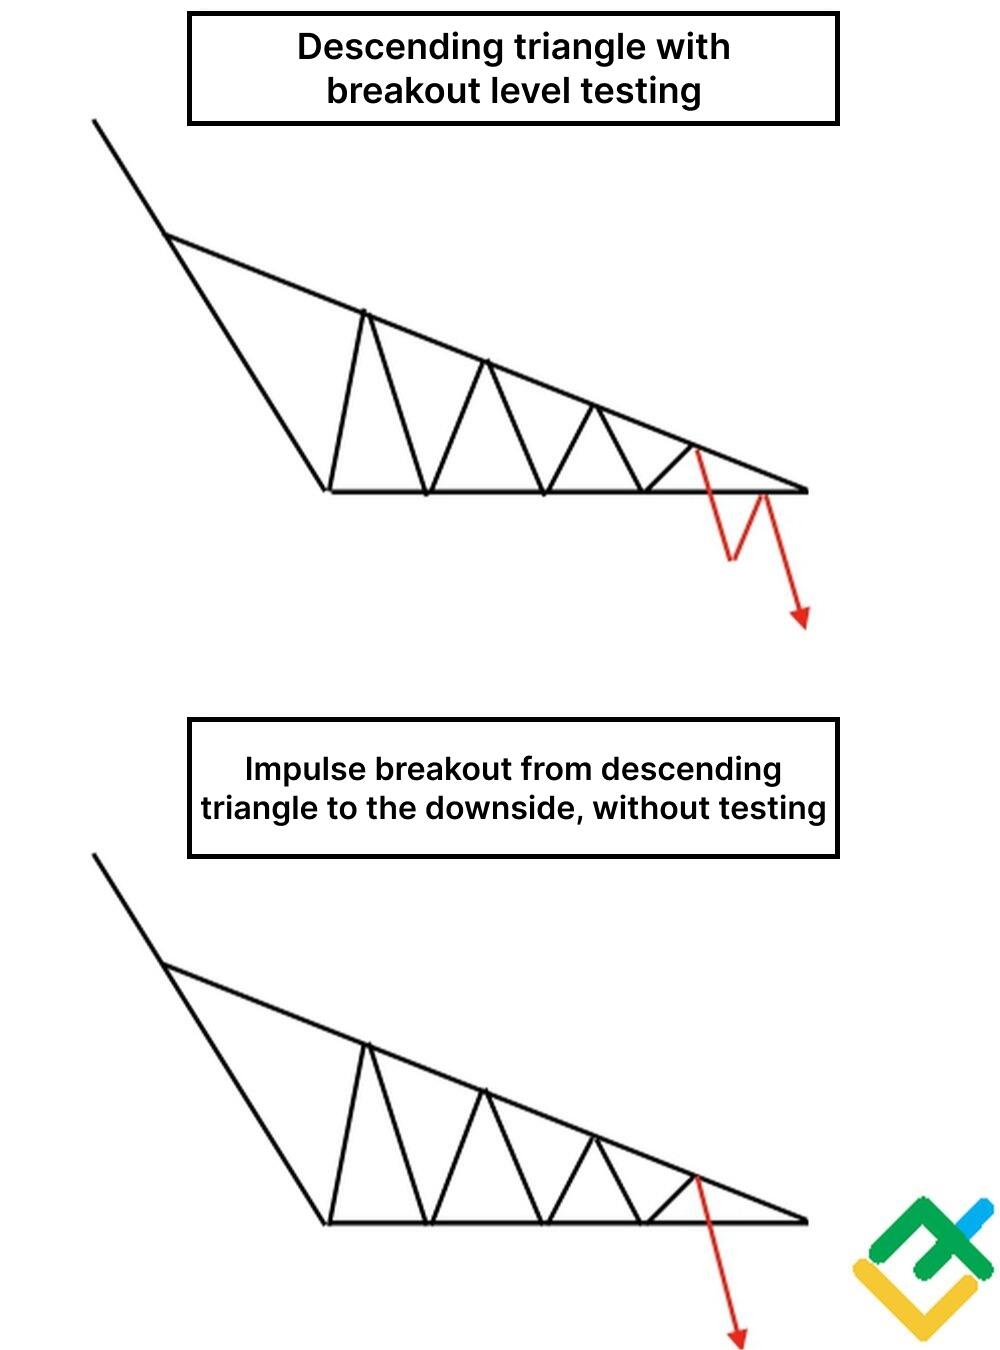
The feature of a descending triangle is its long construction from level to level, indicating the weakening of bulls in the market. When a descending triangle pattern completes in the price chart, the bears break out the lower border of the pattern, and the price continues declining.
You can come across a descending triangle in any type of financial market: stock market, Forex, crypto market, commodity, and others.
Key facts
A descending triangle is a bearish pattern that signals the continuation of a downward trend.
A descending triangle pattern is the opposite of a bullish ascending pattern.
The descending triangle trading strategy has clear exit and entry rules. Additionally, by plotting the pattern on a chart, traders can determine the approximate size of the price movement. Which, in turn, allows one to determine the most profitable short entry points and a reasonable stop loss level.
In a bullish trend, a descending triangle pattern can warn about a soon trend reversal.
What Are The Differences Between Descending and Ascending Triangles?
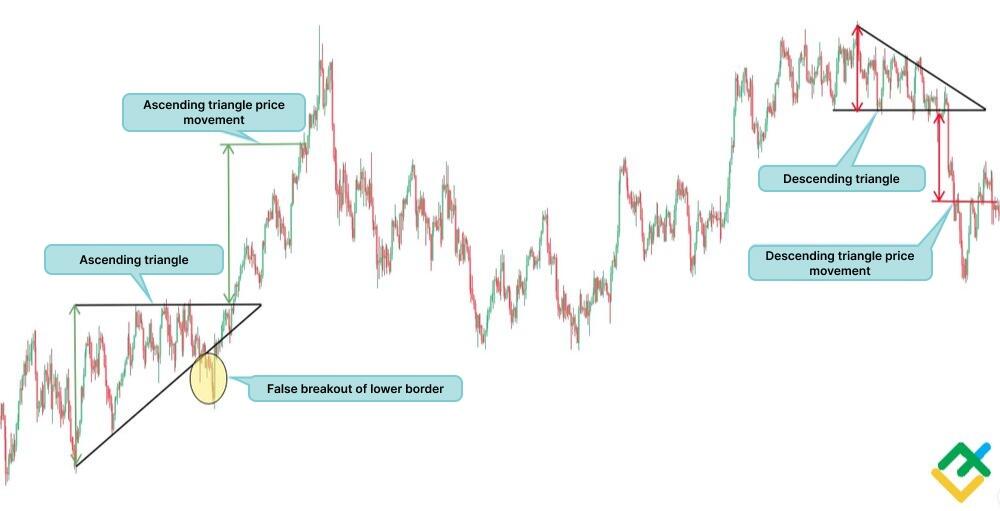
The main difference between the descending and ascending triangle patterns, as the names suggest, is the direction of price movement. But there are other differences:
A descending triangle occurs in a bearish trend. The pattern has a lower flat line that acts as a support level and a descending upper trendline. The highs are lowering, driving the price close to the support line. The lows remain at the support level.
An ascending triangle has a horizontal resistance line on the highs and a rising trend line on the lows. The lows are rising, while the highs remain on the resistance level.
Unlike the symmetrical triangle pattern, the ascending and descending triangle more accurately demonstrate the further price movement. The symmetrical triangle is quite unpredictable and can be followed by downward or upward breakouts.
What Does a Descending Triangle Tell You?
A descending triangle is a bearish continuation pattern that signals a lowering demand for an asset. The formation indicates increasing selling pressure.
Based on technical analysis, trading volume decreases during the descending triangle construction. The price continues bearish momentum following the breakout of the horizontal support line. At the same time, trading volumes grow significantly, returning the volatility and investor interest in the instrument.
Knowing the further price movement after the descending triangle forms in the chart, one could enter a short trade and make a profit.
Despite the long formation of the pattern, one could make a faster profit when trading this pattern. In terms of technical analysis, the pattern breakout is a bearish signal. Placing market or limit orders creates momentum down to the target price. The selling pressure becomes so strong that the price continues to decline, collecting liquidity below.
It is important to wait for the bearish breakout of the support level and the price consolidating below. After this, you can safely open a short position by setting a stop loss above the support line.
Descending Triangle Example
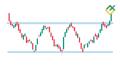
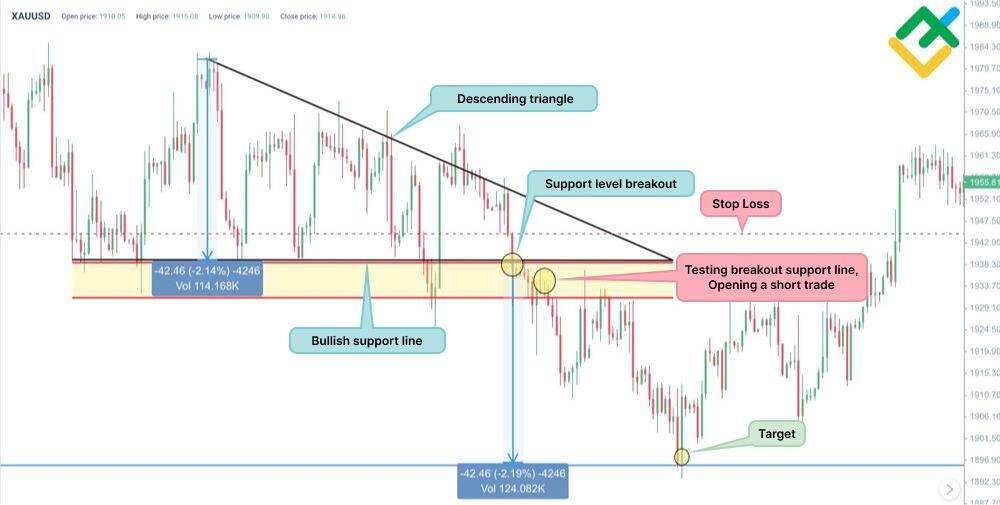
Let's look at an example of a descending triangle pattern in the XAUUSD chart. There is a clear downtrend in a four-hour timeframe. The price reached the first low near the support level of 1938.30, after which it bounced up and reached the first price high.
Next, you see that the price fluctuates, narrowing the range of asset accumulation. That is, the lows remained in the area of the support line, and the highs decreased and formed a sloping trend line. After a long consolidation, sellers managed to break out the support level.
Buyers tried in vain to return the price to the bearish triangle range. However, after testing the broken-out level, one can open a short position at the level of 1933.70 with a stop loss above the support line at 1942.90. The target is determined by the height of the descending triangle. As a result, in a week of an open short position, you can take more than 2% of profit with a clearly verified trading algorithm using the descending triangle.
How to Identify a Descending Triangle Pattern
The descending triangle pattern can be identified in the chart quite simply. The key features of the formation:
Most commonly, the descending triangle occurs in a downtrend, signaling its continuation;
The lows remain on the same support level; that is, a flat support line is formed in the descending triangle;
The highs in the triangle range decrease as the bulls try to restore the price;
The descending trend line and the flat support line meet at one point, forming a triangle;
The triangle is built based on the first two points in the zone of highs and lows.
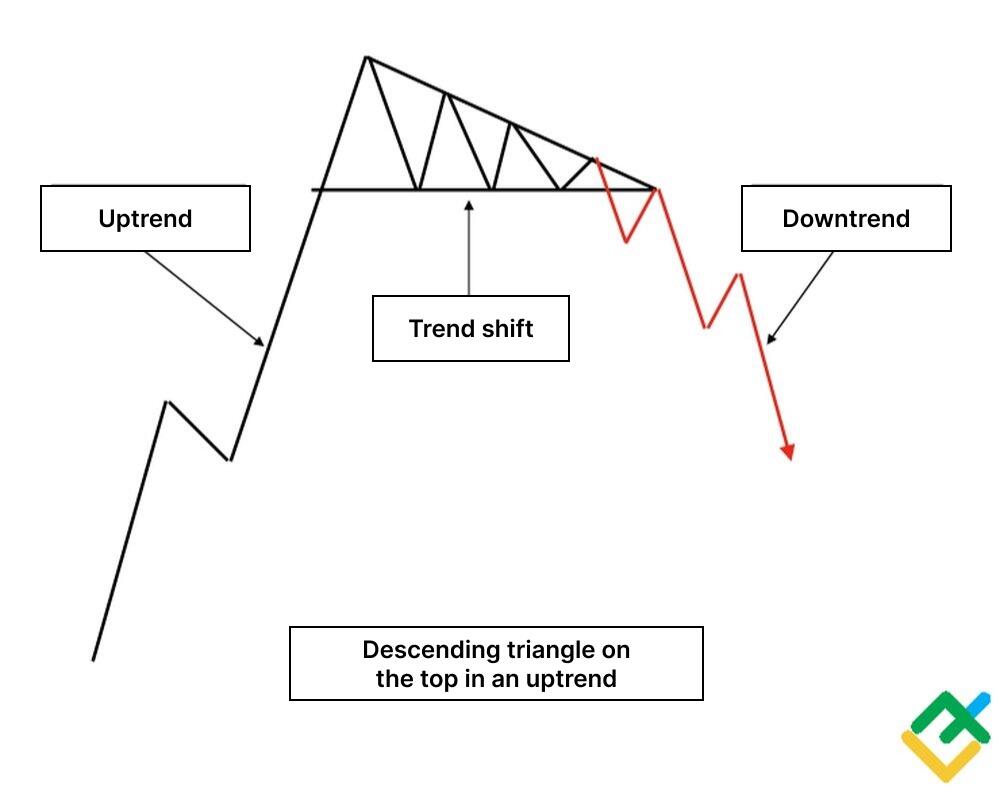
Often, the descending triangle pattern occurs at a high in a bullish trend. From a psychological point of view, a descending triangle in the zone of high prices shows that the trend has reached its peak, and traders have started to close positions, taking profits. In this context, the triangle serves as a reversal pattern that warns traders that the trend will soon change to bearish.
The principle of constructing a descending triangle in a bullish trend is the same as in a downward trend. The chart formation has a horizontal support and an inclined resistance level after the price turns down.
Descending Triangle Measuring Technique
The Descending Triangle pattern is measured by the height of the triangle itself. To determine the profit target, it is necessary to draw a line from the maximum point to the horizontal line.
Subsequently, this will serve as a price range for determining take profit.
After defining the price movement, the indicated segment is superimposed from the lower support line downwards. The endpoint will be the potential take profit level for the trade entered according to the descending triangle pattern.
In addition to the main method of measuring the take profit using the descending triangle pattern, there is another measurement method. Due to the fact that one of the sides of this chart formation has a horizontal support level, it is possible to set the perpendicular line higher to the level of the highest high. This will also allow you to define the approximate target profit for an open short position.
How To Trade Descending Triangle
Knowing the criteria for building a descending triangle pattern, you can create a step-by-step guide to trading this chart formation.
It is better to look for the descending triangle formation in a downtrend to increase the probability of the signal being generated according to the pattern.
Using longer timeframes, starting from H4, is better for chart analysis. For day trading, one could use timeframes starting from H1 and longer.
Having discovered a descending triangle in a bearish trend, you need to make sure that its construction is accurate. Draw an inclined trend line from the highest point, using the second high a little lower. It is also necessary to draw a horizontal support line, connecting it to the trend line.
To define a potential profit, draw a straight vertical line from the highest point to the support line. Then, move it, pointing downward from the support level.
Next, you can put a sell limit order below the support line. Or you can expect when the price breaks out the support level and tests it following the consolidation phase and set a market order to sell.
A stop loss is set above the support level around the most recent high on the sloped trendline.
Meeting these conditions will allow you to make the maximum profits and minimize the risks.
Descending Triangle Trading Strategies
Like any price chart pattern, the descending triangle pattern has its own unique and profitable trading strategies. Let us study the most popular descending triangle strategies using different trading instruments.
The Descending Triangle Breakout Strategy
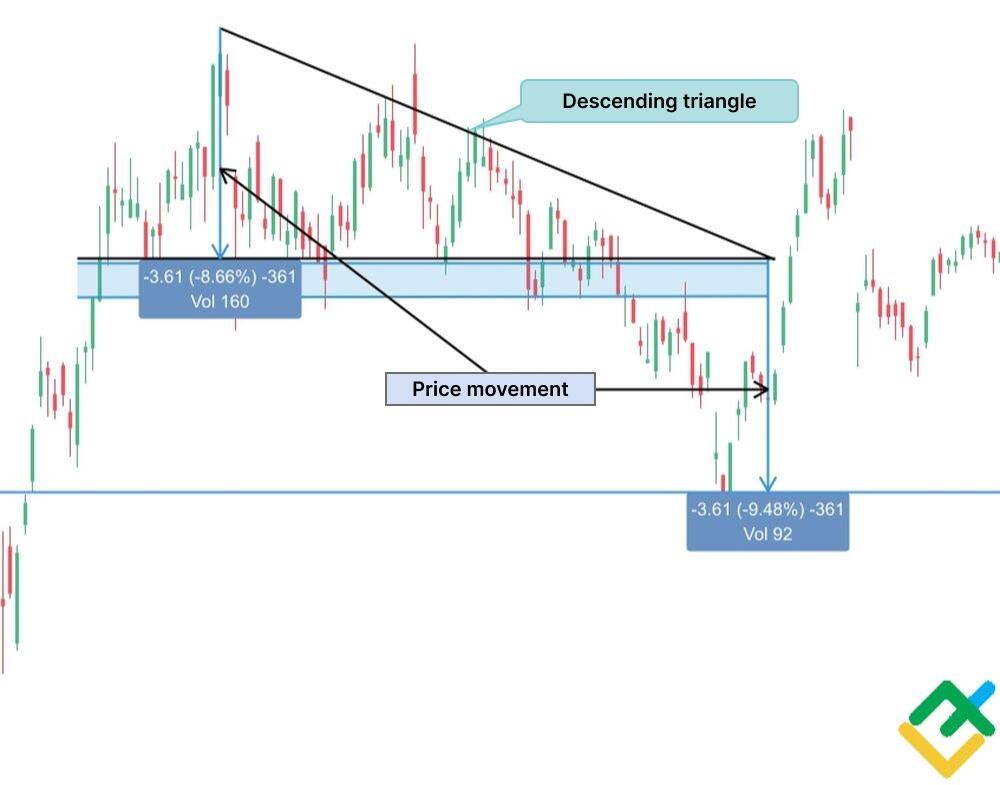
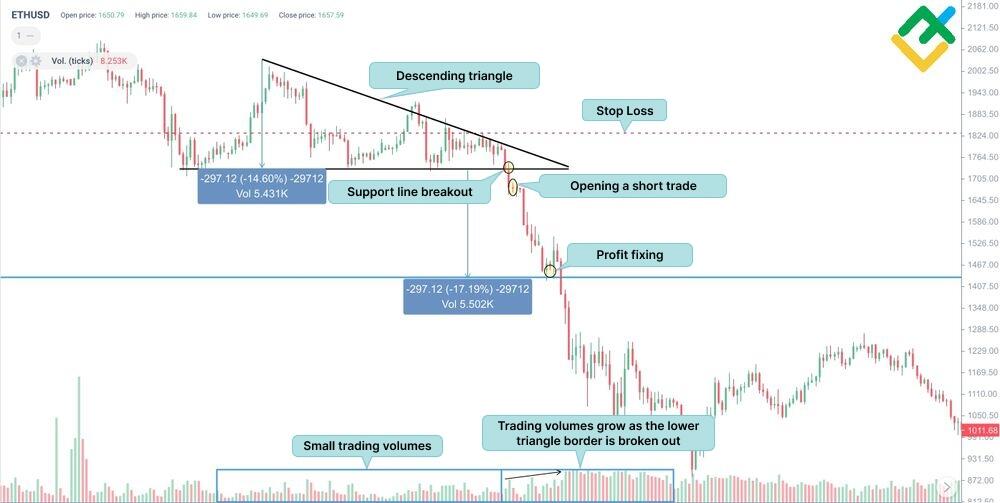
The principle of the trading strategy is seen in its name. It involves entering a short trade following an impulse breakout of the key support level. Let us look at this type of strategy in more detail on the example of the ETHUSD H4 chart.
As you can see in the figure below, the digital asset price has drawn a descending triangle in the range of 1764.50-2002.50. A characteristic feature of the pattern is decreasing trading volumes during accumulation.
After narrowing the price range, sellers break out the support line, forming a downward impulse red candlestick. At the same time, trading volumes start rising.
According to this strategy, you can open a position after the first impulse candlestick closes below the support level of 1705.00. That is, the cryptocurrency pair consolidated lower, which signals to enter a short.
According to the method of determining potential profit from a pattern, the price target can be set at 1407.50. As you can see, the price of the asset decreased to the take profit level in 2 days. In this case, the stop loss can be set higher, around the most recent high in the triangle at 1824.00.
The Descending Triangle on Heikin Ashi Charts
Heikin Ashi is a type of Japanese candlesticks. "Heikin" means "average," and "Ashi" means "tempo", which literally translates from Japanese as "average price pace".
Unlike a classic candlestick chart, the Heikin Ashi chart shows the opening and closing prices, high and low, and the previous period's opening and closing prices. This filters out market noise and more accurately determines the trend.
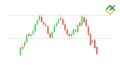
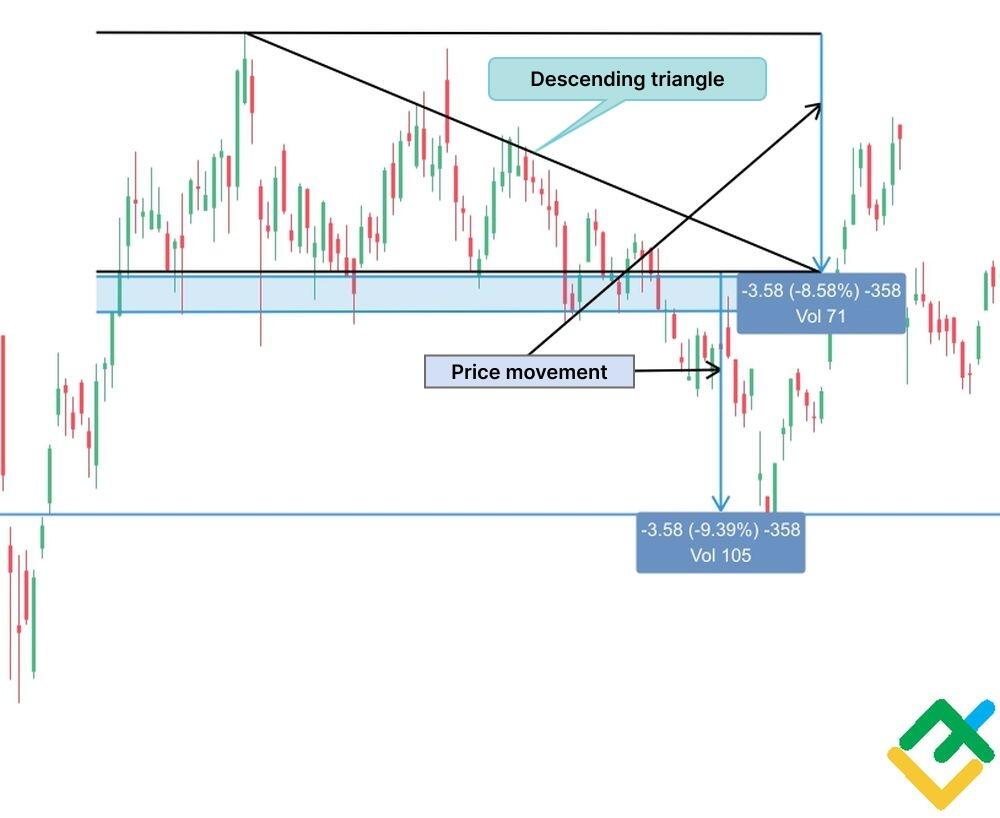
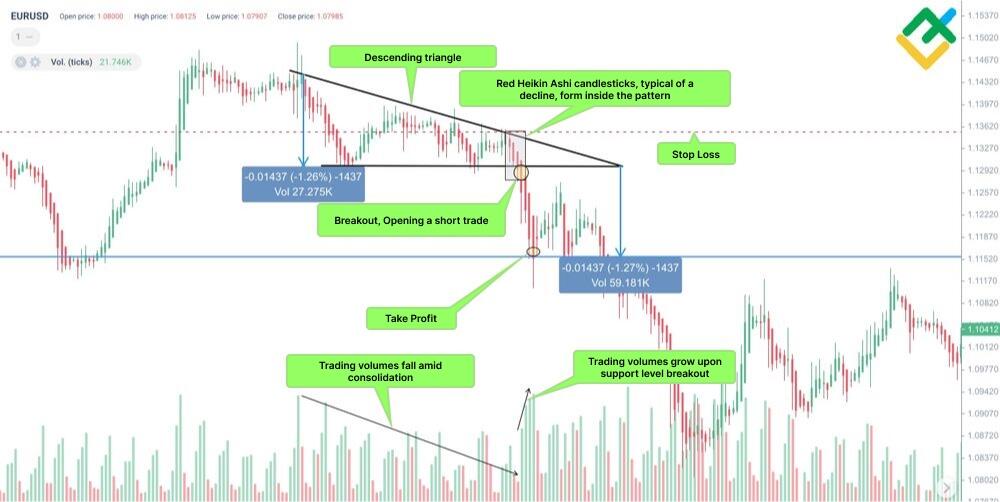
Let us study this type of strategy on the example of the EURUSD pair. The four-hour Heikin Ashi chart shows that the currency pair has drawn a descending triangle price pattern. Market trading volumes decreased during the accumulation period.
The key signal for a further price decline is the formation of red candlesticks within the chart pattern and an increase in trading volumes. That is, Heikin Ashi candlesticks indicate the direction of the trend down some time before the breakout of the key support level. Traders have the opportunity to anticipate a breakout of the lower boundary of the pattern in advance and open a short position immediately after the price overcomes the support level at 1.1292. The take profit and stop loss levels for this strategy are determined in the same way as in the previous one.
The Descending Triangle with Moving Averages
For a clearer signal, many traders often use a combination of technical analysis methods. In addition to the descending triangle type patterns, you can use candlestick analysis, price action, and technical indicators.
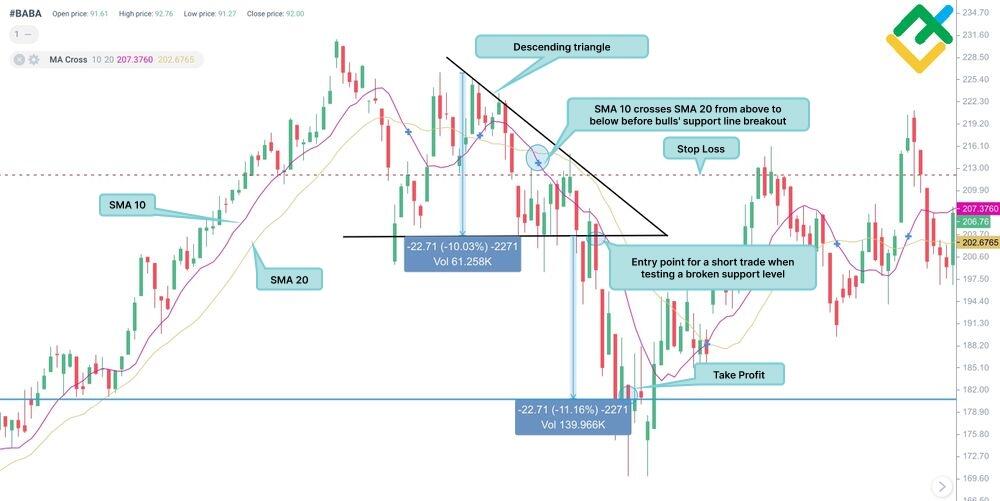
Let us analyze the combination of the descending triangle and the moving average crossover indicator MA Cross using the example of Alibaba Group Holding Ltd.
MA Cross parameters can be adjusted at the discretion of each market participant. We will choose more optimal parameters with a 10-day fast moving average and a 20-day slow SMA. The shorter the periods of moving averages, the more market noise they will pick up. This can lead to many false breakouts and incorrect forecasts.
The daily chart below shows that the MA Cross has formed a short-term death cross in the form of a fast SMA crossing the slow moving average inside a descending triangle pattern. In this case, the death cross served as a signal for the bears to look for a profitable short entry point. In addition, the intersection of the moving averages showed that the bulls' strength had been exhausted and confirmed the descending triangle price chart pattern.
When using a more conservative short trading strategy, the position should have been opened only after the breakout level and testing of the support line. It is at this point that sellers accumulate large selling positions. Two confirming factors, such as the intersection of moving averages and a downward breakout price of the pattern, strengthen the sell signal.
In a more aggressive trading strategy with higher risks, you can enter a short trade after the price has bounced off the upper boundary of the pattern. In addition, during the rebound, the price drew the most recent price high, forming a bearish shooting star candlestick pattern. This served as an additional reversal signal.
The Descending Triangle Reversal Topping Pattern
The descending triangle chart pattern can also be found at the top of a bullish trend as a reversal pattern. When a descending triangle appears in the zone of high prices, it signals a lower demand for the instrument in the market and a declining buying pressure.
The principle of constructing the descending triangle formation is the same as in previous strategies: the price forms a horizontal support line and an inclined resistance line with decreasing highs at the top.
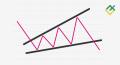
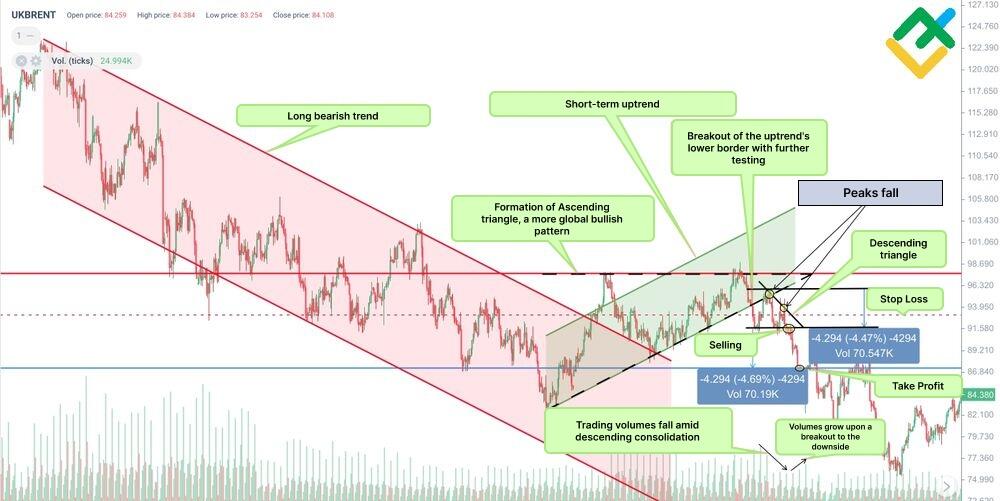
An interesting situation arose on the four-hour UKBRENT chart. After a long decline in the oil prices, the bulls broke out the upper trend line, turning the price upward.
It is noteworthy that a bullish ascending triangle began to emerge for the instrument more globally, the breakout of which upward would mean a final price reversal.
However, after the second test of the resistance level at 98.69, bears went ahead, the selling pressure increased, and the price began to decline without breaking out the resistance. In addition, sellers broke out the lower border of the ascending triangle pattern and consolidated the price below. This means the bulls lost control over the market and cancels the ascending triangle chart pattern. The overall trend turned down.
It should be emphasized that financial markets are irrational, and such unusual situations may arise from time to time. Therefore, when opening positions in the market, it is important to maintain a risk-to-reward ratio and set a stop loss.
Having broken out the lower leg of the ascending triangle pattern, the price started drawing a descending triangle pattern.
Furthermore, trading volumes declined, signaling that traders were losing interest in the trading instrument.
After the formation of two decreasing price highs and a horizontal support line, the bulls are unable to maintain their positions, and the price breaks through the key level at 91.58. At the same time, trading volumes begin to grow noticeably.
According to the rules of trading the descending triangle pattern, one should enter a short trade at this moment. The profit target can be determined in advance by measuring the height of the triangle from the highest high to the low on the support line. In this case, the stop loss must be set in the zone of the second high of the triangle at the level of 93.95. The risk-to-profit ratio for this transaction is 1/3, which fully satisfies the rules of risk management and money management.
The Descending Triangle Reversal Pattern at Bottom
Most commonly, the descending triangle pattern is more of a bearish formation and traditionally represents a downtrend continuation pattern.
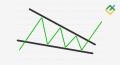
Sometimes, although less often than at the top or middle of a downtrend, the pattern can also be found at the bottom. The formation of this chart pattern in the zone of low prices, paradoxically, means a possible upward price reversal with a subsequent change in trend.
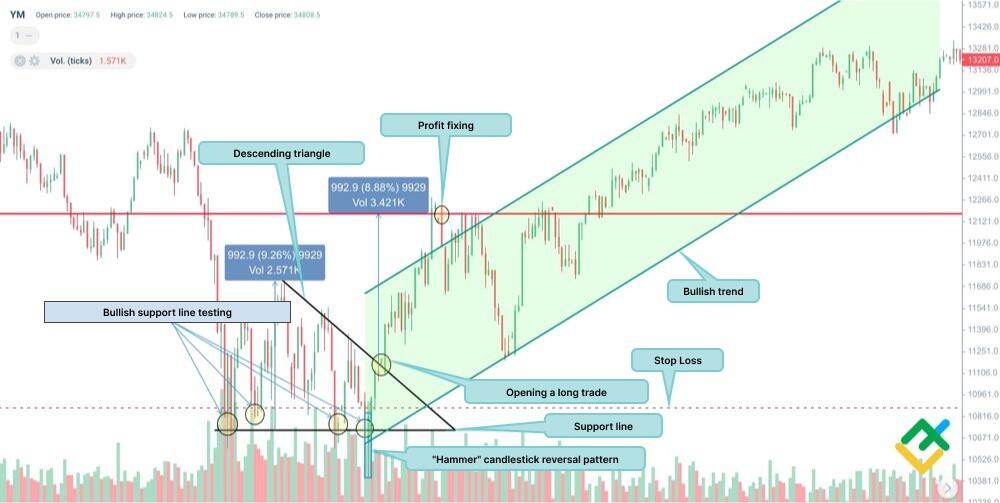
A descending triangle at the bottom indicates the possibility of opening long positions and the asset likely reaching the low, below which won’t go. In the above chart of the Dow Jones index, a descending triangle pattern has formed, the price exiting from which went up.
The attempt of the bears to break out the key support level did not yield results. The picture below shows that sellers tried to break out the level of 10671.0 four times, but the price again and again impulsively rebounded from this level.
In addition, in the last attempt of the bears to break through the level, the index price formed a bullish hammer reversal pattern, which marked the beginning of a long rise in prices.
The descending triangle pattern at the bottom is a mirror image of the bearish form of the pattern. Therefore, the entry point, take profit, and stop loss levels can only be measured in the opposite direction.
Thus, a long position on the instrument can be opened after the price action breaks out level 11106.0 upside with an already defined target at the nearest resistance level of 12121.0. Stop loss can be set in the zone of the pattern lows at 10816.0.
Conclusion
The Descending Triangle pattern is a bearish chart pattern. It is easy to read on the chart and has its own clear calculation. This is one of the key patterns in trading, which signals the continuation of a downward trend and can indicate a possible price reversal both at the top and at the bottom.
During the formation of a descending triangle on the chart of a particular asset, there is a decrease in trading volumes and interest on the part of technical traders in the trading instrument. However, when the lower boundary of the pattern is broken, interest is renewed, as there is an opportunity to make good and quick money. One of the best brokers in the market — LiteFinance — will help you put your acquired knowledge into practice.
Descending triangle pattern FAQs
You should open a short position using the descending triangle pattern after the price breaks out its lower border, the support level. Consequently, having broken the support line, the price should decline for the vertical distance of the triangle’s height.
A descending triangle pattern forms in the middle of a downtrend or at the top of an uptrend. A descending triangle is a bearish trend continuation pattern, but in some cases, it can warn of a change to the opposite direction.
The classic descending triangle pattern signals a downward trend breakout. However, its formation at the bottom warns of a price reversal upward and a trend reversal up.
A breakout of the upper trend line is caused by market conditions for a specific period. As a rule, an upward breakout with descending triangles may occur less frequently in the market, in contrast to the ascending triangle pattern.
A Descending Triangle is a bearish trend continuation pattern. During its formation, the trading volume declines. Next, when the price breaks out the lower boundary, the volumes increase sharply. This gives momentum to the price and helps achieve the profit target in the shortest possible time.
Yes, a descending triangle can be bullish. If the price has already dropped sufficiently, building a pattern at the end of a downtrend signals a soon price reversal upward. This makes it a bullish form of the pattern.
A breakout of the descending triangle means that the price has dropped below the support level, which strengthens the downtrend for the instrument, and the price continues to decline at a faster pace.
First, expect until the price breaks out the triangle downside and a possible test. Next, you enter a short trade and set a stop loss around the most recent high within the pattern. The take profit is determined by the height of the descending triangle, the distance between the highest price and the support level. The bottom point of the segment will be the approximate target.
A descending wedge is a bullish formation followed by an upside breakout. A descending triangle is a bearish pattern of continuation of a downward trend, and the price breaks it out downside. A wedge is a narrowing downward price channel in which the lines do not join together, unlike a descending triangle. In the triangle, the lines are connected, giving the pattern the appropriate the appropriate shape.
The content of this article reflects the author’s opinion and does not necessarily reflect the official position of LiteFinance broker. The material published on this page is provided for informational purposes only and should not be considered as the provision of investment advice for the purposes of Directive 2014/65/EU.
According to copyright law, this article is considered intellectual property, which includes a prohibition on copying and distributing it without consent.