When a trend dominates the market, few doubt who controls the situation. The crowd is trying hard to jump into one of the cars of the train leaving in a certain direction, analysts write the same typical forecasts, and any proposal to cross the road is perceived by the majority as dissent. It's different when the market consolidates. Large fishes fight for the initiative, banks and investment companies give different estimates of the current situation, and the plankton rushes from side to side. In this scenario, the best thing a trader can do is apply the Coyote tactics. Stand on the sideline and wait until the battle of lions is over.
The article covers the following subjects:
Coyote Tactics: the Expanding Wedge will show the way
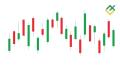
If both opponents are strong, then, as a rule, this is expressed in the rewriting of extremums by the chart. The emergence of several consecutive highs and lows simultaneously indicates an increase in volatility and blood fight for the initiative. What you need to do is take the side of the winner. The Expanding Wedge pattern on the basis of the 1-2-3 pattern will tell you how to do this. This graphical configuration was developed by Thomas Bulkowski and first mentioned in the book Encyclopedia of Chart Patterns. I have used the techniques for improving it and trading strategies from my personal practice.
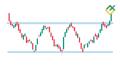
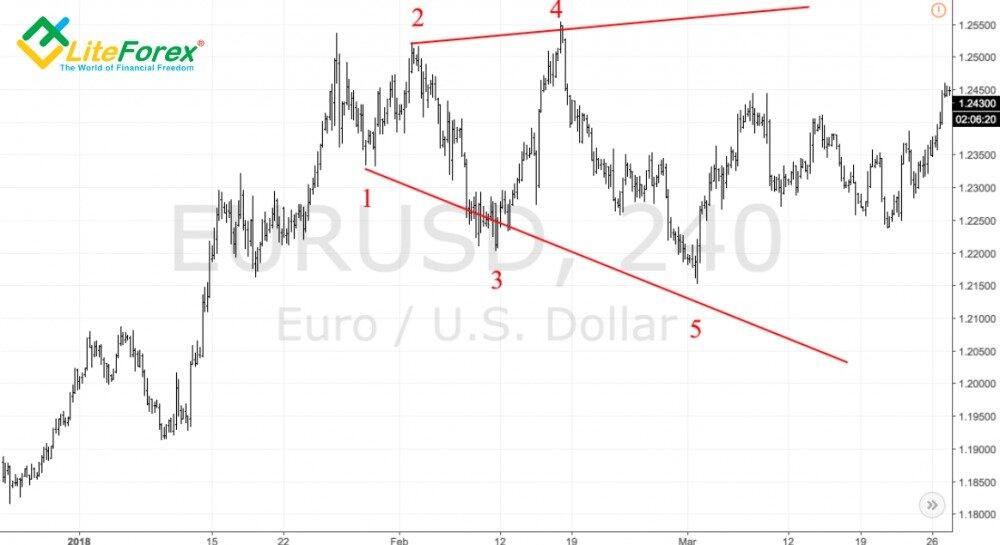
Identification of the model begins with the appearance in the chart of the 1-2-3 pattern. If it occurs in a bullish market, then the inability of the bears to reverse the trend through the breakout of point 2 is the first sign of the strength of their opponents. Buyers launch the attack, they test the high at point 3, however, their hopes will not come true either. The quotes go into consolidation, and the trader redraws the points in the chart. The starting point is the correctional low (point 2 of 1-2-3 pattern). As a result, we have an Expanding Wedge - a combination of two differently directed lines 1-3 and 2-4. The struggle of the two lions reaches the boiling point, and the coyote continues to wait. Ultimately, endurance is almost the most important quality that a trader must possess.
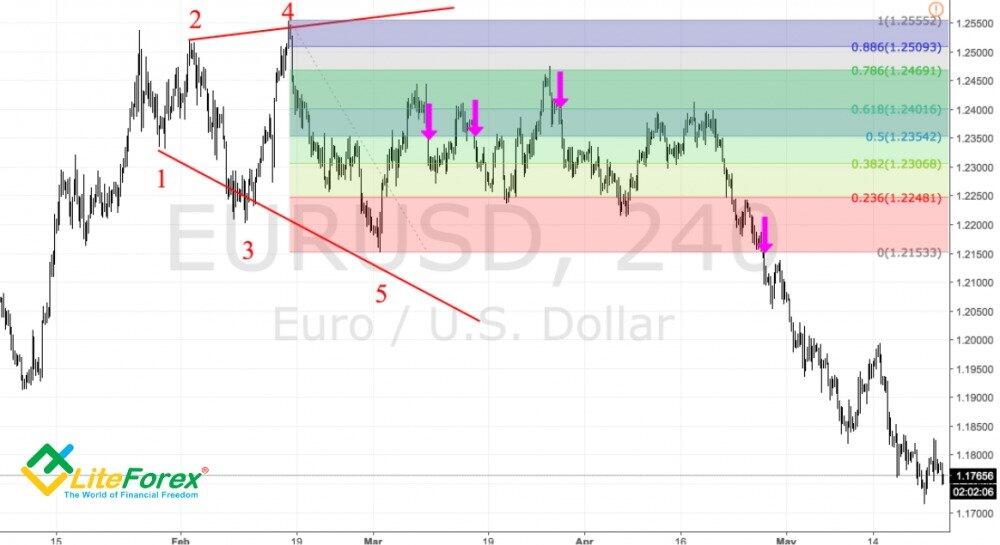
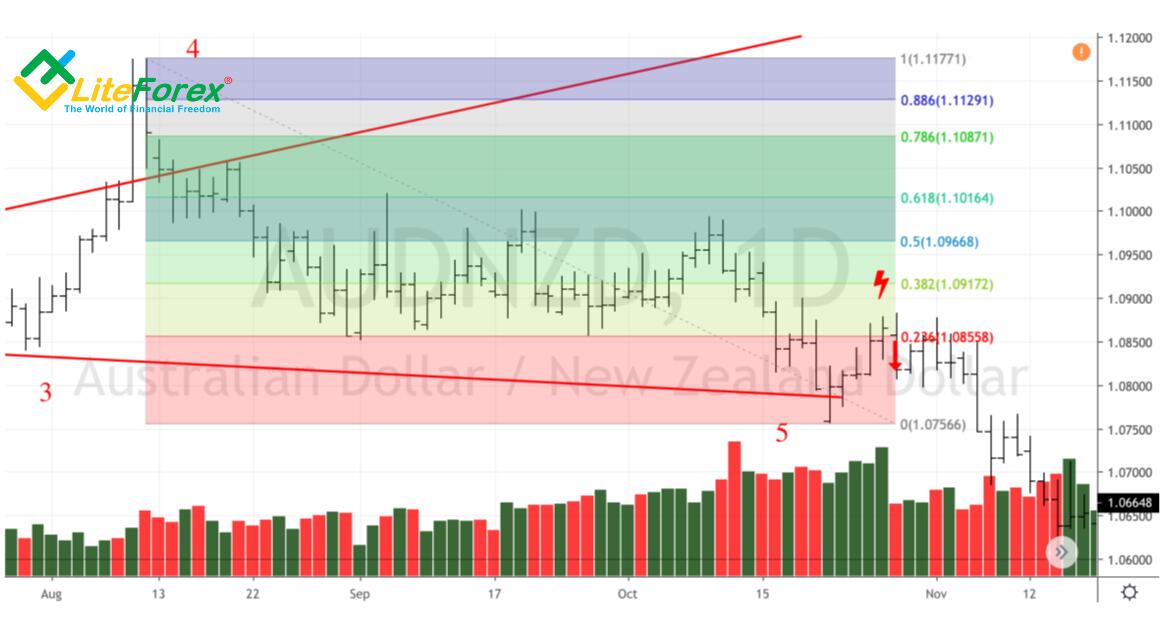
As soon as the quotes of the analyzed pair update the low at point 3, point 5 appears. It does not have to be on the line 1-3. The depth of its location does not matter either. Formation of the Expanding Wedge pattern is considered complete if after point 5 there is a rollback in the direction of 23.6%, 38.2%, etc. of the waves 4-5. The pattern is a reversal pattern, but if the correction passes the level of 88.6%, then it should be considered a trend continuation pattern. The critical value is 78.6%.
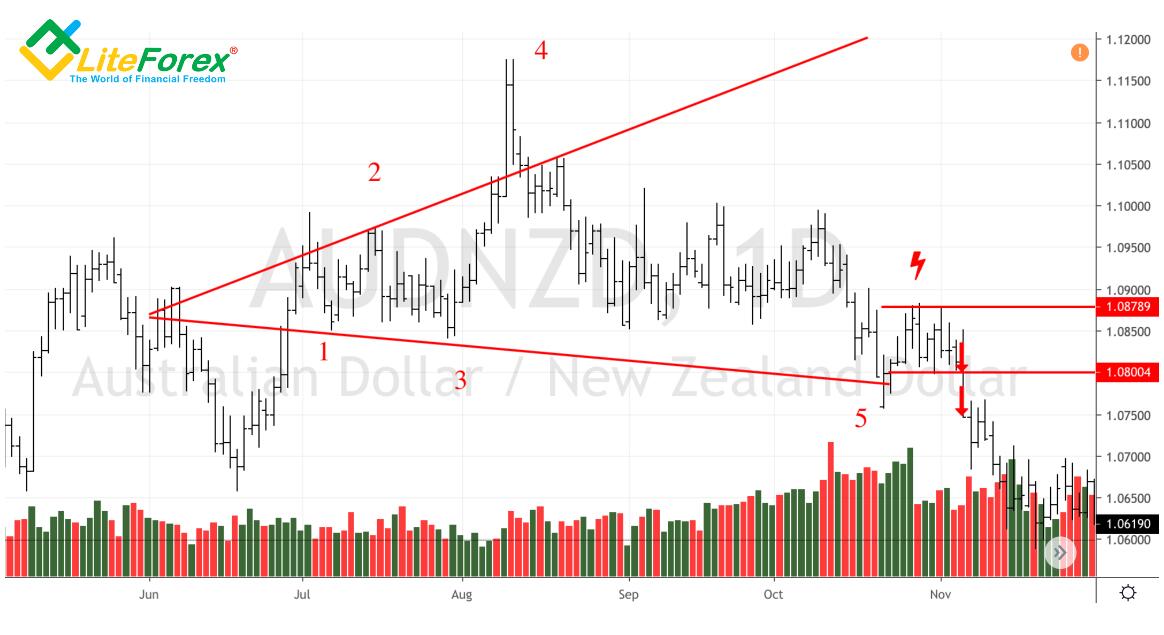
Conservative strategy involves entering a short position at the repeated support test at point 5. Aggressive trading is based on selling at the return to the previous price level. Simply put, if the quotes, after reaching 78.6% of the wave 4-5, returns to 61.8%, there is a signal for opening the short position. The main problem is connected with the strength of opponents. If the struggle between the lions ends quickly, then the coyote will soon be full. On the contrary, if the pair goes into consolidation, then the probability of loss-making trades increases. However, much depends on the stop loss order. It is usually located two levels above the entry point.
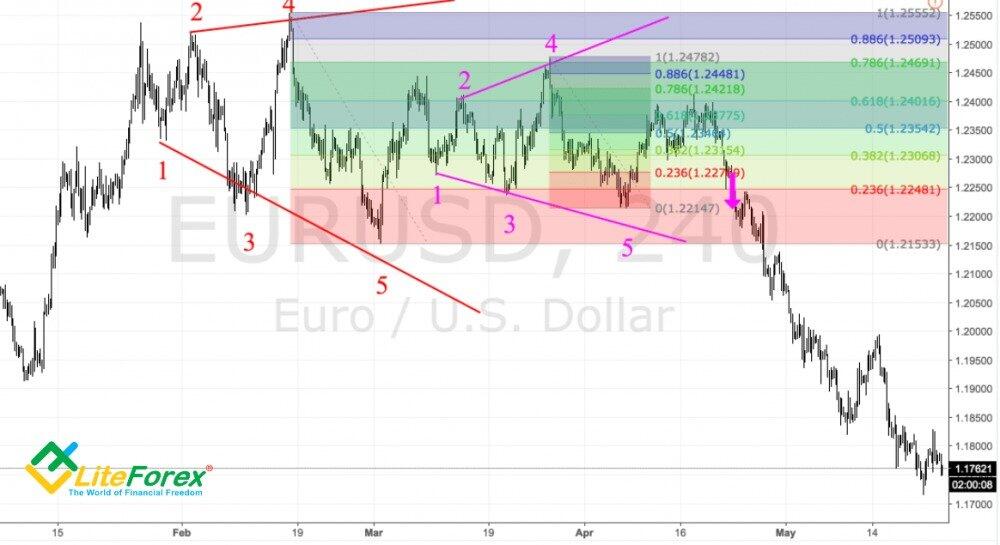
Sometimes a derived graphic configuration appears inside the Expanding Wedge pattern. I call it a pattern within a pattern. In my opinion, not only does it create additional entry points, but it also raises the effectiveness of the strategy.
The Expanding Wedge pattern is universal for different markets, instruments, and timeframes. In the following articles, we will discuss its formation on the basis of other graphic configurations.
Combination of Expanding Wedge and other patterns
Every day is a lesson. I’ve been improving my skills of applying Expanding Wedge for a long time, but it has never entered my head to combine it with other graphic patterns. Only after having read about the Diamond Bottom/Top pattern in Thomas Bulkowski’s best-selling Encyclopedia of Chart Patterns, I found what was missing in my trading system. From time to time, I had difficulties in identifying entry points. Fibonacci levels were quite efficient, but they sometimes seemed not to work to the full.
After a few years of using the Expanding wedge pattern, I stopped doubting in its efficiency. It was like clockwork. Its occurrence in the chart fitted perfectly the concept of a fight for initiative between bulls and bears, which finally led to consolidation. I only had to use coyote tactics: wait for the winners and side with them. To reach this objective, I implemented Fibonacci correction levels drawn on the chart within the wave 4-5.
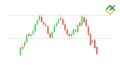
Expanding wedge pattern in the daily chart of AUD/NZD
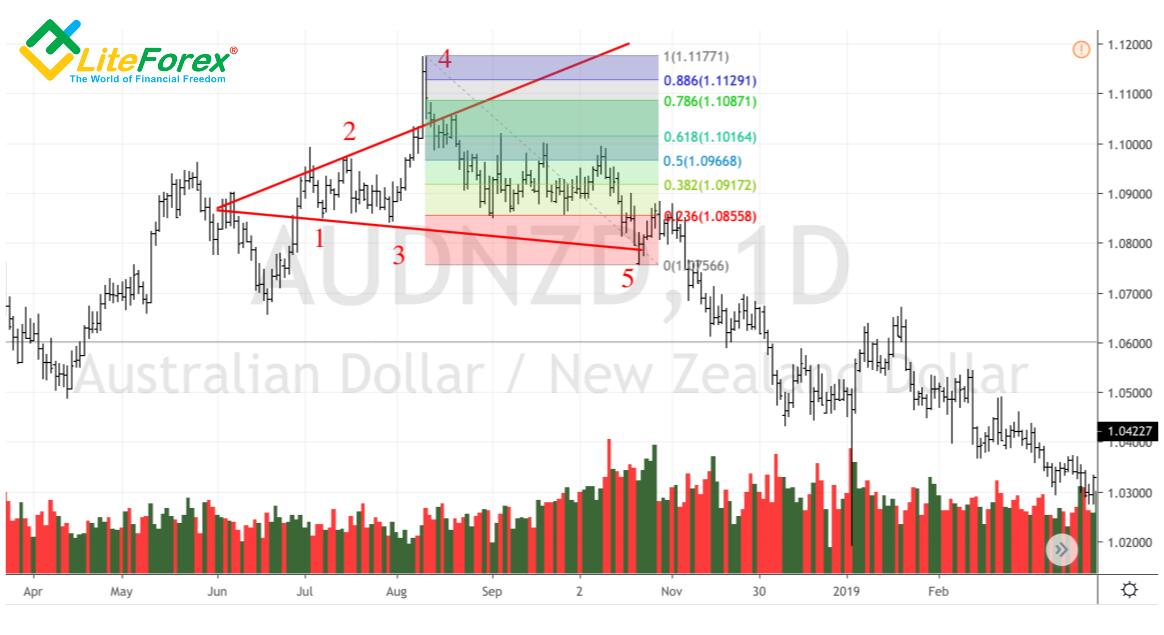
As a result, I got the idea of where the nearest resistance levels were. A retracement with a bar closing below an important level served to form short positions.
Strategy of work under the Expanding wedge pattern
The problem was that quotes could rise above 38.2%, 50% or even 61.8%. What’s more, I realised later that Expanding wedge isn’t necessarily a reversal pattern. Growth of a currency pair above 78.6% or 88.6% of wave 4-5 could be the reason for opening long positions. As an option, quotes would return to a previous price level (for example, a pair reached 38.2% and then fell to 23.6%), but such an option would sometimes leave me without profits.
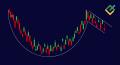
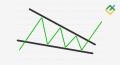
The acquaintance with Diamond chart patterns added a missing detail into my trading system. A convergent triangle appearing after an expanding trend is a serious hint that shows who will celebrate a victory - bulls or bears.
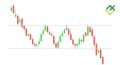
Diamond Bottom pattern on the AUD/NZD daily chart
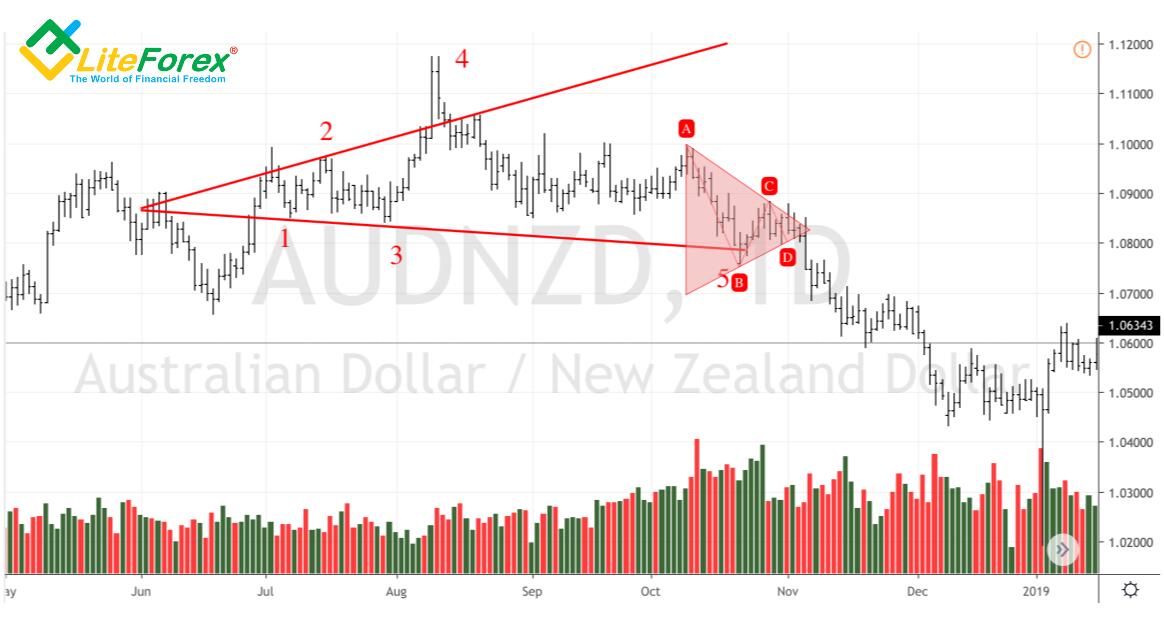
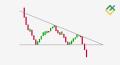
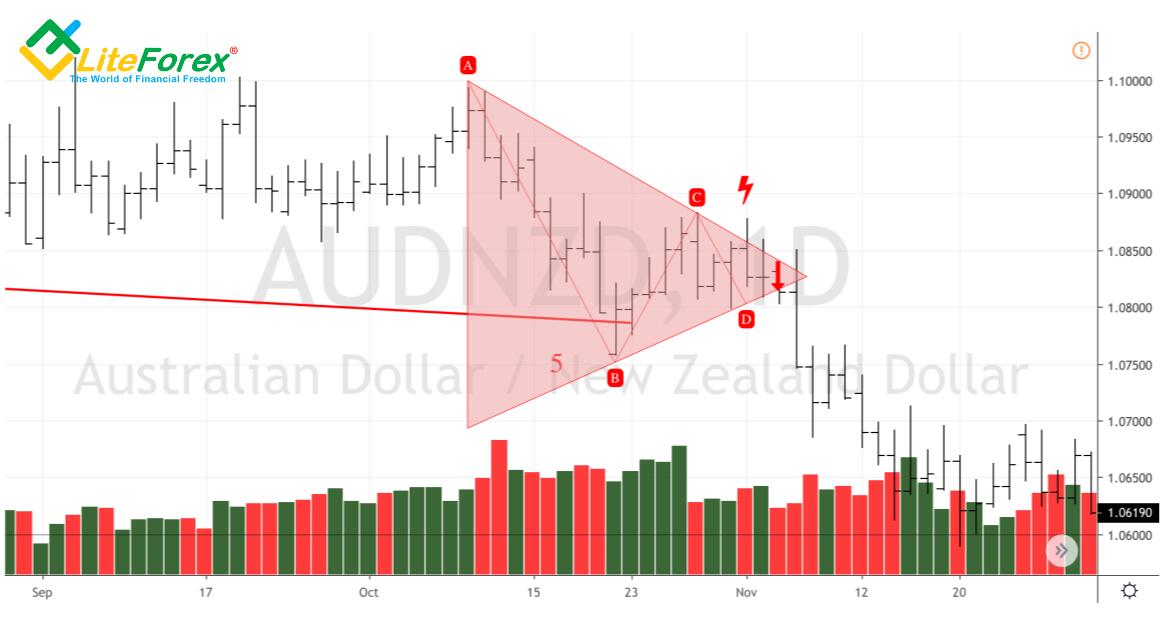
The price at which a bar-test of one of limits of the triangle closes is extremely important. Located above the upper diagonal line, it allows opening long positions; located below the lower diagonal line, it prompts to sell. One doesn’t have to think about quotes’ retracement to a previous target level or whether they will miss profits. Stop loss orders usually resolve those problems. They should be placed above the peak of a current price accumulation.
Strategy of work under Diamond Bottom pattern
The fewer doubts a trader has, the more efficient his/her trading system is. A strict compliance with the algorithm decreases stress and raises self-confidence. True, not all the trades are profitable, but if you believe in a pattern and in a trading system based on it, you will easily free yourself from many hang-ups peculiar to traders.
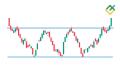
However, don’t forget that we never stop learning. Markets are changing, and trading efficiency is changing too. That’s why some robots which look attractive based on history don’t work efficiently as often as we would want them to. The acquaintance with the Diamond Bottom/Top pattern made me wonder: is the combination of an expanding wedge and convergent triangle really the most efficient? Does it probably make sense to consider the combination of the former with the pattern Splash and Shelf ? What do you think?
Strategy of work under Expanding wedge pattern and Splash and Shelf pattern.
P.S. Did you like my article? Share it in social networks: it will be the best "thank you" :)
Useful links:
- I recommend trying to trade with a reliable broker here. The system allows you to trade by yourself or copy successful traders from all across the globe.
- Use my promo code BLOG to get a 50% deposit bonus on the LiteFinance platform. Simply enter this code in the appropriate field when funding your trading account.
- Telegram chat for traders: https://t.me/litefinancebrokerchat. We are sharing the signals and trading experience.
- Telegram channel with high-quality analytics, Forex reviews, training articles, and other useful things for traders https://t.me/litefinance
Price chart of EURUSD in real time mode

The content of this article reflects the author’s opinion and does not necessarily reflect the official position of LiteFinance broker. The material published on this page is provided for informational purposes only and should not be considered as the provision of investment advice for the purposes of Directive 2014/65/EU.
According to copyright law, this article is considered intellectual property, which includes a prohibition on copying and distributing it without consent.