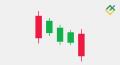
The Mat Hold pattern is a unique candlestick formation arising from regular price movements, showing the ongoing conflict between optimistic buyers and pessimistic sellers. This three-bar pattern vividly demonstrates the struggle for control between those looking to buy and sell, revealing the changing supply and demand dynamics. Unlike more common candlestick patterns, the Mat Hold's distinct shape accurately depicts the intense battle between bullish and bearish traders.
This detailed guide aims to delve into the psychology behind Mat Holds and the strategies necessary to utilize them effectively. You'll better understand how trends evolve and learn to identify these critical reversal signals within the charts. Whether you aim to increase profits or enhance your trading skills, the Mat Hold pattern offers valuable insights and lessons.
The article covers the following subjects:
Decoding the Distinct Mat Hold Structure
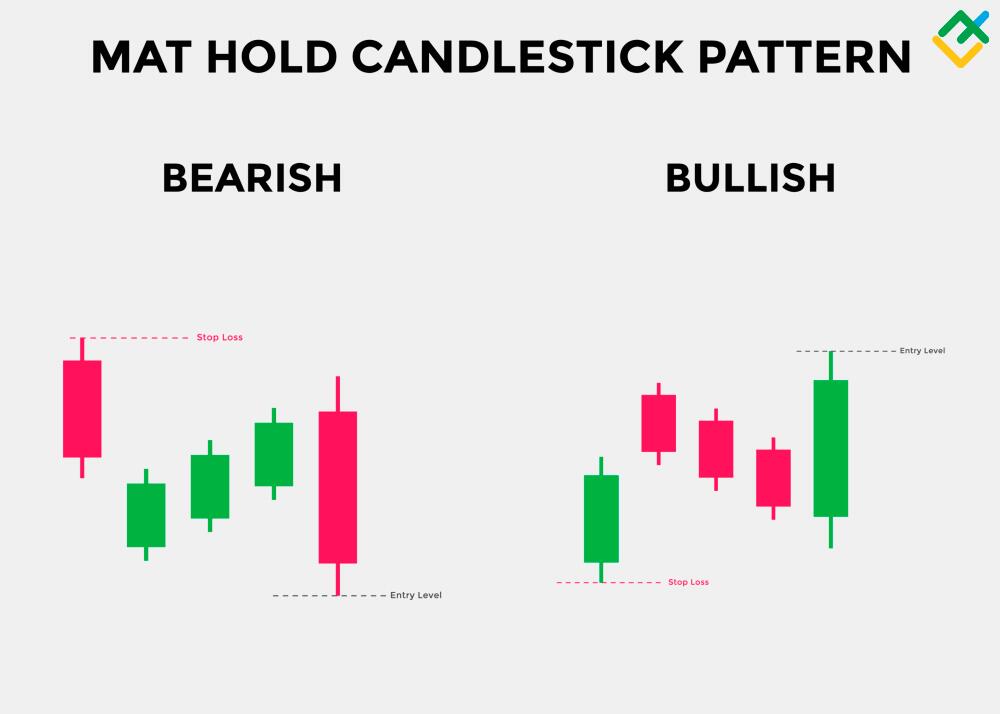
The Mat Hold pattern consists of five candlesticks and shows a battle between buyers (bulls) and sellers (bears) within an ongoing trend. It demonstrates how the buyers or the sellers manage to retake the charge after a temporary pullback, continuing the primary trend. This pattern comes in both bullish and bearish variations.
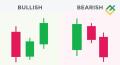
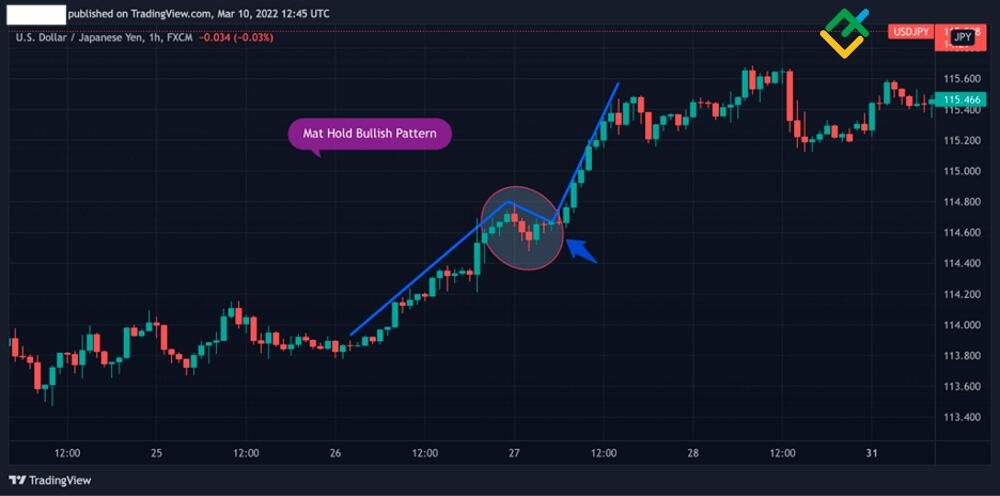
Mat Hold Bullish
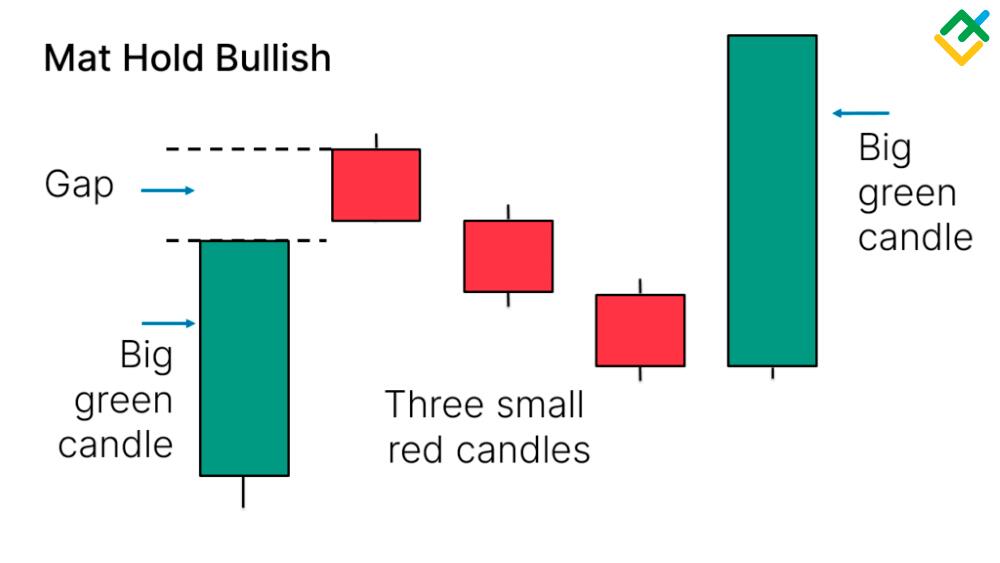
A bullish Mat Hold emerges within an uptrend, showing strong buying interest and reasserting dominance after a brief pullback.
The bearish version happens when prices fall, showing increased selling pressure and retaking the charge after a minor pullback.
The bullish Mat Hold pattern starts with a significant white or green candle, showing strong buying activity. Following this, three smaller black or red candles indicate a bearish attempt to pull back. Eventually, the pattern finishes with another substantial white or green bullish candle that covers the body of the third candle entirely. This shows that the bulls have regained control after the short-lived pullback.
Mat Hold Bearish
In contrast, a bearish Mat Hold generally develops within a downtrend, suggesting the selling pressure may be regaining dominance to spark a reversal.
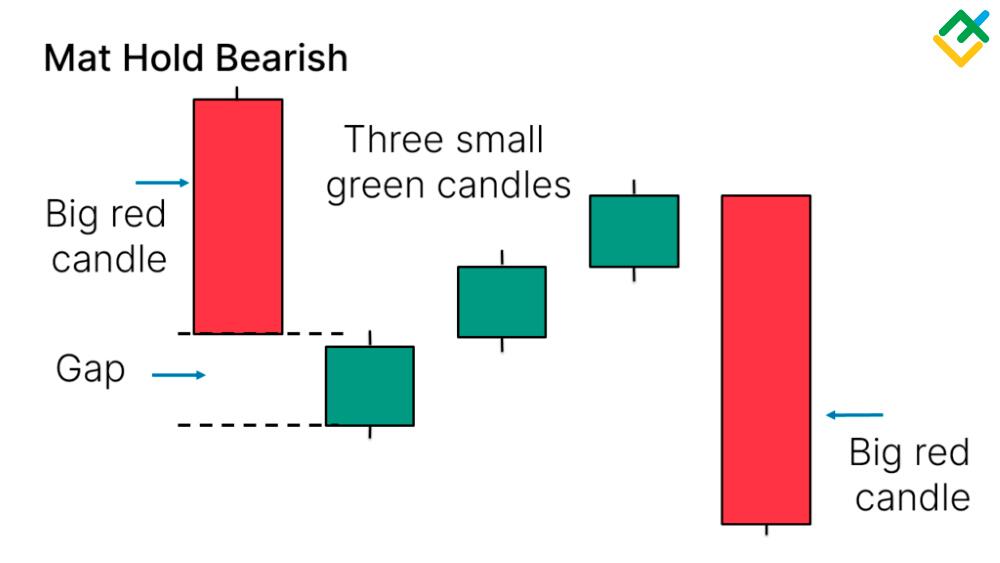
The bearish Mat Hold pattern starts with a long white candle extending the uptrend. The next three candles are black, showing the introduction of selling pressure. However, none of these black candles fully engulf the range of the first white candle, representing the persistent power of the bulls. The fifth and final candle is a long red candle that breaks the pattern low and closes near the lows, indicating the bears have overwhelmed the bulls.
Get access to a demo account on an easy-to-use Forex platform without registration
Identifying Valid Mat Hold Patterns
In order to capitalize on the powerful signals of the Mat Hold, traders must first be able to identify quality setups consistently. Thus, they need to be on the lookout for the following key characteristics:
Preceding Trend
A clear uptrend or downtrend should already be in place before forming a bullish or bearish Mat Hold. The more significant trend provides essential context.
Candle Sequence
In a bullish Mat Hold, the pattern begins with a tall white or green bullish candle, followed by three shorter black or red bearish candles, and completes when another long white or green bullish bar engulfs the body of the third candle in the series.
In contrast, the bearish Mat Hold starts with a long red or black bearish candle, followed by three smaller white or green bullish candles pulling back, finishing with one longer red or black bearish candle that breaks the pattern low and closes near the lows.
Both types involve a lengthy candle moving with the trend, followed by three candles going against the trend, ending with another long candle in the trend's direction. Understanding the differences between the bullish and bearish versions is crucial for correctly recognizing and trading Mat Hold patterns.
Candle Color
The long candle at the beginning and end of the pattern represents the dominant trend direction, whether bullish or bearish. The three candles in the middle act as a pullback against the more significant trend.
In a bullish Mat Hold:
The first and fifth candles are long white/green candles reflecting bullish control.
The three middle candles are typically small black/red pullback candles.
In a bearish Mat Hold:
The first and fifth candles are long red/black candles driven by bearish selling.
The three middle candles are usually minor white/green counter-trend corrections.
Watching the colors, as explained for the bullish or bearish version, visually shows the direction the market pressure is leaning toward in each candle. This sequence of five candles represents the struggle between buyers and sellers.
Size Differential
There should be a clear contrast in size between the most significant and smallest candles. The pattern tends to have less impact or strength if they appear similar in size.
Gap Between Bodies
In simple terms, many valid Mat Hold patterns show a noticeable gap between the candle bodies rather than just wick overlaps. This gap highlights the changing control between buyers (bulls) and sellers (bears).
Following these criteria will likely help you spot patterns more accurately, allowing you to identify the most impactful formations that might lead to significant market movements.
Mat Hold Pattern Example
While historical examples cannot guarantee future results, here are a couple of real-life instances where the Mat Hold Pattern formed and potentially signaled a trend reversal.
EUR/USD: In April 2018, the EUR/USD currency pair experienced a downtrend. During this period, a bullish Mat Hold formed consisting of a long white candle followed by three small black candles pulling back slightly into the long white range. This showed buying pressure resuming control, and as expected, the downtrend continued after the pattern with no reversal.
GBP/JPY: In November 2019, the GBP/JPY pair showed a strong uptrend. A bearish Mat Hold emerged amidst the uptrend consisting of a long green candle followed by three small red candles unable to break beneath the green range. This indicated the selling pressure was returning, with bears regaining dominance. As anticipated, the strong, established uptrend resumed after the pattern was completed, with no reversal occurring.
Remember, no pattern ensures a change in the trend. Traders must use additional technical analysis tools and indicators to verify potential reversals before making trading decisions.
Start trading with a trustworthy broker
Executing a Tactical Mat Hold Trading Strategy
The Mat Hold pattern consists of five candlesticks, indicating that the current trend will likely continue. Here, you'll find some usual trade entry methods, where to place stop-loss orders, and potential profit targets.
Entry Points:
A cautious strategy involves waiting for confirmation. You would enter the trade when the price surpasses the high of the Mat Hold Pattern. This step confirms the possible trend reversal and offers a more likely entry point.
Bolder Strategy: Jump into the trade once the Mat Hold Pattern shapes up. This method holds more risk since the reversal hasn't been confirmed yet, but it might provide an earlier entry point that could yield a more significant potential reward.
Stop-Loss Placement:
Place the stop-loss below the low of the fifth candle. This level acts as a support level, and if the price breaks below it, it suggests that the pattern is not valid, and the trend may continue in a different direction. By placing the stop-loss here, potential losses can be limited.
Profit Targets:
Fibonacci Extensions. Traders use Fibonacci extension levels as targets for taking profits. These levels are potential areas where the price might face resistance or find support. Traders often look for these key Fibonacci extension levels to decide when to partially or fully exit a trade as the price approaches them.
Previous swing highs or lows. If the price reverses and creates a Mat Hold Pattern following a downtrend, traders might aim for the last high swing as a profit goal. Conversely, the previous low swing could be a potential target if the pattern forms after an uptrend.
It's important to understand that no strategy can guarantee success in trading. Traders should employ risk management methods like sizing positions properly and using trailing stops to safeguard their investments. It's also recommended to blend the analysis of the Mat Hold Pattern with other technical indicators or chart patterns to improve the likelihood of profitable trades.
Pros and Cons of Using Mat Hold Pattern
Advantages of using the Mat Hold pattern in trading:
- Signal for trend continuation. The Mat Hold pattern indicates that the ongoing trend will likely persist. When accurately recognized, it confirms to traders that the trend they're observing remains unchanged and is likely to continue.
- Easily Understandable Entry and Exit Points. This pattern provides clear signals for when to enter and exit trades, simplifying the process for traders to identify and execute their trading decisions.
- The pattern's clear structure, featuring a tall candle succeeded by several smaller candles, offers a visually straightforward signal. This makes it simpler for traders to identify and understand.
Disadvantages of using the Mat Hold pattern in trading:
- False Signals. Not all signals from the Mat Hold pattern are accurate. Relying solely on this technical pattern for trading decisions can sometimes result in false signals, potentially leading to losses.
- Subjectivity. Understanding the pattern can sometimes involve subjectivity because traders might have varying criteria for recognizing and confirming the pattern.
- Lack of Precision. The Mat Hold pattern doesn't offer exact price levels for entry, stop-loss, and profit targets. To pinpoint these levels accurately, traders must rely on supplementary tools and analysis.
Conclusion
In conclusion, the Mat Hold pattern can be valuable in Forex trading when used with other technical analysis methods. It offers the potential to identify trend continuation early, providing traders with opportunities for profitable trades. However, it has limitations. False signals and subjectivity in interpretation are factors to consider, and traders should use proper risk management techniques and combine the pattern analysis with other indicators for confirmation. The Mat Hold pattern's clarity and distinct structure make it a useful addition to a trader's toolkit, but it should be more than just relied upon for trading decisions.
Platform where traders earn more

Trade on LiteFinance’s high-tech ECN platform and open an account so that beginner traders can copy you. Earn a commission for copy trading and boost your income.
Mat Hold Candlestick Pattern FAQs
The Mat Hold candlestick pattern is used in technical analysis to suggest the likely conclusion of a temporary pullback within the main trend. It involves a prolonged candle followed by several smaller ones showing decreasing highs and increasing lows, hinting at a potential change in market sentiment.
It is a relatively obscure candlestick pattern that suggests continuing an existing trend. However, the effectiveness and reliability of candlestick patterns, including the Mat Hold, can vary, and they are often used in conjunction with other technical analysis tools to make trading decisions. Traders should use it with other analysis tools and indicators for more accurate decision-making.
The Mat Hold pattern can be bullish and bearish, depending on the preceding trend. If it forms after a downtrend, it suggests a potential bearish reversal, while after an uptrend, it indicates a possible bullish reversal.
The Mat Hold pattern doesn't have a set duration. It usually spans several candlesticks or bars on the price chart, but there's no specific timeframe. To grasp its significance, traders must analyze the overall price action and prevailing market conditions.
After a Mat Hold pattern occurs, the subsequent price action can vary. The Mat Hold pattern itself suggests a continuation of the existing trend. In a bullish context, the uptrend is likely to continue. In a bearish context, it suggests that the downtrend is likely to persist. However, what happens next depends on various factors, including market conditions, the strength of the pattern, and other technical indicators. Traders should look for confirmation signals and monitor price action for further insights.
Even a Mat Hold pattern can sometimes fail and give misleading signals. Similar to most technical patterns, it could be more foolproof and guaranteed. To manage risks effectively, traders should employ proper risk management strategies, merge them with additional analytical tools, and factor in the broader market conditions to reduce the chances of relying on inaccurate signals.

The content of this article reflects the author’s opinion and does not necessarily reflect the official position of LiteFinance broker. The material published on this page is provided for informational purposes only and should not be considered as the provision of investment advice for the purposes of Directive 2014/65/EU.
According to copyright law, this article is considered intellectual property, which includes a prohibition on copying and distributing it without consent.