How do you identify the market strength? How to tell if the market is strong or weak?
Volume Spread Analysis: Volume, Accumulation, Distribution, Strong and Weak Holders, Buying Climax and Selling Climax
Dear friends!
With this post, I’ll start writing about an interesting method of market analysis based on the trading volume, Volume Spread Analysis (VSA), developed by a famous financial analyst Tom Williams. This is a non-standard approach that deals with how market-makers manipulate crowd behavior.
I do not want to just retell the book, so, in this series of articles, I will focus on the practical application of the method with a traditional reference to cryptocurrency trading.
In the first lesson, I will deal with the theoretical principles of market formation and how traders with big capitals affect market sentiment. I will define the major concepts that I will use during the whole course. So, you should study this article if you are interested in the VSA and want to better understand the actions of big traders.
In the end, I will give an example of one of the basic principles of market reading that allows one to identify the market strength.
Well, let’s get down to business!
What is trading volume?
Even if you are just starting your trading carer, you have probably come across the following phrase: “The market goes up when demand prevails over supply. And, conversely, the market goes down when supply exceeds demand. ” Let us study the principles suggested by this phrase to understand what trading volume means.
For those readers who have not come across a similar term, I should explain that, in trading, is the number of lots traded in the market within a specified period. First of all, it must be understood that the volume taken in isolation doesn’t provide much information. However, if you compare the current volume with that of the previous day, a week or a month ago, you will clearly see the changes in the trading activity.
To understand market processes better, let us compare a change in the volume with the price spread. This will demonstrate the sentiment of big traders: bullish or bearish. Remember, the spread is the difference between the price high and low over a particular period.
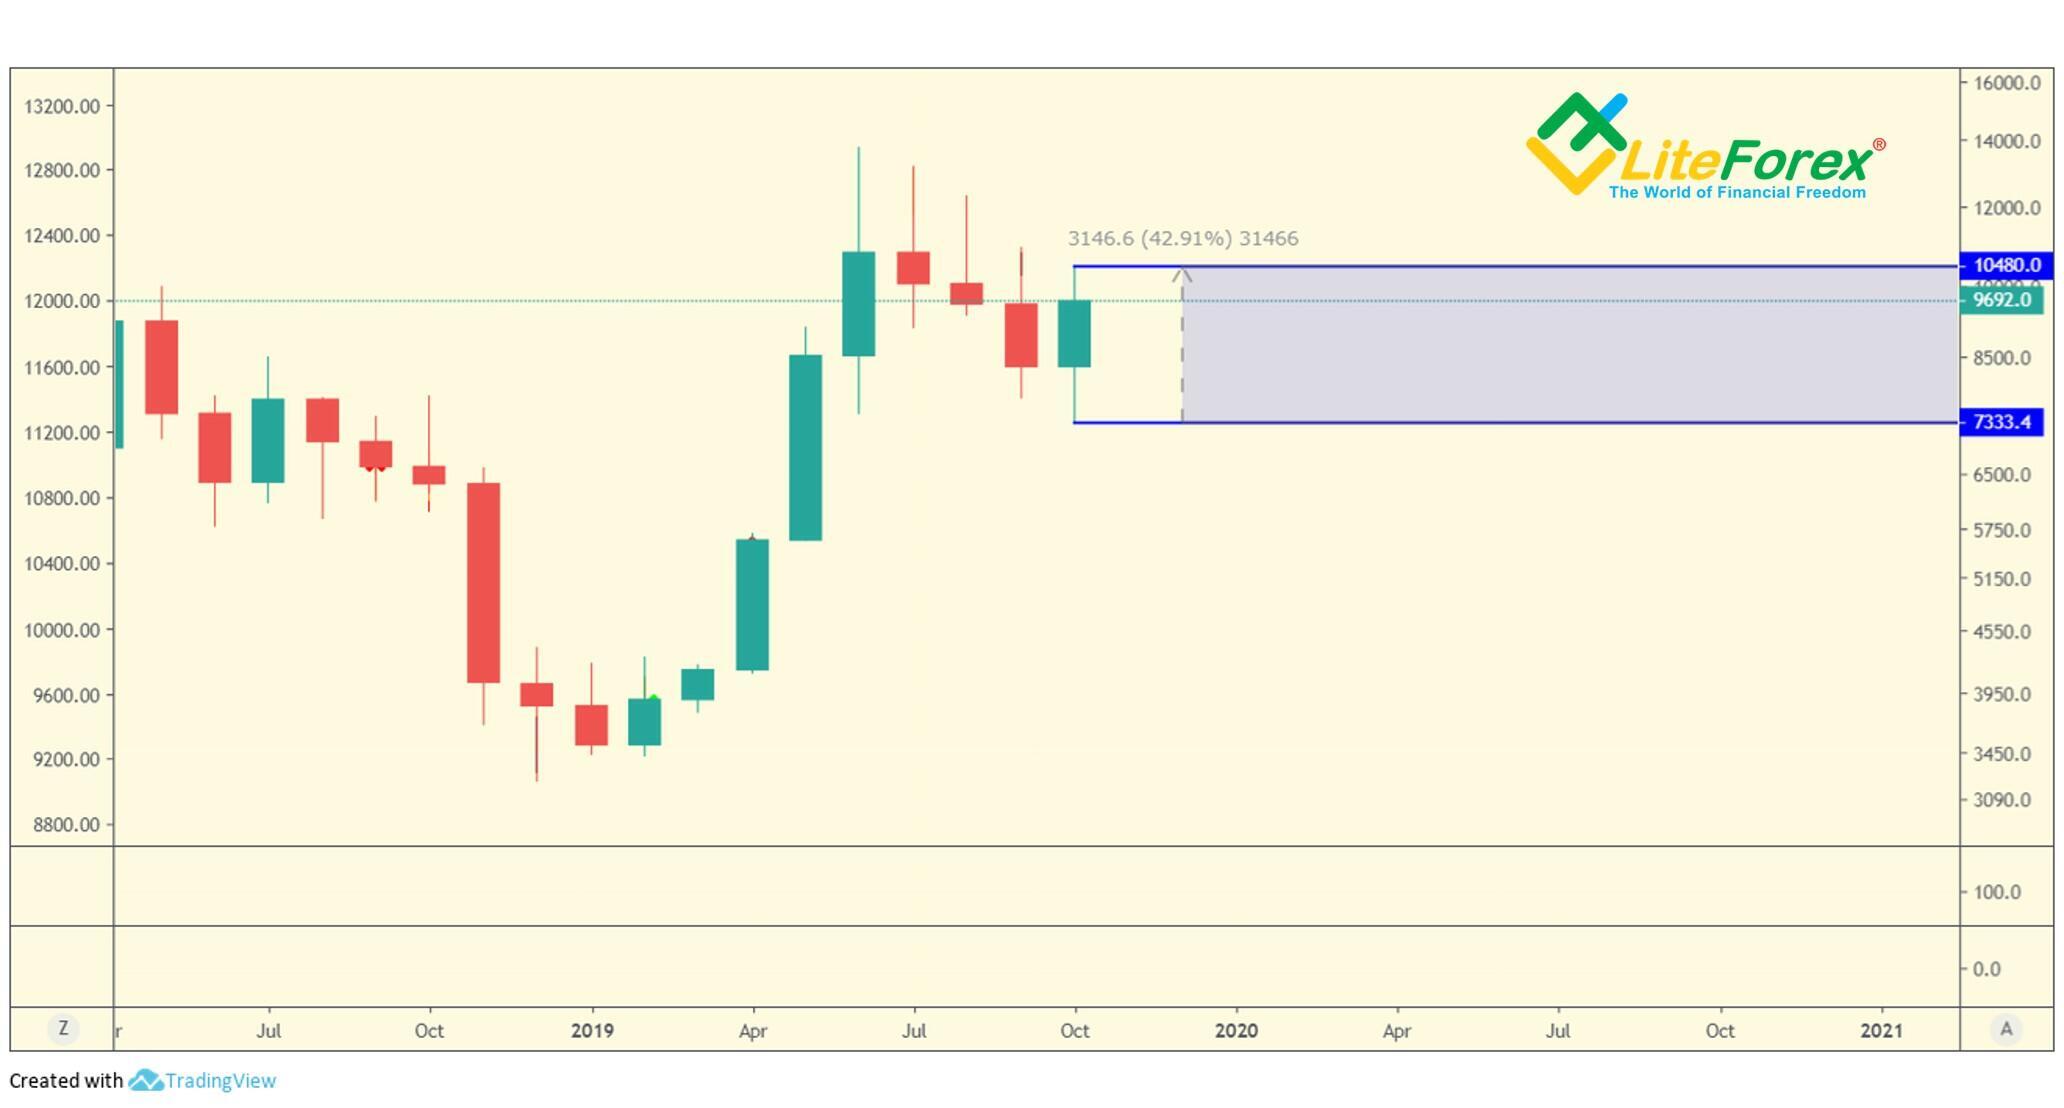
To demonstrate this, I highlighted the BTCUSD price spread in October with blue.
In practice, the price movements do not always correspond to the current market activity. There are often cases when, following a little increase in the volume, the price sharply surges, confusing many traders. But you know the concept of inertia, everything becomes clear. In this situation, the market can be compared to a car that driving at a high speed will go uphill for some time even if the driver has put his foot off the accelerator.
What is Volume Spread Analysis?
The Volume Spread Analysis method provides a complex approach to the market analysis, defining the relations between the price, spread, and volume. Volume always indicates the amount of activity going on, the corresponding price spread shows the price movement on that volume.
We define the relationship between these two parameters to find out the supply and demand ratio that often results from the trades entered by big operators, which is thought to be the main cause of the market moves in a particular direction among traders. Thus we can establish the cause of price movements, and from the cause, predict the future direction of prices.
Principles of price moves in the financial market
Volume, like the market trend, can be bullish or bearish. Bullish volume is increasing volume on up-moves and decreasing volume on down-moves. Bearish volume is increasing volume on down-moves and decreasing volume on up-moves.
Next, I will introduce the concepts of accumulation and distribution.
Accumulation means buying as much of the stock as possible, without significantly putting the price up against your own buying, until there are few, or no more shares available at the price level you have been buying at. This buying usually happens after a bear move has taken place in the stock market and there are the best prices to buy.
Once most of the stock has been removed from the hands of other traders (ordinary private individuals), there will be little, or no stock left to sell into a mark-up in price. That is, the resistance to the bullish movement has been removed. So, in this situation, we can expect a steady price rise until the syndicate traders see the price high enough to sell the assets they have just bought.
Distribution is selling the assets, which ideally should be accomplished without putting the price down against the market-maker’ selling. This operation is performed to take the profits from selling at the potential top of a bull market. Besides, most of these big traders will place large orders to sell, not at the current price available, but at a specified price range.
If the selling is so great that prices are forced down, the selling will stop and the price will be supported, which gives the market-maker, and other traders, the chance to sell more of the asset on the next wave up. Once the professionals have sold most of their holdings, a bear market starts because markets tend to fall without professional support.
Now, you see that the big holders see both sides of the market at the same time, which gives them a great advantage over ordinary traders. For you to understand the market better, let study such the concepts of strong and weak holders.
Strong holders are professionals trading on the right side of the market. Their capital base is usually large, and they can normally read the market with a high degree of competence. Despite their proficiency, strong holders will still take losses frequently, but the losses will be minimal because they have learnt to close out losing trades quickly. A succession of small losses is treated as a business expense
Weak holders are usually traders new to the market. These people are usually under-capitalized and cannot readily cope with losses, especially if most of their capital is rapidly disappearing, which will undoubtedly result in emotional decision-making.
If we combine these concepts with the ones described above, we can sum up that: A Bull Market occurs when there has been a substantial transfer of stock from Weak Holders to Strong Holders, generally, at a loss to Weak Holders. A Bear Market occurs when there has been a substantial transfer of stock from Strong Holders to Weak Holders, generally at a profit to the Strong Holders.
When the market moves from one major trending state to another, there will occur an event called the Buying Climax or the Selling. Briefly defined, it is an imbalance of supply and demand causing a bull market to transform into a bear market, or vice versa.
The Buying Climax occurs when there is a huge demand for buying an asset, and syndicate traders and market-makers start dumping their holdings, to such an extent that higher prices are now impossible. Besides, at the bullish bar, the volume is seen to be exceptionally high, accompanied by a new high and a wide spread. At the end of the buying climax, the market will close in the middle or high of the bar.
The Selling Climax, as you see from the name, is the exact opposite of a buying climax and occurs when there is a huge amount of selling. It features the extremely high volume on down-moves, accompanied by wide spreads, with the price entering the fresh low ground. In the last phase of the selling climax, the price will close in the middle or low of the bar.
Causes of price reversals
Two major reasons result in the reversals of long-term market trends:
1. The majority of traders panic after observing substantial falls in a market (usually on bad news) and will usually follow their instinct to sell. Professional operators, in their turn, think differently, asking a question, “Are the trading syndicates and market-makers prepared to absorb the panic selling at these price levels?” If they are, then this is a good sign that indicates market strength.
2. After substantial rises, the majority will become annoyed at missing the up-move and will rush in and buy, usually on good news. This includes traders who already have long positions, and want more. At this stage, professionals ask themselves, “Are the trading syndicates selling into the buying?” If so, then the massive selling is a severe sign of weakness.
The basics of market reading
First of all, you need to understand that all markets move in the so-called ‘phases’. Observing the changes in volumes and the price spreads we can see the market building a cause for the next phase. The longer phases give rise to large moves, and the shorter phases result in smaller moves. Besides, we will group the spreads into abnormally wide, narrow, or just average in the analysis.
How to define if a market is weak or strong
Buy and sell orders from traders around the world are generally processed and matched up by market makers. It is their job to create a market. To create a market they must have large blocks of stocks to trade with. If they do not have sufficient quantities on their books to trade at the current price level, they can move the price to a more suitable level.
There are often situations when, following a bull-move, you place a buy order into a rising market, you may receive what appears to be a good price from the floor of the exchange. Why are you receiving a good price? Have these hard-nosed professionals decided that they like you and have decided to be generous giving away some of their profits to you? The reason is different. Market-makers’ perceived value of the market or asset may be lower than yours because they have already received enough sell orders and want to get rid of them quickly, expecting prices to fall or at best go sideways.
Such action, repeated many times with every other buyer, will tend to keep the spread of the day narrow, by limiting the upper end of the price spread. If, on the other hand, the market-makers have a bullish view, they will mark-up the price on your buy order, giving you what appears to be a poor price. This, repeated, makes the spread wider as the price is constantly marked up during the day.
So by simple observation of the spread of the bar, we can learn the opinion of those who can see both sides of the market.
Another example is when you find the market gaps or price gaps. This term in technical analysis refers to a situation when there is a gap between the closing price of the prior bar and the opening price of the next bar. For example, the market gaps up when the market-makers to stuck as many traders as possible into a potentially weak market and into losing trades and to create additional tension. As a rule, weak gap-ups are always in the zones of new highs, when the news is good and the bull market looks as though it will last forever.
I must note that there can be similar types of gapping-up action in strong markets too, but in this second case, you will have an extending trading flat area. Traders who have become trapped within the channel (sometimes referred to as a ‘trading range’), want only one thing, to exit the trade at a similar price to the one they first entered the trade. They are either buying at the top and hoping for a rise or buying at the bottom and not seeing any significant upwards price action will become demoralized at the lack of profit.
Professional traders that are still bullish know this. To encourage these old locked-in traders not to sell, professional traders, to support good prices to sell their own assets will mark-up, or gap up the market.
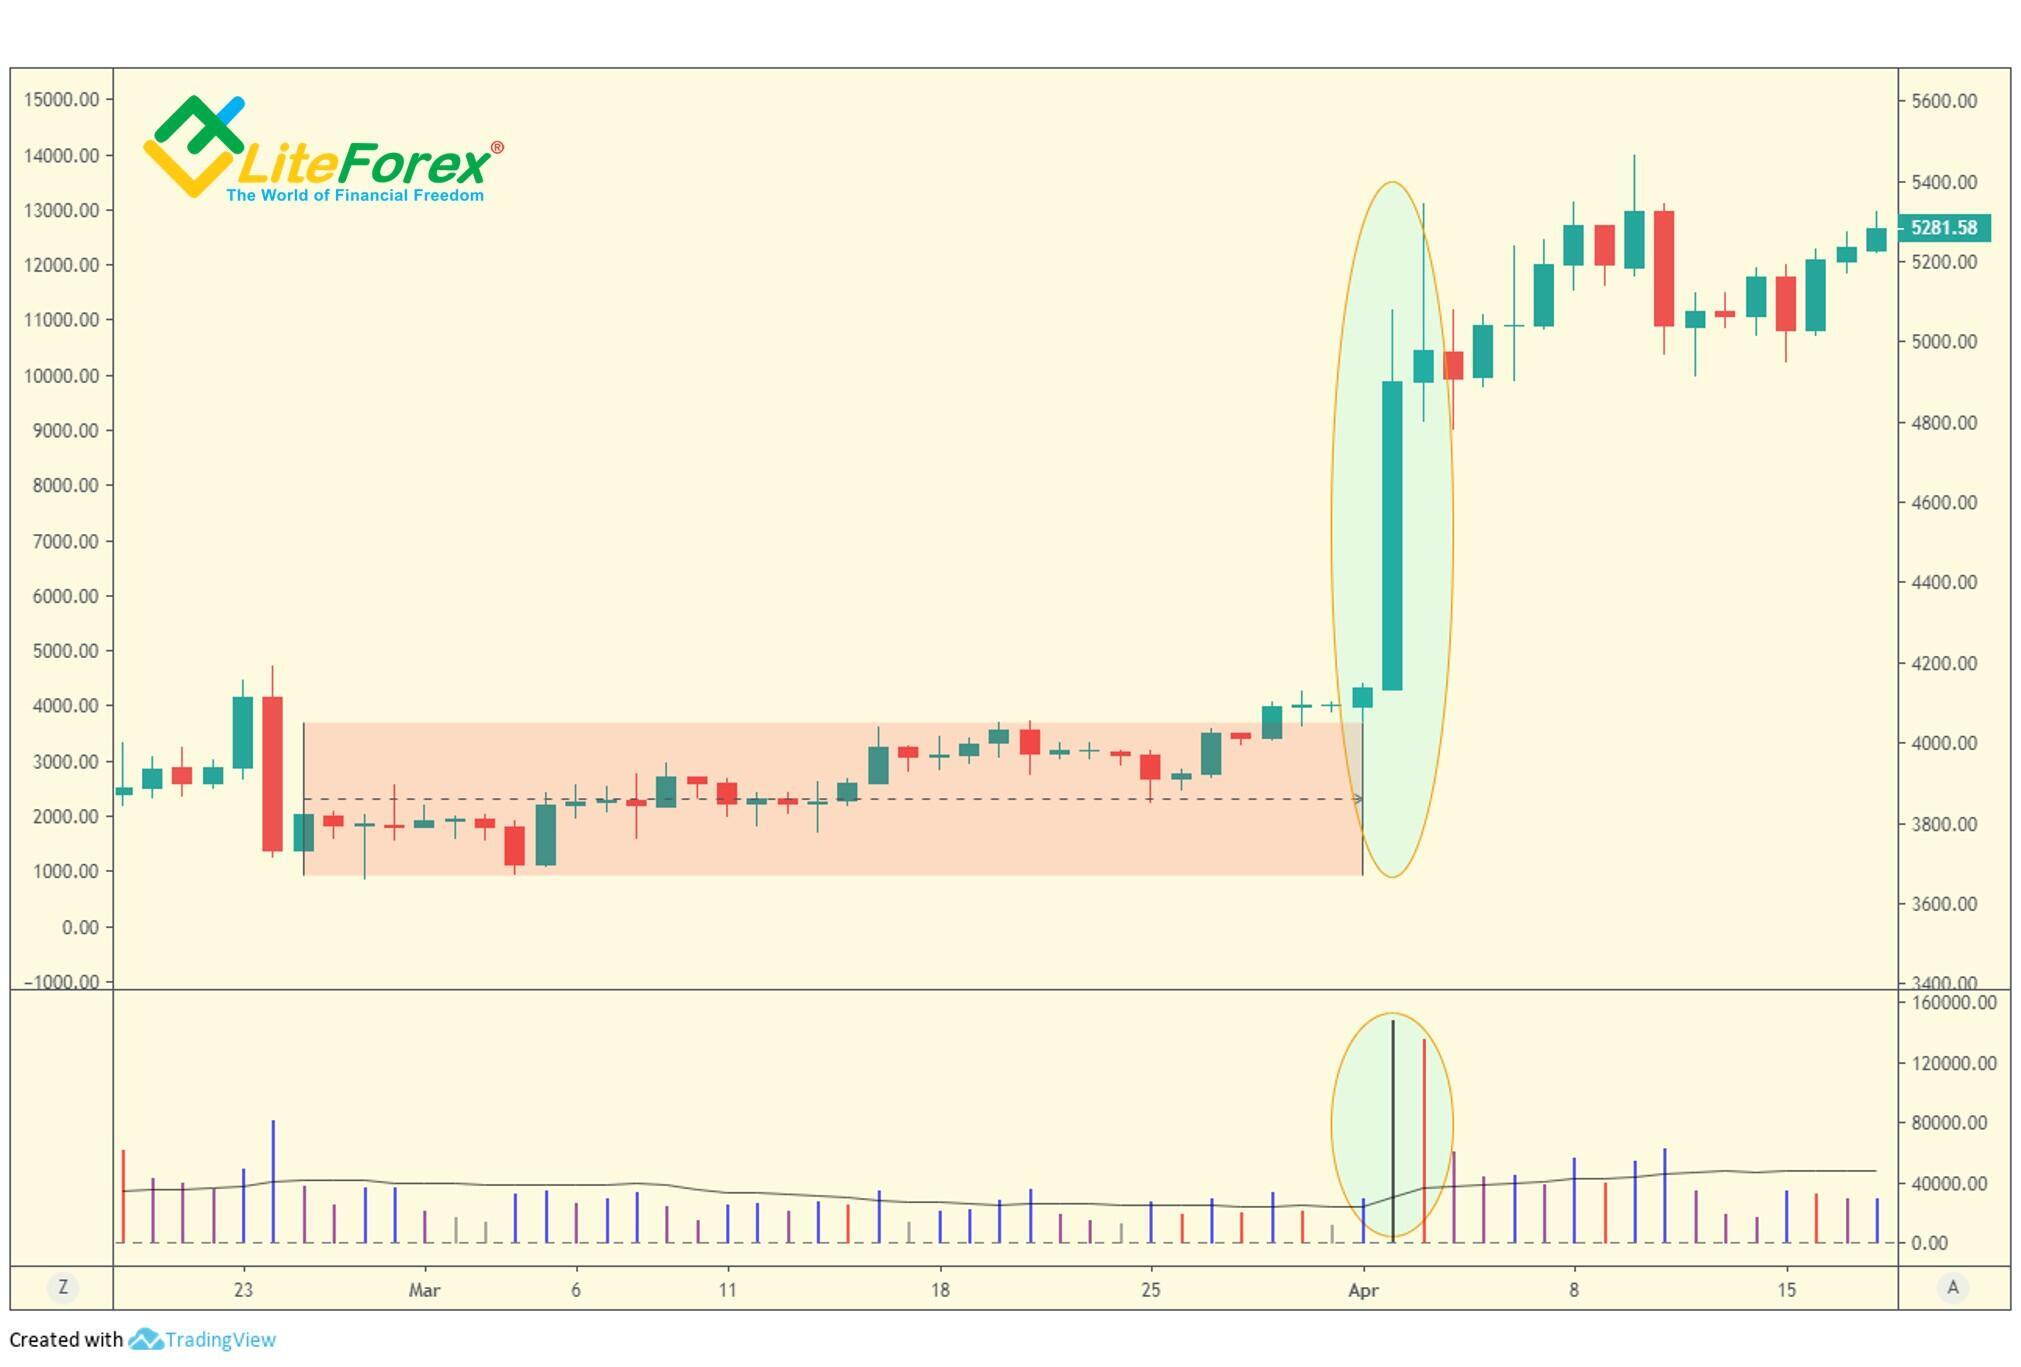
Let us see the situation with a sudden price rise resulted from the actions of professional traders, whose view of the market at that moment is bullish on the example of the daily BTCUSD price chart. The zone of locked-in trades is highlighted with red. Next, there is a green zone that marks a gap-up performed by professional traders who were bullish at that time. Besides, the volume has increased, substantially backing up the moveю This suggests that this is not a trap up-move, because the volume is supporting the move and market-makers really see the market strong.
Wide spreads in most cases up are designed to lock the majority of traders out of the market rather than attempting to suck them in. This will tend to put them off buying, as it goes against human nature to buy something today that they could have bought cheaper yesterday. This also panics those traders that shorted the market on the last low, usually encouraged by the timely release of bad news, which always seems to appear on, or near, the lows
Therefore, we can make an obvious conclusion. The volume that shows a substantial and healthy increase is bullish volume. However. Excessive volume is never a good sign; this indicates that the supply can swamp the demand. Low volume warns you of a trap up-move. If the price is marked up and the volume is low, this means a lack of demand in the market, and so, professionals see the market weak, refusing to take part in a bullish move. A sideways trend before the price up-move on a low volume is also indicative in this situation.
You should also note low volume on the down bars. This signals the bullish trend of strength and higher prices to come.
For a bearish move, the indications are the opposite. A bearish trend is strong when down-bars feature high volume. The excessive volume, however, warns that the price drop may not be natural and the demand can swamp the supply.
If the volume is declining on bearish bars, the selling pressure is also shrinking, which means the professionals are not interested in the further price fall. The market may be declining for some more time by inertia, but, soon, the price may surge due to insufficient supply.
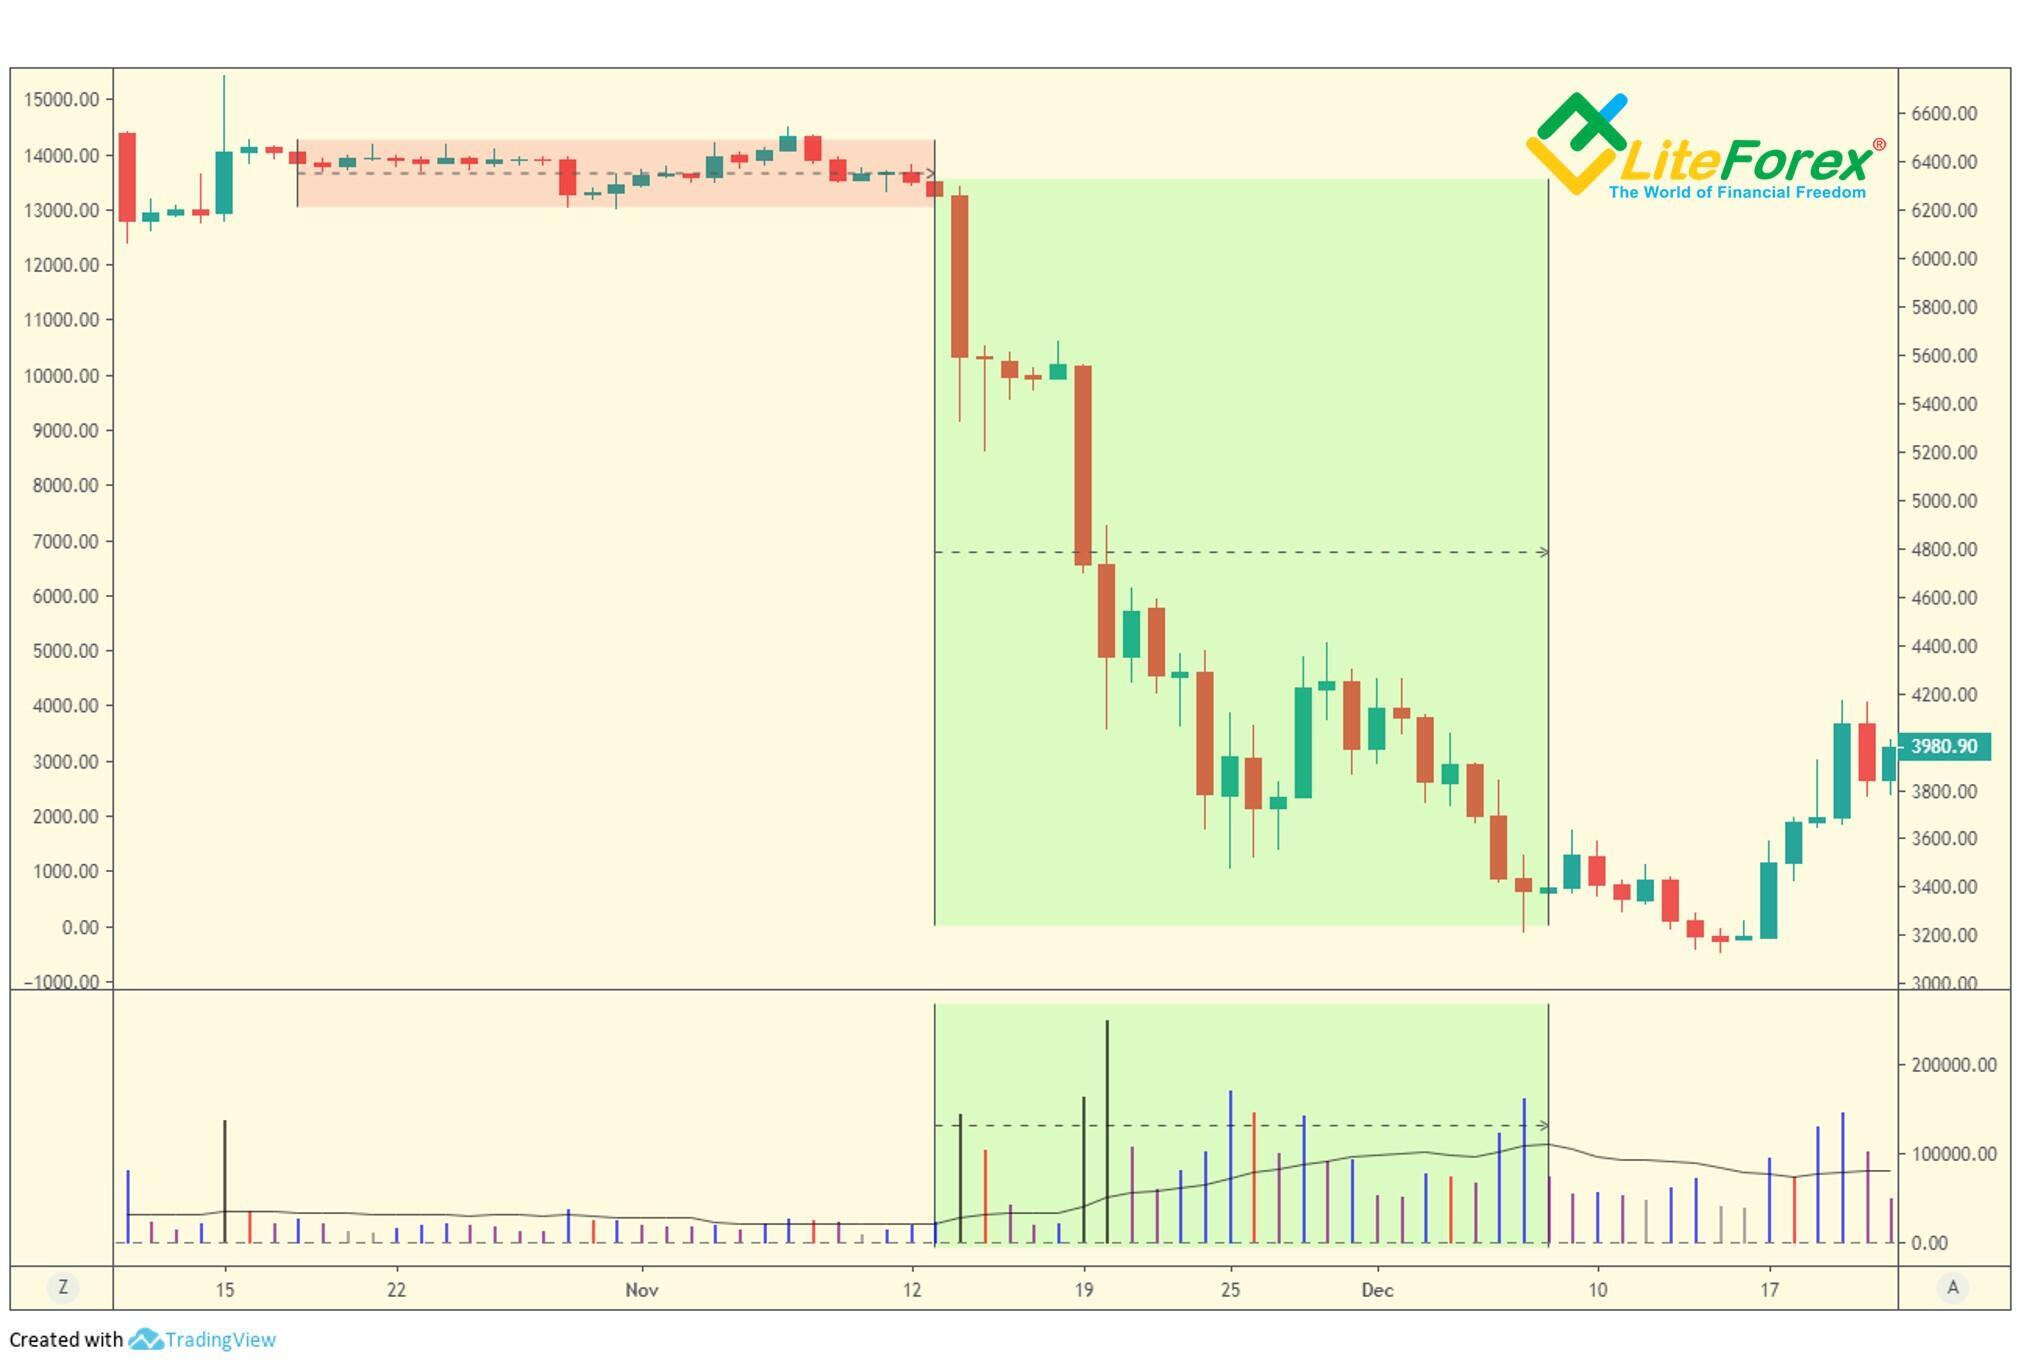
The red zone marks locked-in traders in the chart (sideways trend). Next, there is s sudden price drop with increased volume (the beginning of the green zone). Besides, the volume is quite high over the entire green zone, which indicates that big traders are interested in the bearish trend. The volume is declining directly to the right of the green zone. However, the bitcoin price continues sliding down for some time by inertia, which suggests the weakness of the downtrend.
That is all so far.
In my next training post that is soon to come, I will describe more smart methods to read the market. Subscribe to the trader blog and be on top of crypto trading!
I wish you good luck and good profits!
P.S. Did you like my article? Share it in social networks: it will be the best "thank you" :)
Useful links:
- I recommend trying to trade with a reliable broker here. The system allows you to trade by yourself or copy successful traders from all across the globe.
- Use my promo code BLOG to get a 50% deposit bonus on the LiteFinance platform. Simply enter this code in the appropriate field when funding your trading account.
- Telegram chat for traders: https://t.me/litefinancebrokerchat. We are sharing the signals and trading experience.
- Telegram channel with high-quality analytics, Forex reviews, training articles, and other useful things for traders https://t.me/litefinance

Price chart of BTCUSD in real time mode
The content of this article reflects the author’s opinion and does not necessarily reflect the official position of LiteFinance broker. The material published on this page is provided for informational purposes only and should not be considered as the provision of investment advice for the purposes of Directive 2014/65/EU.
According to copyright law, this article is considered intellectual property, which includes a prohibition on copying and distributing it without consent.