Anatomy of a bear market and recommendations on trading with the VSA
Dear friends!
Today, I will continue explaining the principles of making markets within the VSA model and technical analysis.
Remember, in the previous articles:
- Masters of the market. (Part 1 here), I described the basics of how the market operates in general, the influence made by market-makers on the price movements, and how to tell whether the market is strong or weak.
- In the next article, The basics of market reading. (Masters of the market. Part 2), I explained the basics of the market reading, identifying a lack of demand, testing supply, pushing up through supply, and many others.
- Trends and Volume Spread Analysis (Masters of the market. Part 3) explains in detail the methods of constructing trend lines and using channels in the VSA.
- Trend clusters and the anatomy of the market (Masters of the market. Part 4). This article deals with the properties of old trend lines and the anatomy of a bull market.
Now, let us study a bear market.
Forex VSA analysis. Features of a bear market.
First of all, I will describe some peculiar features of a bear market:
- During a bear market, the price won’t be gradually falling all the time, most markets will hesitate in their down-moves and go sideways, or even start going up.
- Any low volume up-move is an indication of weakness.
- There may also at times appear a test, up-move with a moderate increase in volume
A successful test is normally seen as a sign of strength, as a bear trend is about to end. However, if, following a short price rise, it is going sideways or even falling off slightly, this now shows further weakness to come, as the test is unsuccessful. You can learn more tests in this lesson How to read the market. (Masters of the market. Part 2).
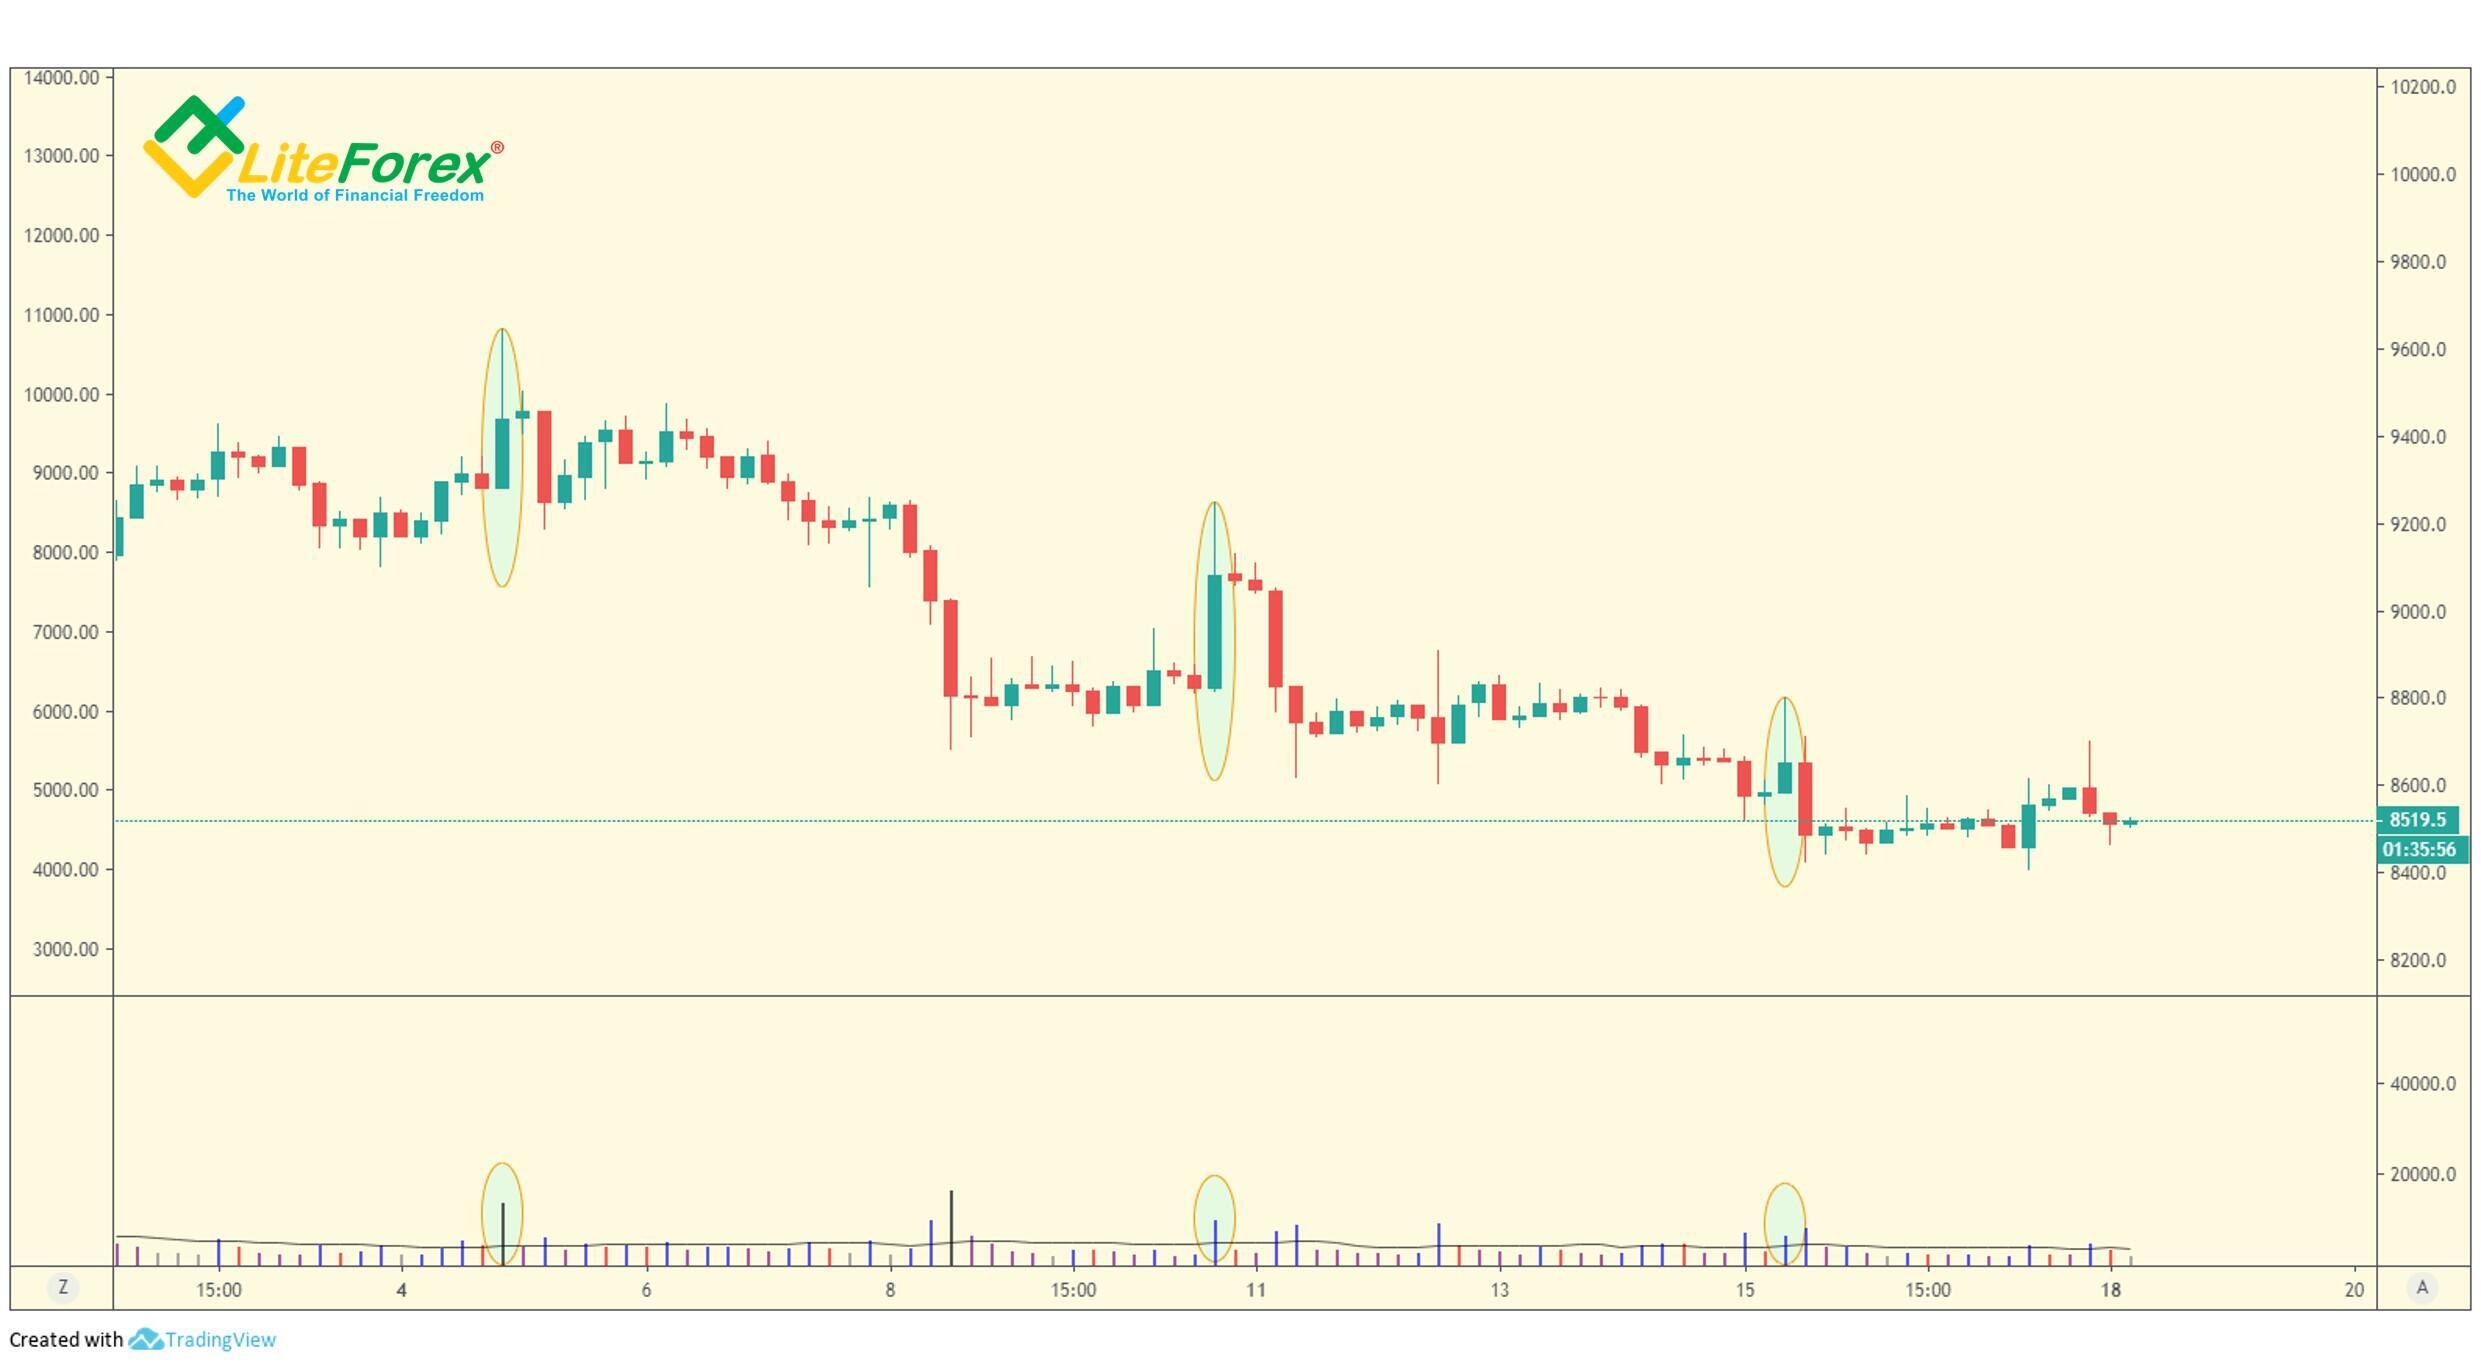
There is a bear movement on the four-hour BTCUSD chart. As I wrote above, the price is not falling regularly, there are up-moves, but the general trend is down. The zones of failed tests are marked with ovals. I want to note, that the up-bars mostly close not far from their lows, which indicates a great amount of selling that creates a resistance to the up-move. Estimating the volume of selling, professionals follow the path of the least resistance, pressing the price down until most trades think it is low enough to open long positions.
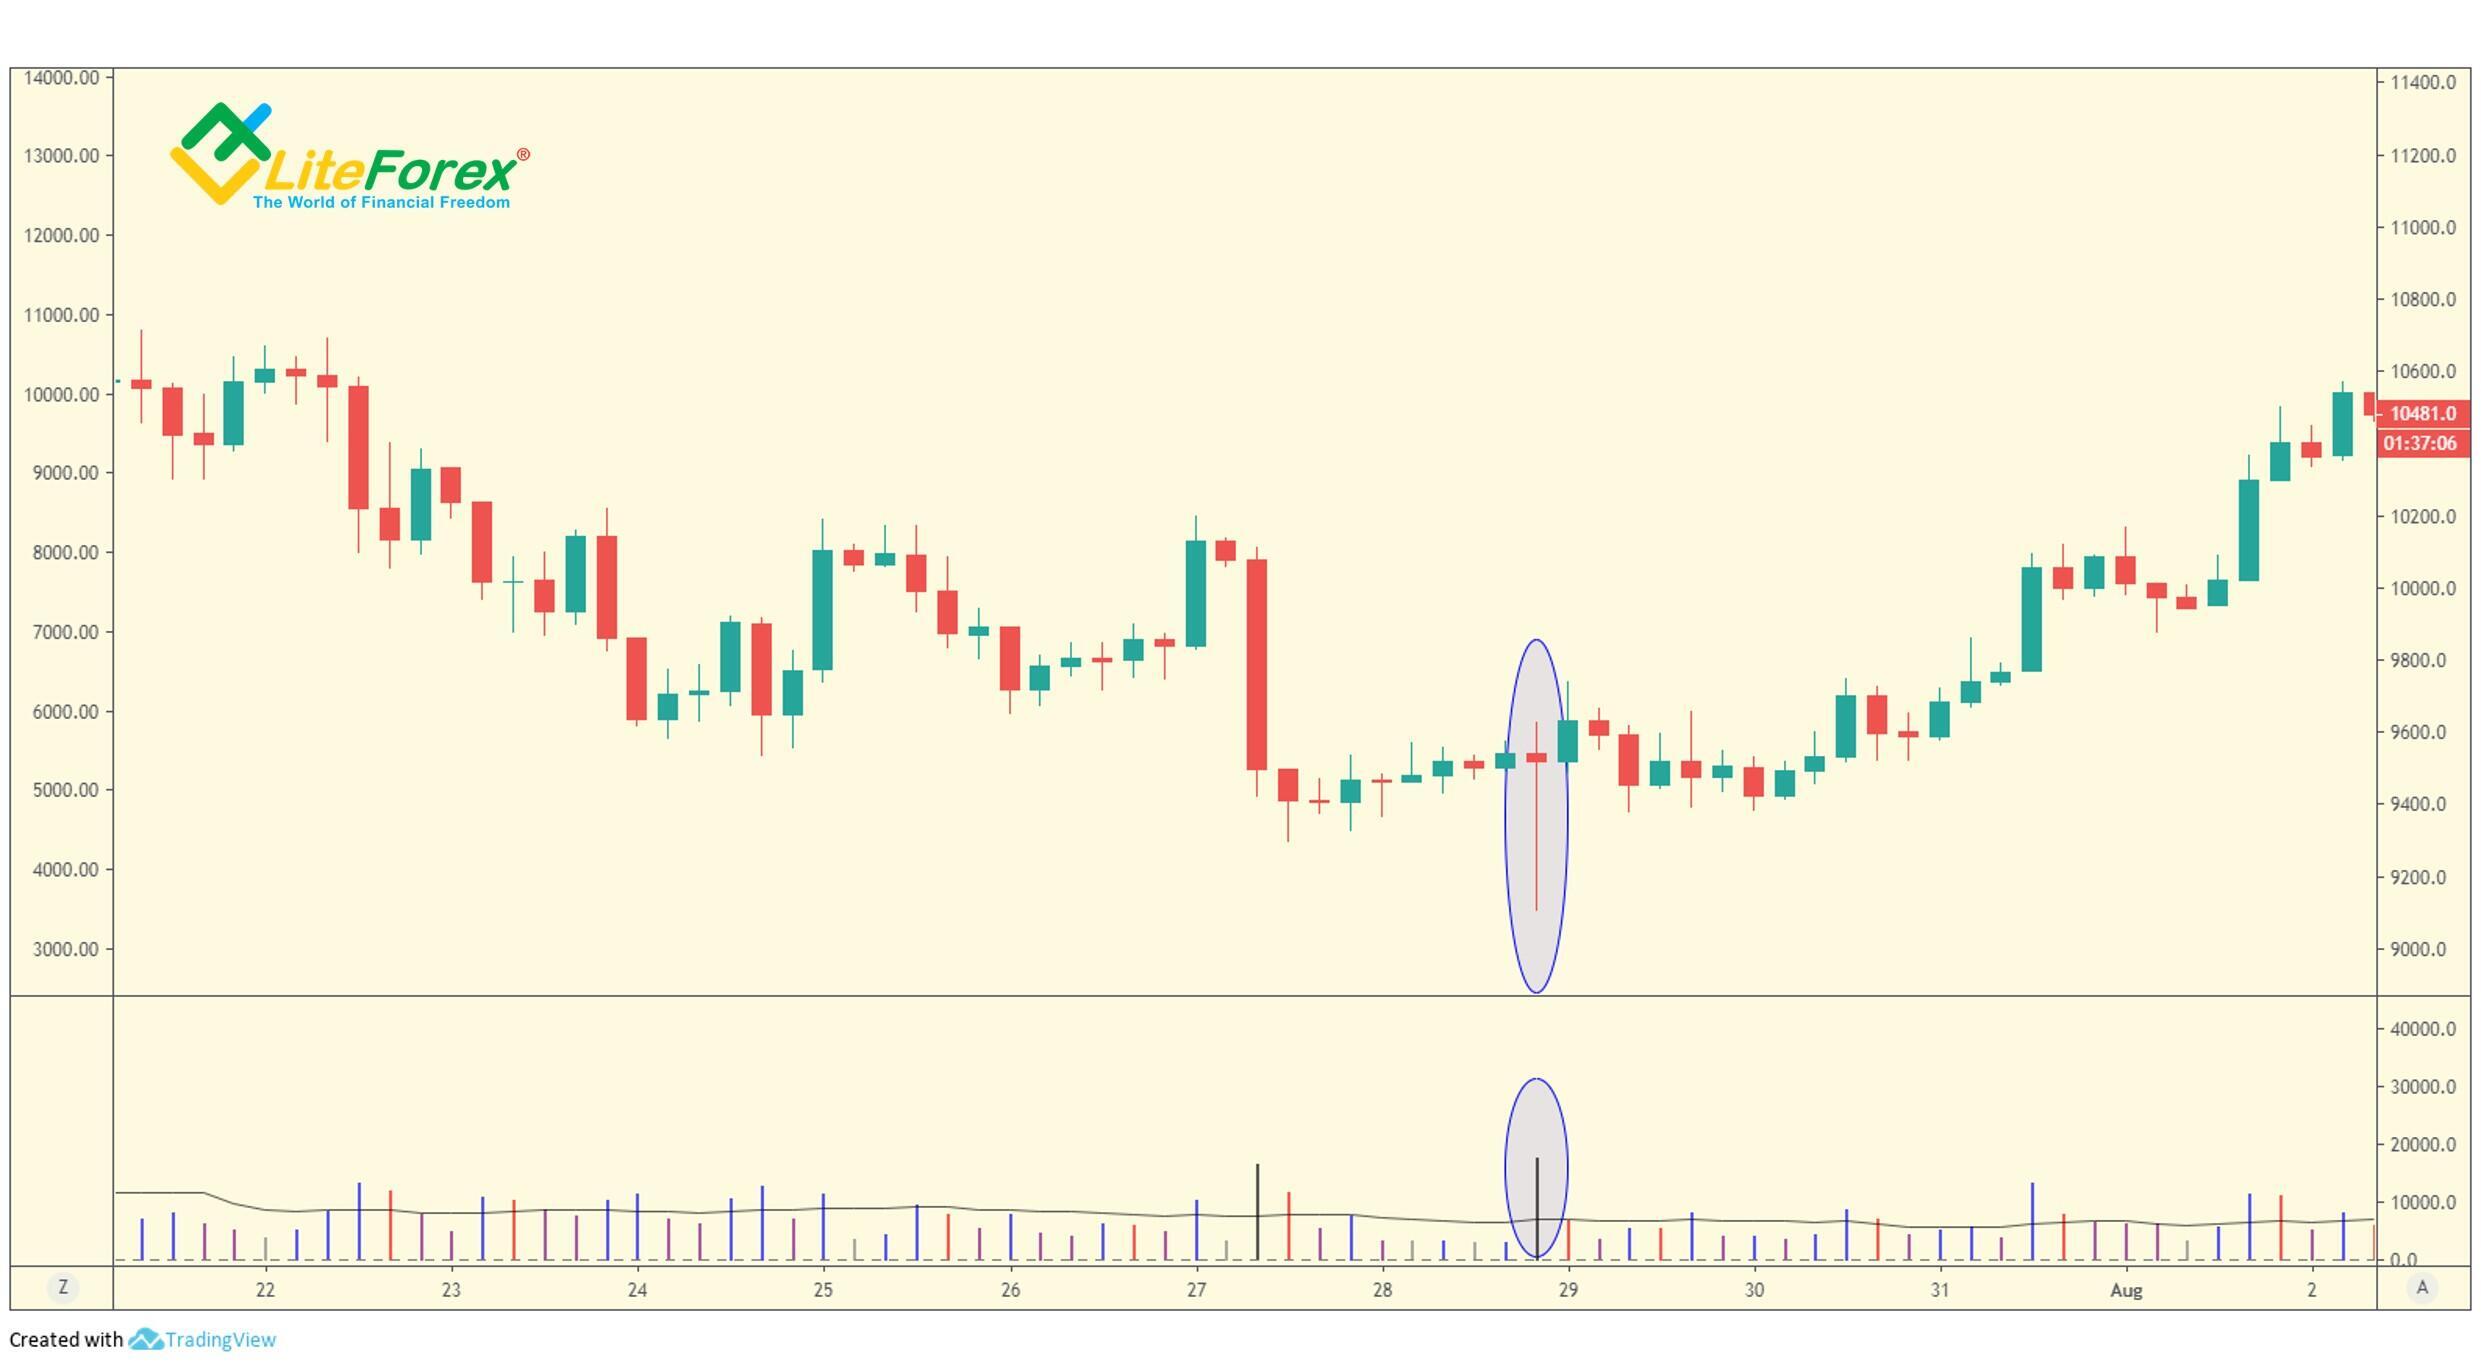
Absorption volume in a down-move
In most cases, high volume on a down-bar means selling. And the bar closes around its low. However, if the day’s action has closed in the middle or high, then a part if this volume may result from the fact that the market-makers have bought this selling out or absorbed the selling (by buying). It is a strong sign of strength, which then causes the market to stop going down, turn a bear movement into a sideways trend, or even into a bull trend.
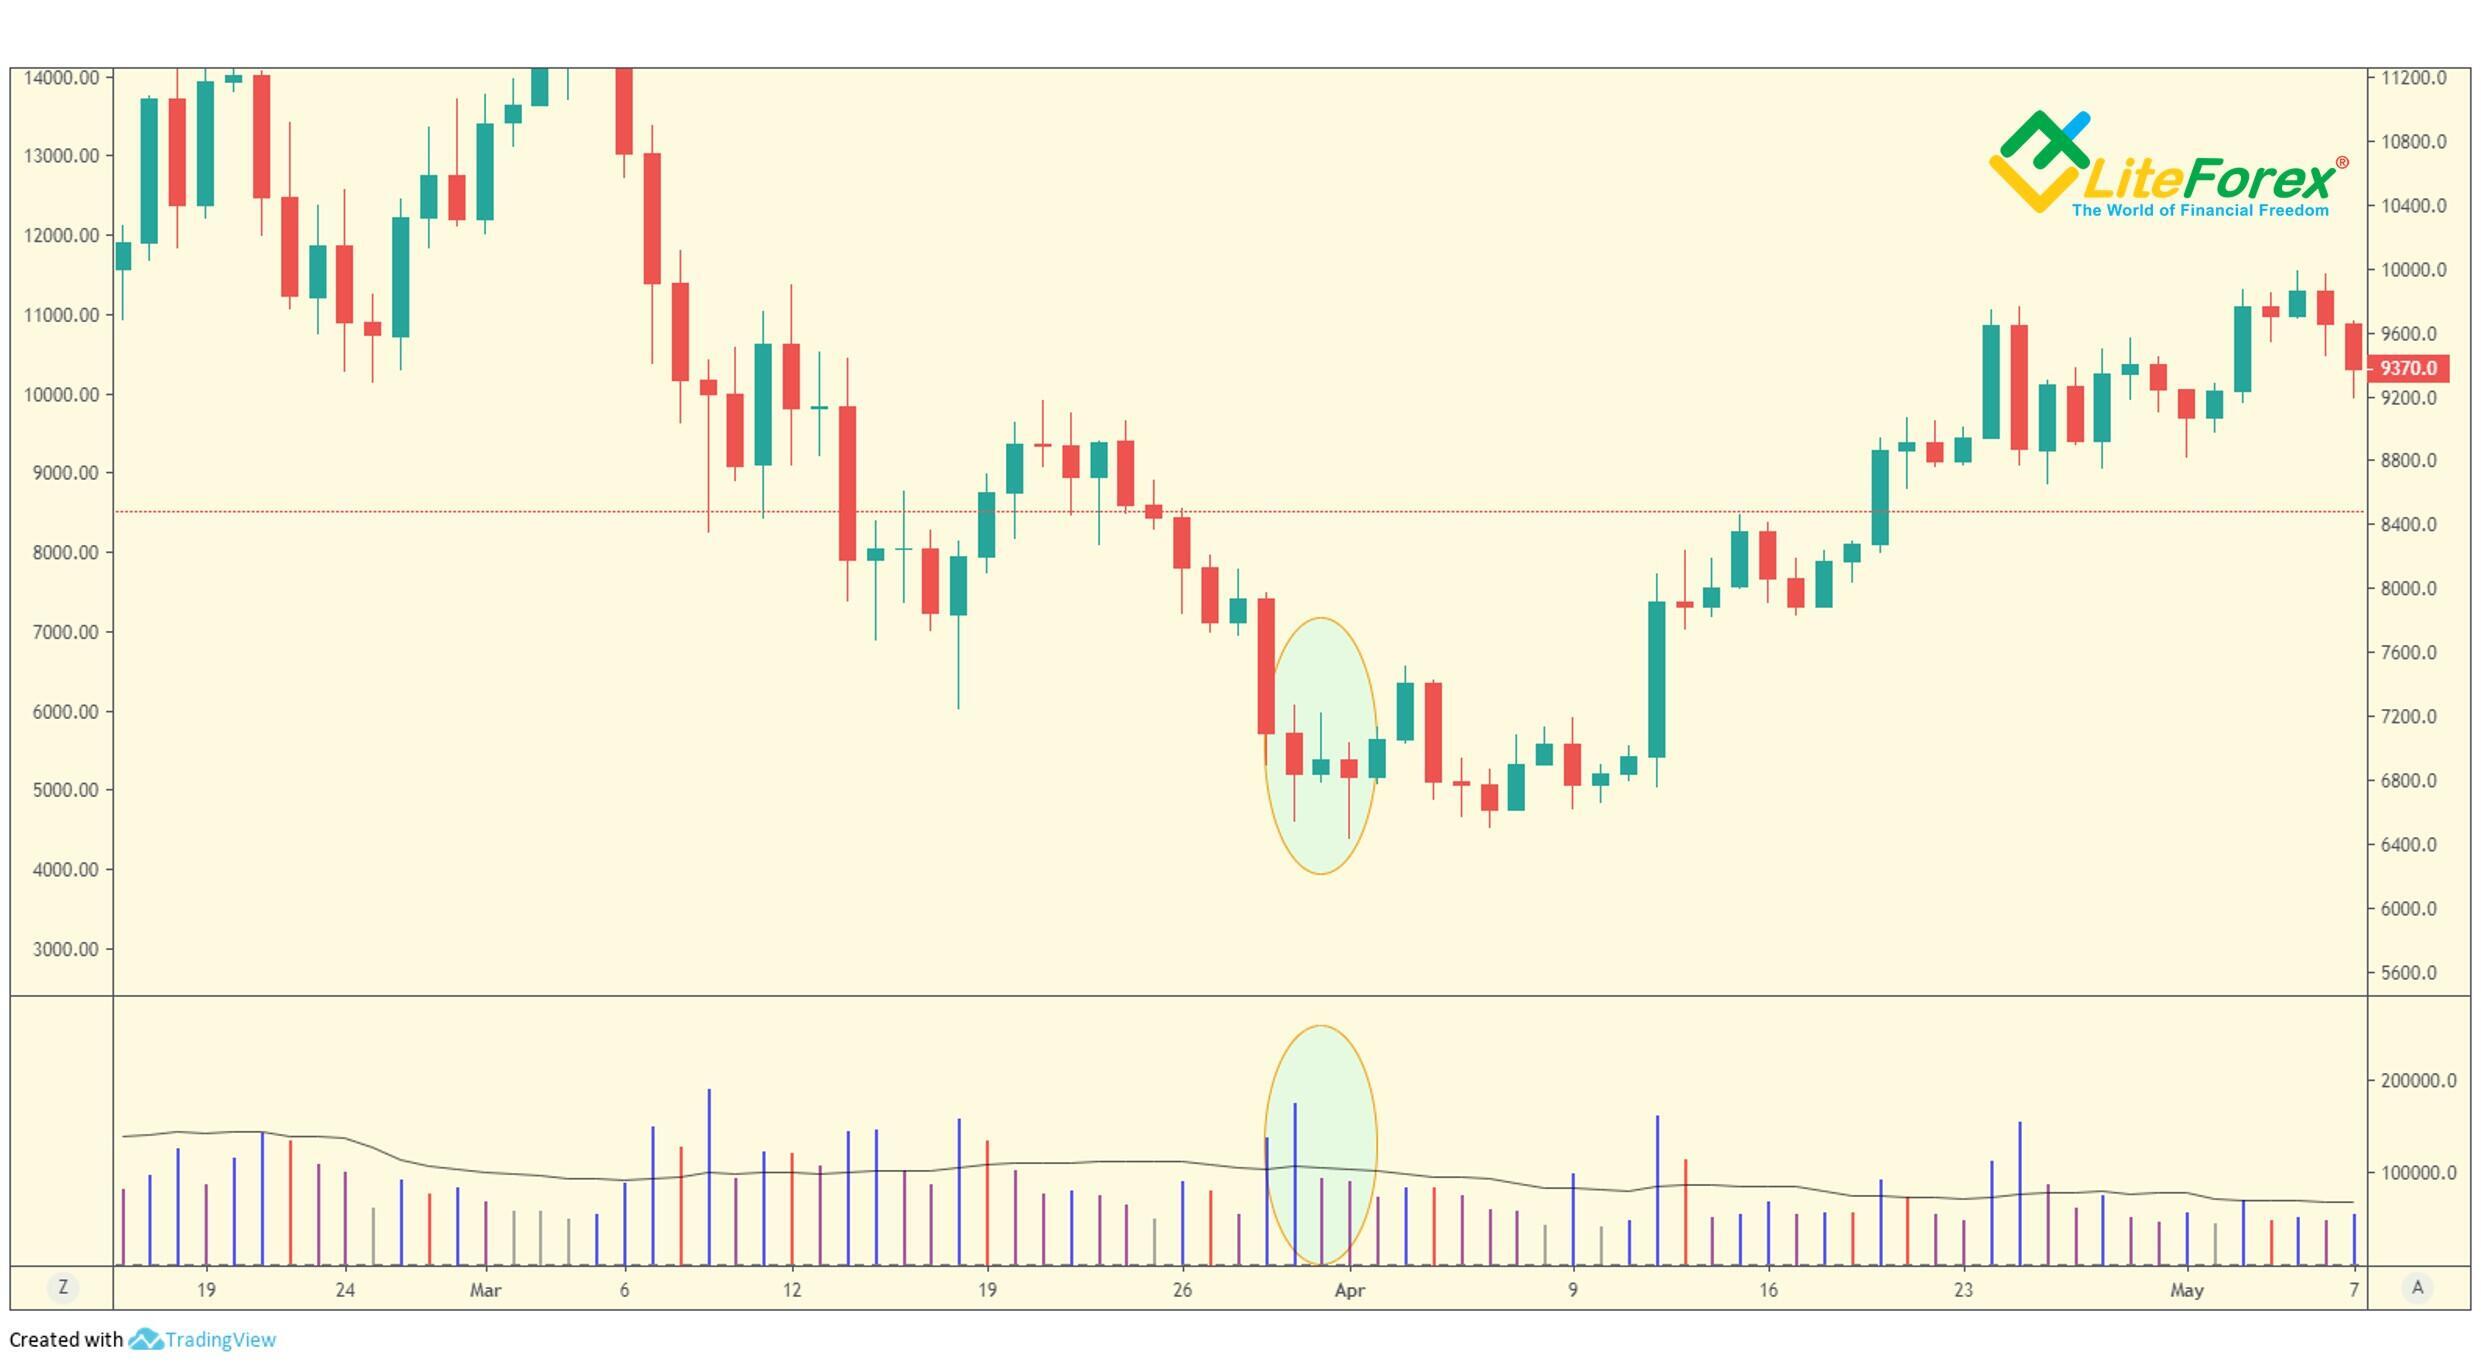
In the daily chart, an oval area marks the zone where the selling is being absorbed. After that, professionals manage to drive the price a little up, but it is not worth attention. Next, the professional money absorbs the rest of the selling. On the chart, it is seen as a bar that closes around its high. Since this moment, the bear trend turns into a sideways trend, and later, a bull market starts.
Basically, the process of the asset transfer from weak holders to strong holders is taking place during the period of sideways movement. However, the strongest sign is the moment of selling absorption as it indicates that professionals see the market strength.
The difficulty in spotting the absorption volume is that it is often accompanied by bad news. The information noise helps professionals confuse weak holders and make them chose the wrong side of the market.
How to recognize a market bottom?
In the VSA model, a market bottom starts forming with a wide spread down on high volume. As you already know, such bars signal the market weakness, selling pressure. However, if over the next few days the market is trading sideways, or even rising, the volume is high because the selling is absorbed by professional traders.
The next stage is the accumulation phase. At this period, there is often low volume with the sideways movement, This is necessary for the professionals to buy the assets at low prices. Besides, the sideways movement may result from the remaining floating supply or the shortage of assets because of the active absorption.
Another event indicating the end of the bear market is testing, through which the market-makers make sure that that supply has been removed. If the price rolls down to the old high volume area, and the volume is now low, there is now supply, which is an excellent VSA signal that prices are now set to rise.
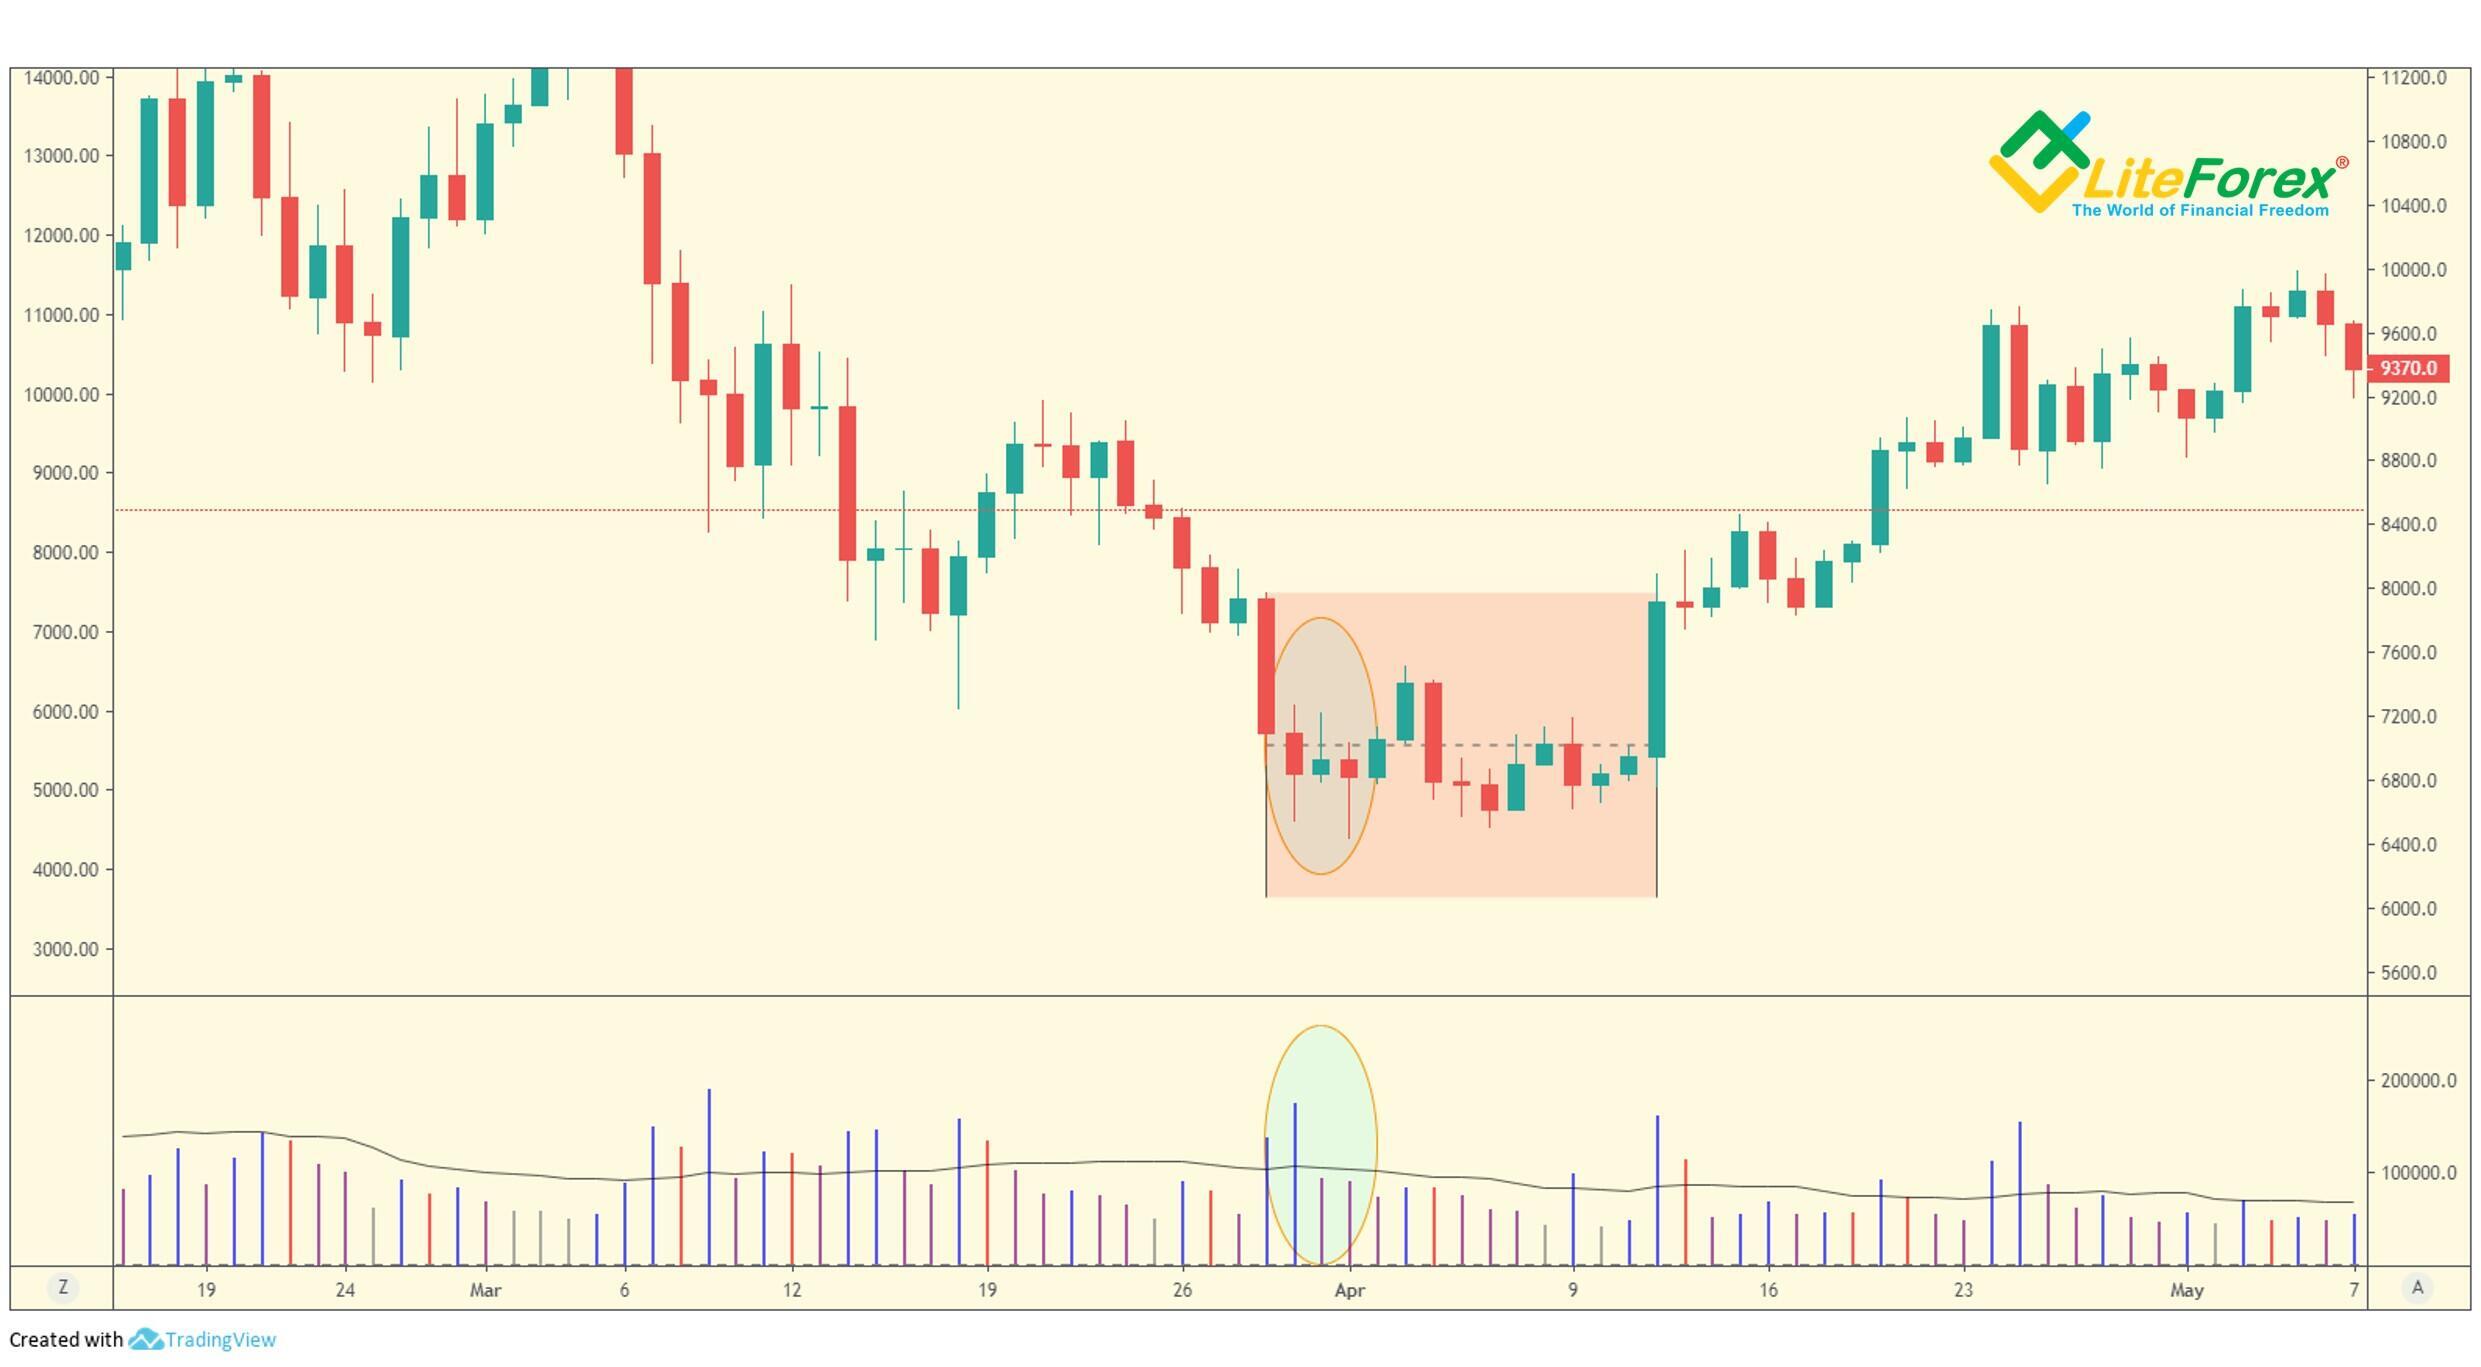
In the chart, we see a wide spread down on high volume (marked with a cross). As the next bars indicate a sideways movement, we can suggest that the selling is being absorbed by professional money. The accumulation phase, when the professionals are buying out assets at low prices to start a bull market later, is marked with the red zone in the BTCUSD chart.
Professional support
According to the VSA method, we can identify the professional support in forex according to the following signs:
- A downward trend is already in progress, and a down-bar appears, which closes on the high or in the middle.
- The down-bar is accompanied by high volume.
- The next bar is up.
If the bar closes in the middle (or high), we can surmise that demand is overcoming supply. The professional traders enter the market and buy actively, so, the trading activity is high. Note that professionals do not fight with the market. They rather pushing the market in the direction that has already originated. So, professional support in the market indicates its strength and will result in a soon price rise.
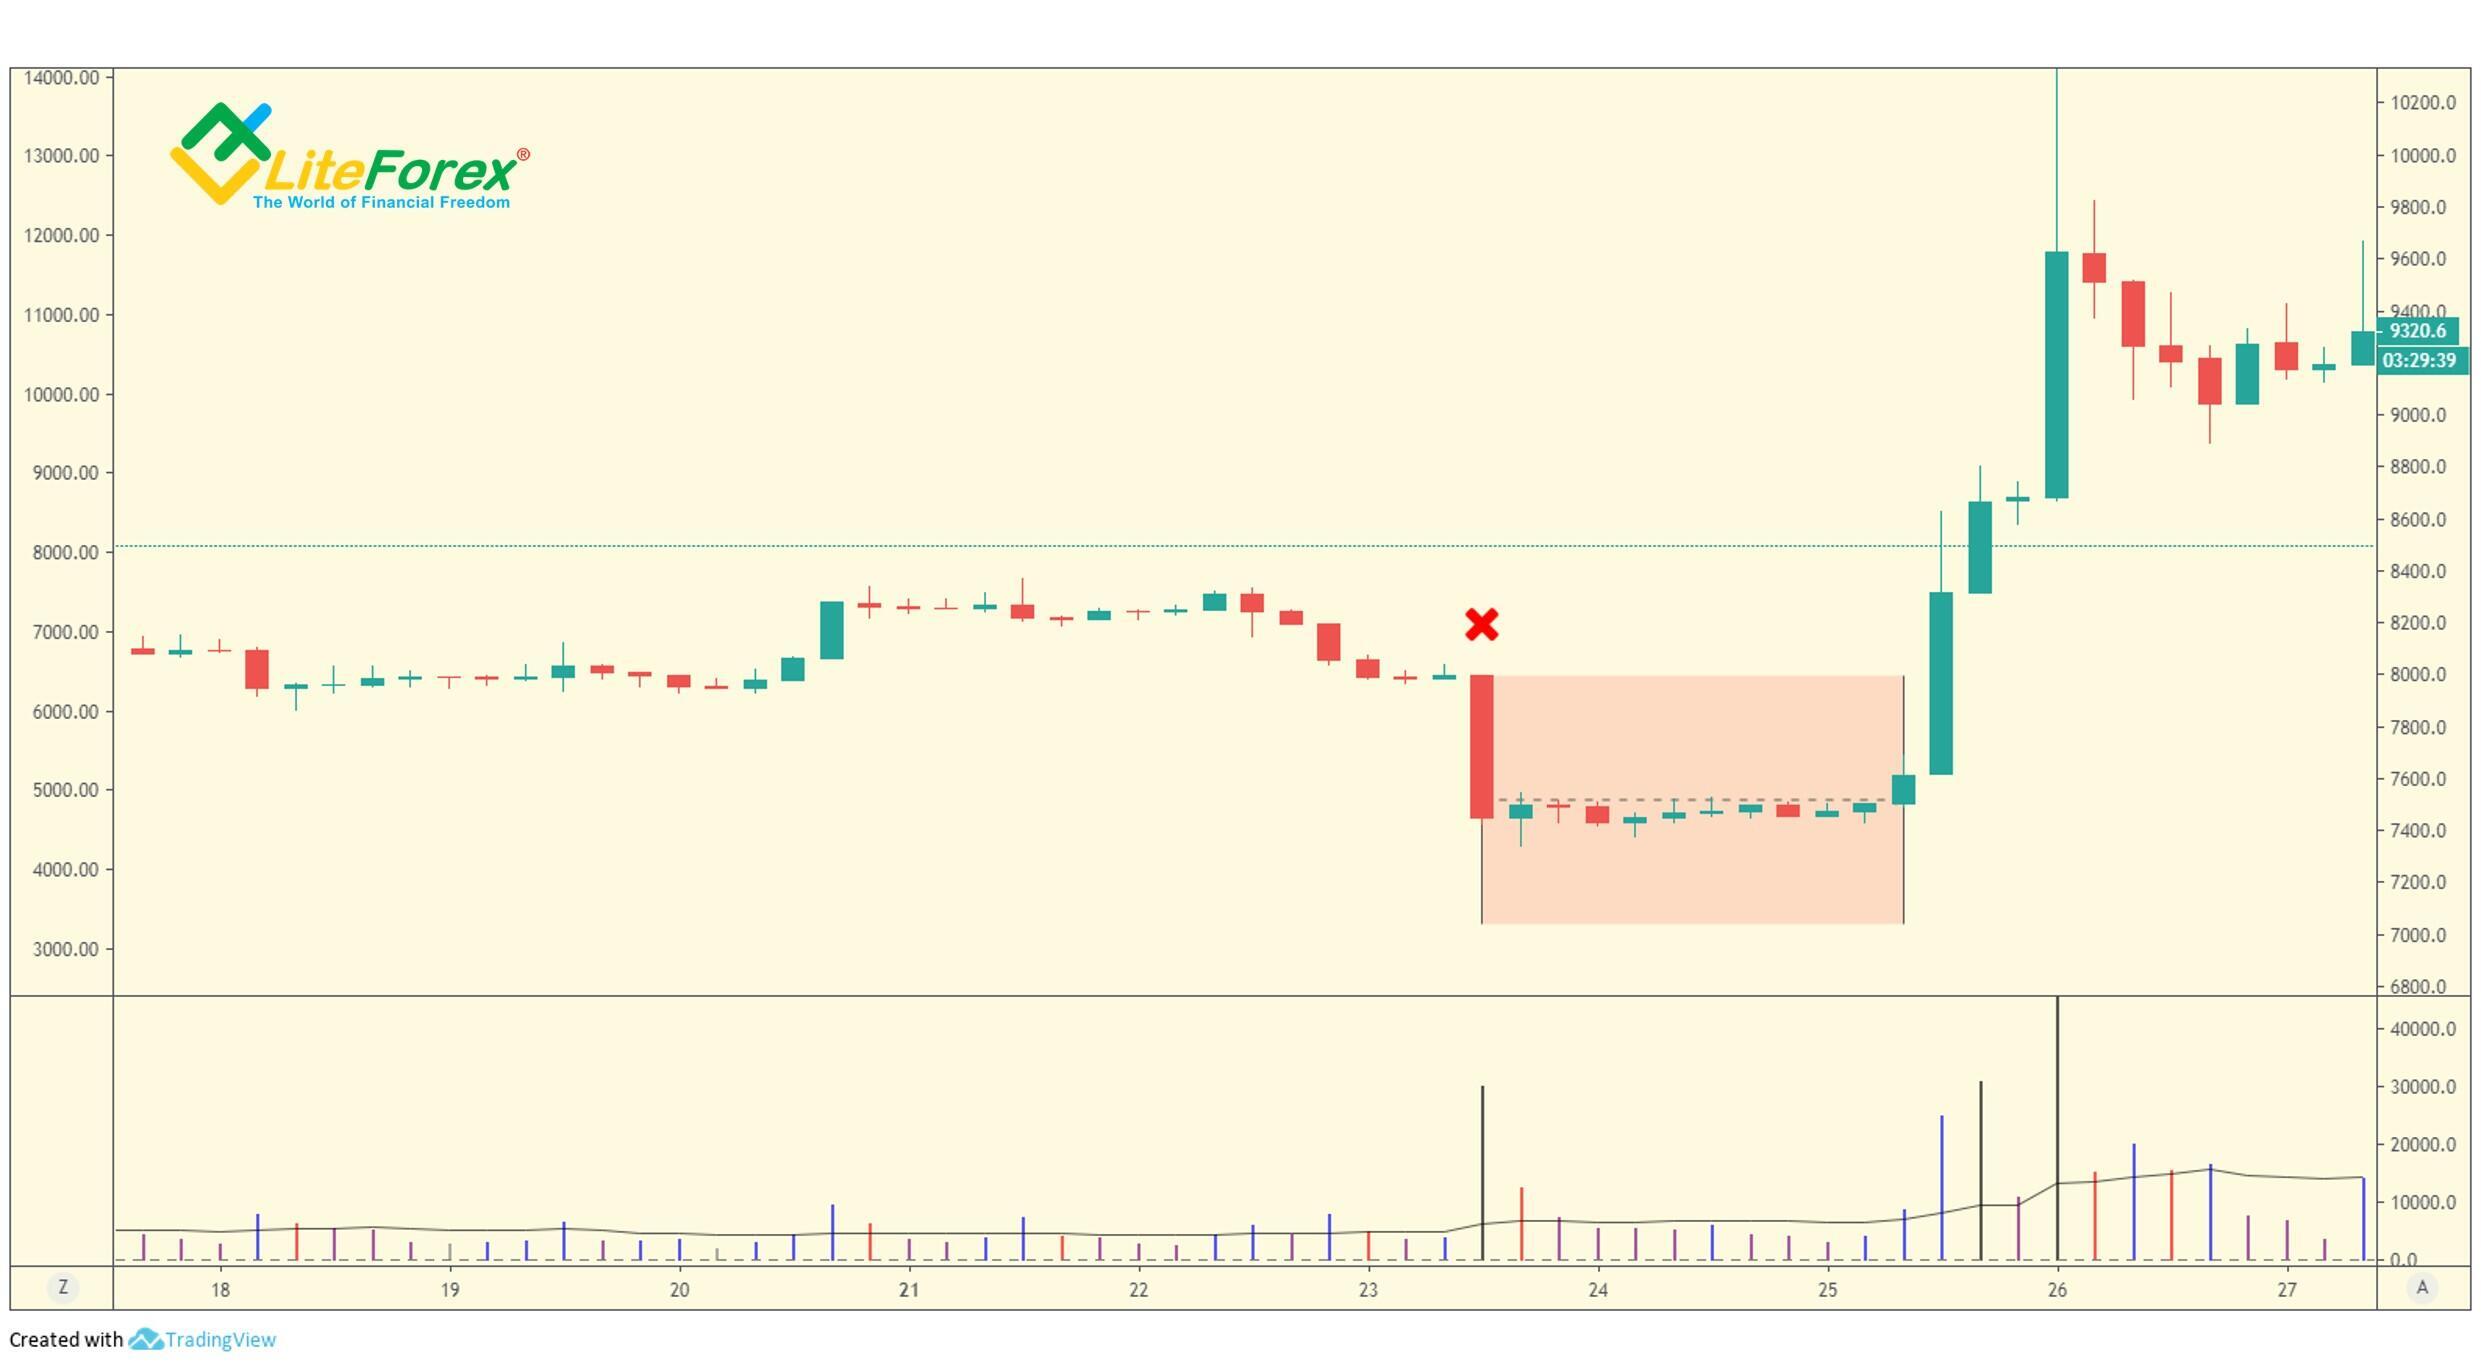
Blue oval zone marks the down-bar that closes around its high. The high volume accompanying this bar means that the professional traders must have absorbed selling, viewing the market strong enough to start moving up. And, in fact, once the accumulation phase ends in the next few days, the bitcoin price starts rising.
The shake-out
Let me explain the shake-out on the example of the BTCUSD chart.
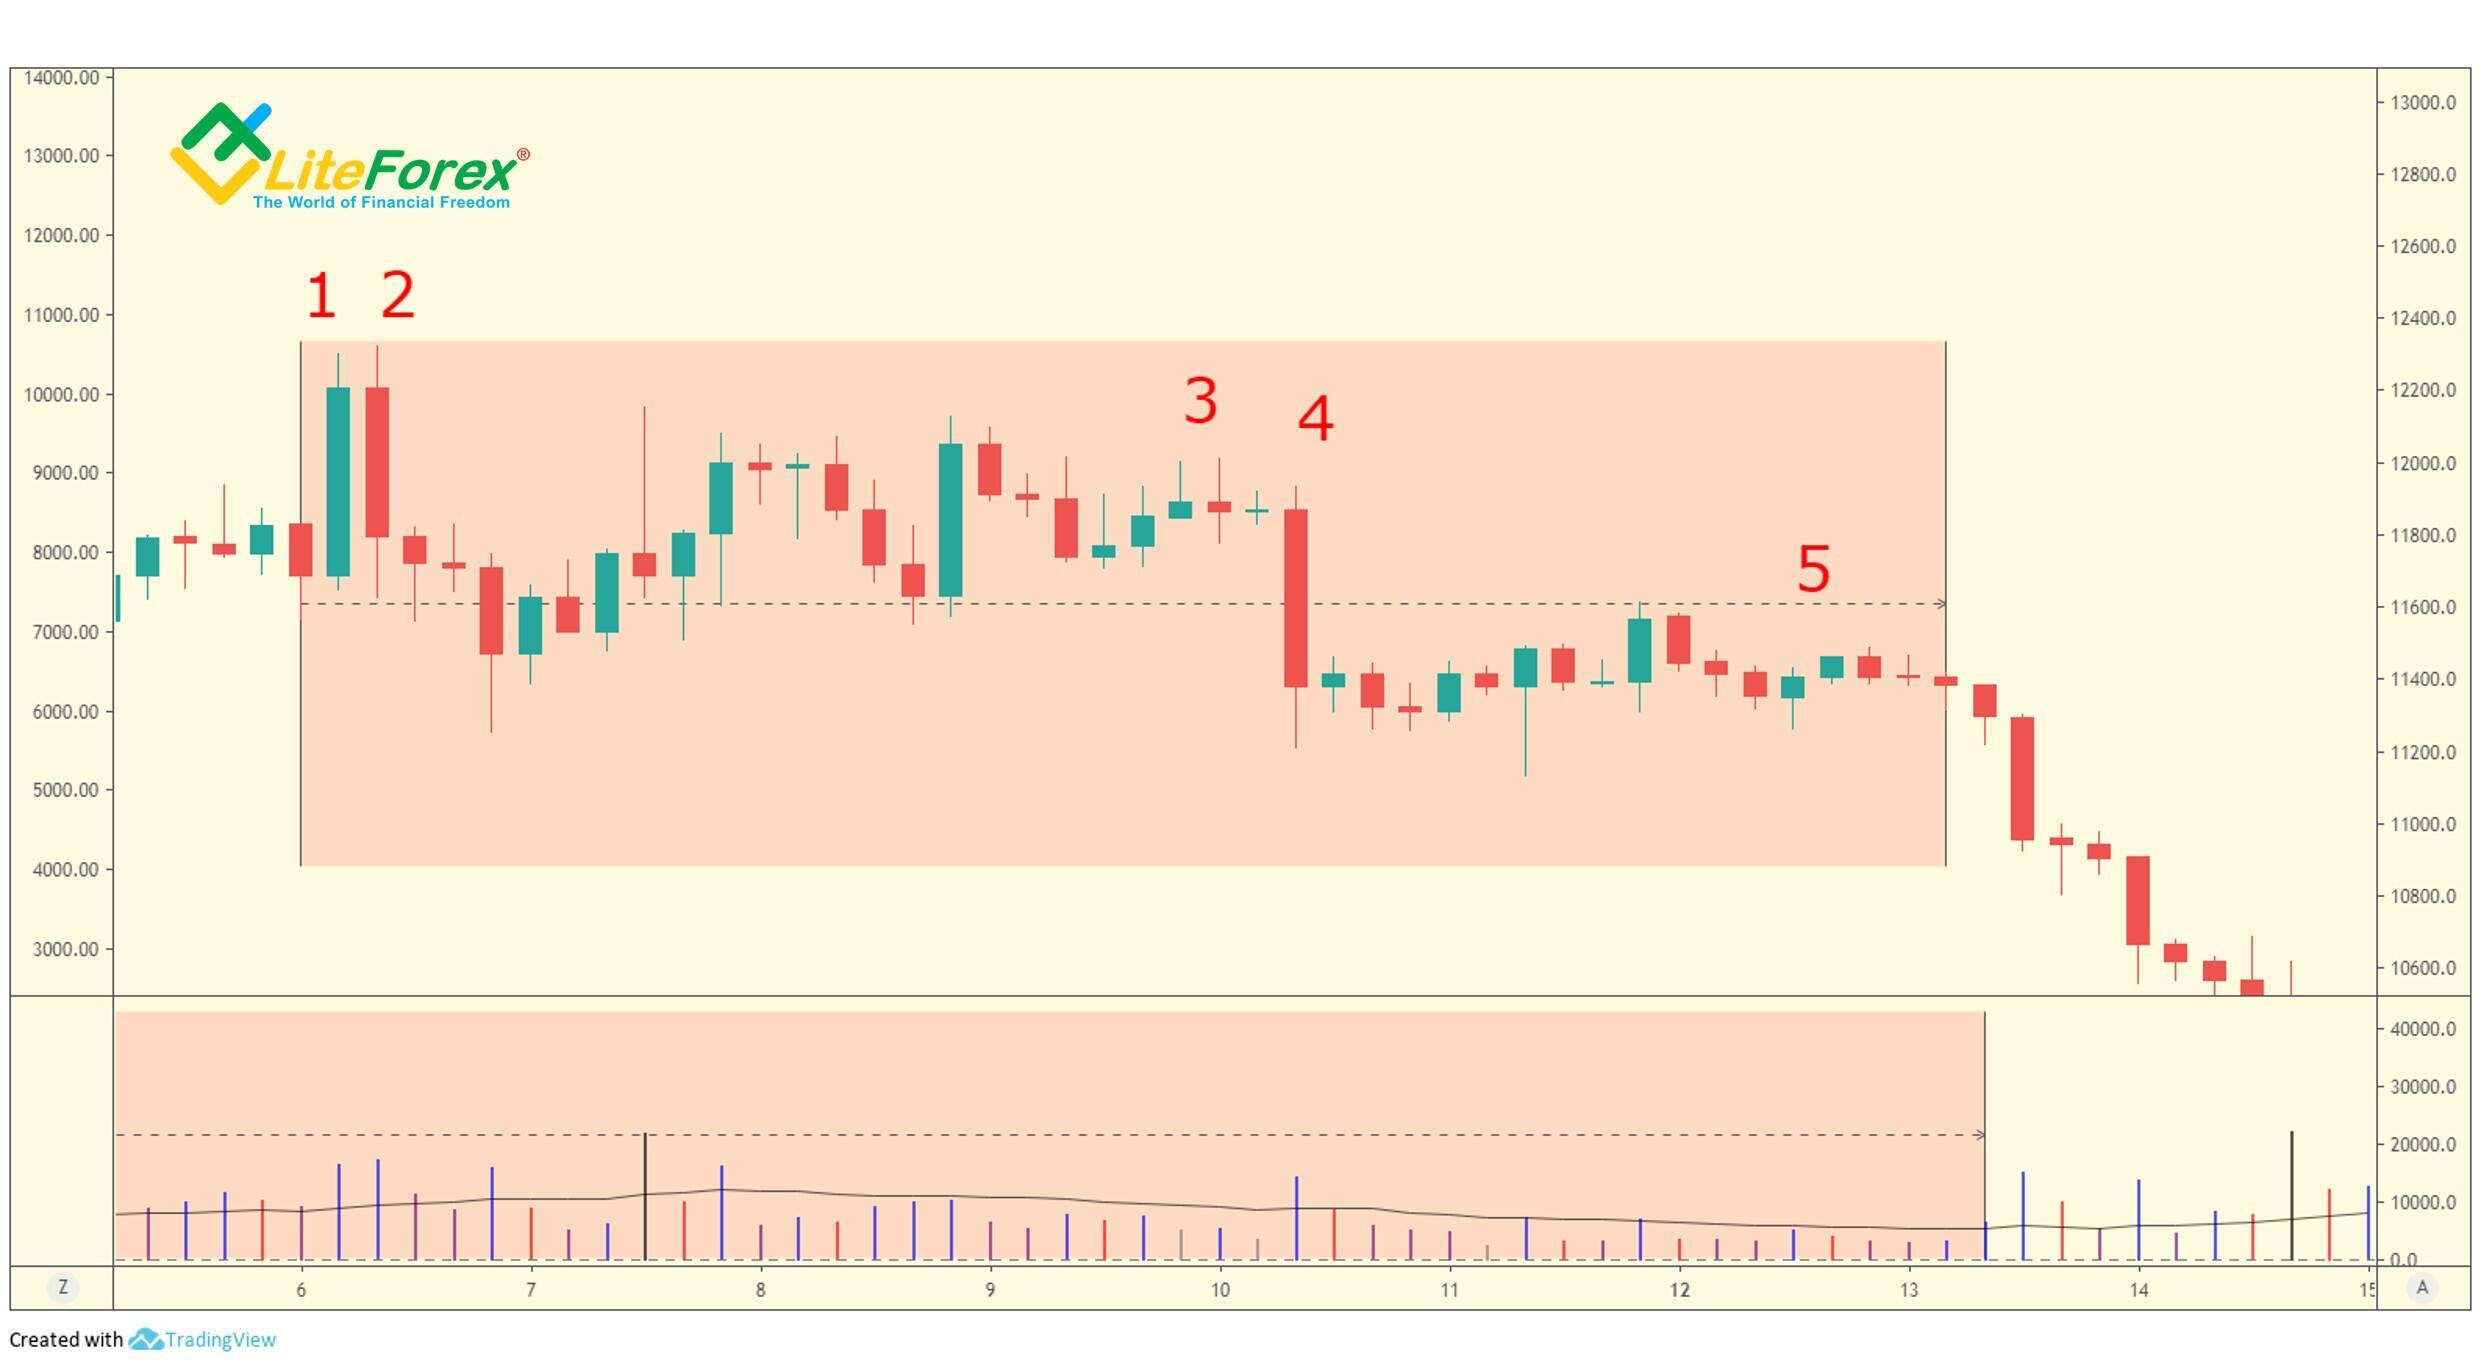
Bar 1 has a wide spread and is accompanied by high volume. Taken in isolation, it may indicate the market strength. But it is not in this case, as proves bar 2. A down-move with a similar spread on the high volume indicates selling pressure.
The battle of bulls and bears goes on through bar 3, where the volume declines on the up-move. This means that the professional money is not interested in the price growth, i.e. the market shows weakness. Next, professional traders try to drive the price down rapidly. And they succeed, as the next correction up is also accompanied by low volume. Bar 5 shows that most market participants are bullish. That is why a strong downtrend starts just in a few days.
The shake-out is similar to the selling climax. However, unlike the selling climax, it appears after the price has been moving up for some time. In the chart, it is usually displayed as a wide spread down-bar, usually on bad news. It is engineered to create panic selling, thus helping the transfer of assets back to the professional traders. In the distribution phase, the professionals estimate the natural level of support, and, if it is not strong, they start a down-move.
Stopping volume
In the VSA model, at some point a bear move, prices will start to resist further down-moves. According to the method, these resistance areas are frequently seen on a down-day, on very high volume, closing on the highs. The market closes on the highs when buyers enter it.
Besides, the high volume may appear if the bar closes on the lows. In this case, you should see what happens on the next day. If on the next day, the price is at the same level or up, there must surely be buying on the previous day as well.
This action helps the professional traders make the weak holders sell their assets. Following a down-move, the direction of the move changes or the price goes sideways, allowing the professional money to accumulate the stock. At the finishing stages of this period, strong holders test the market and start a bull move in case of success.
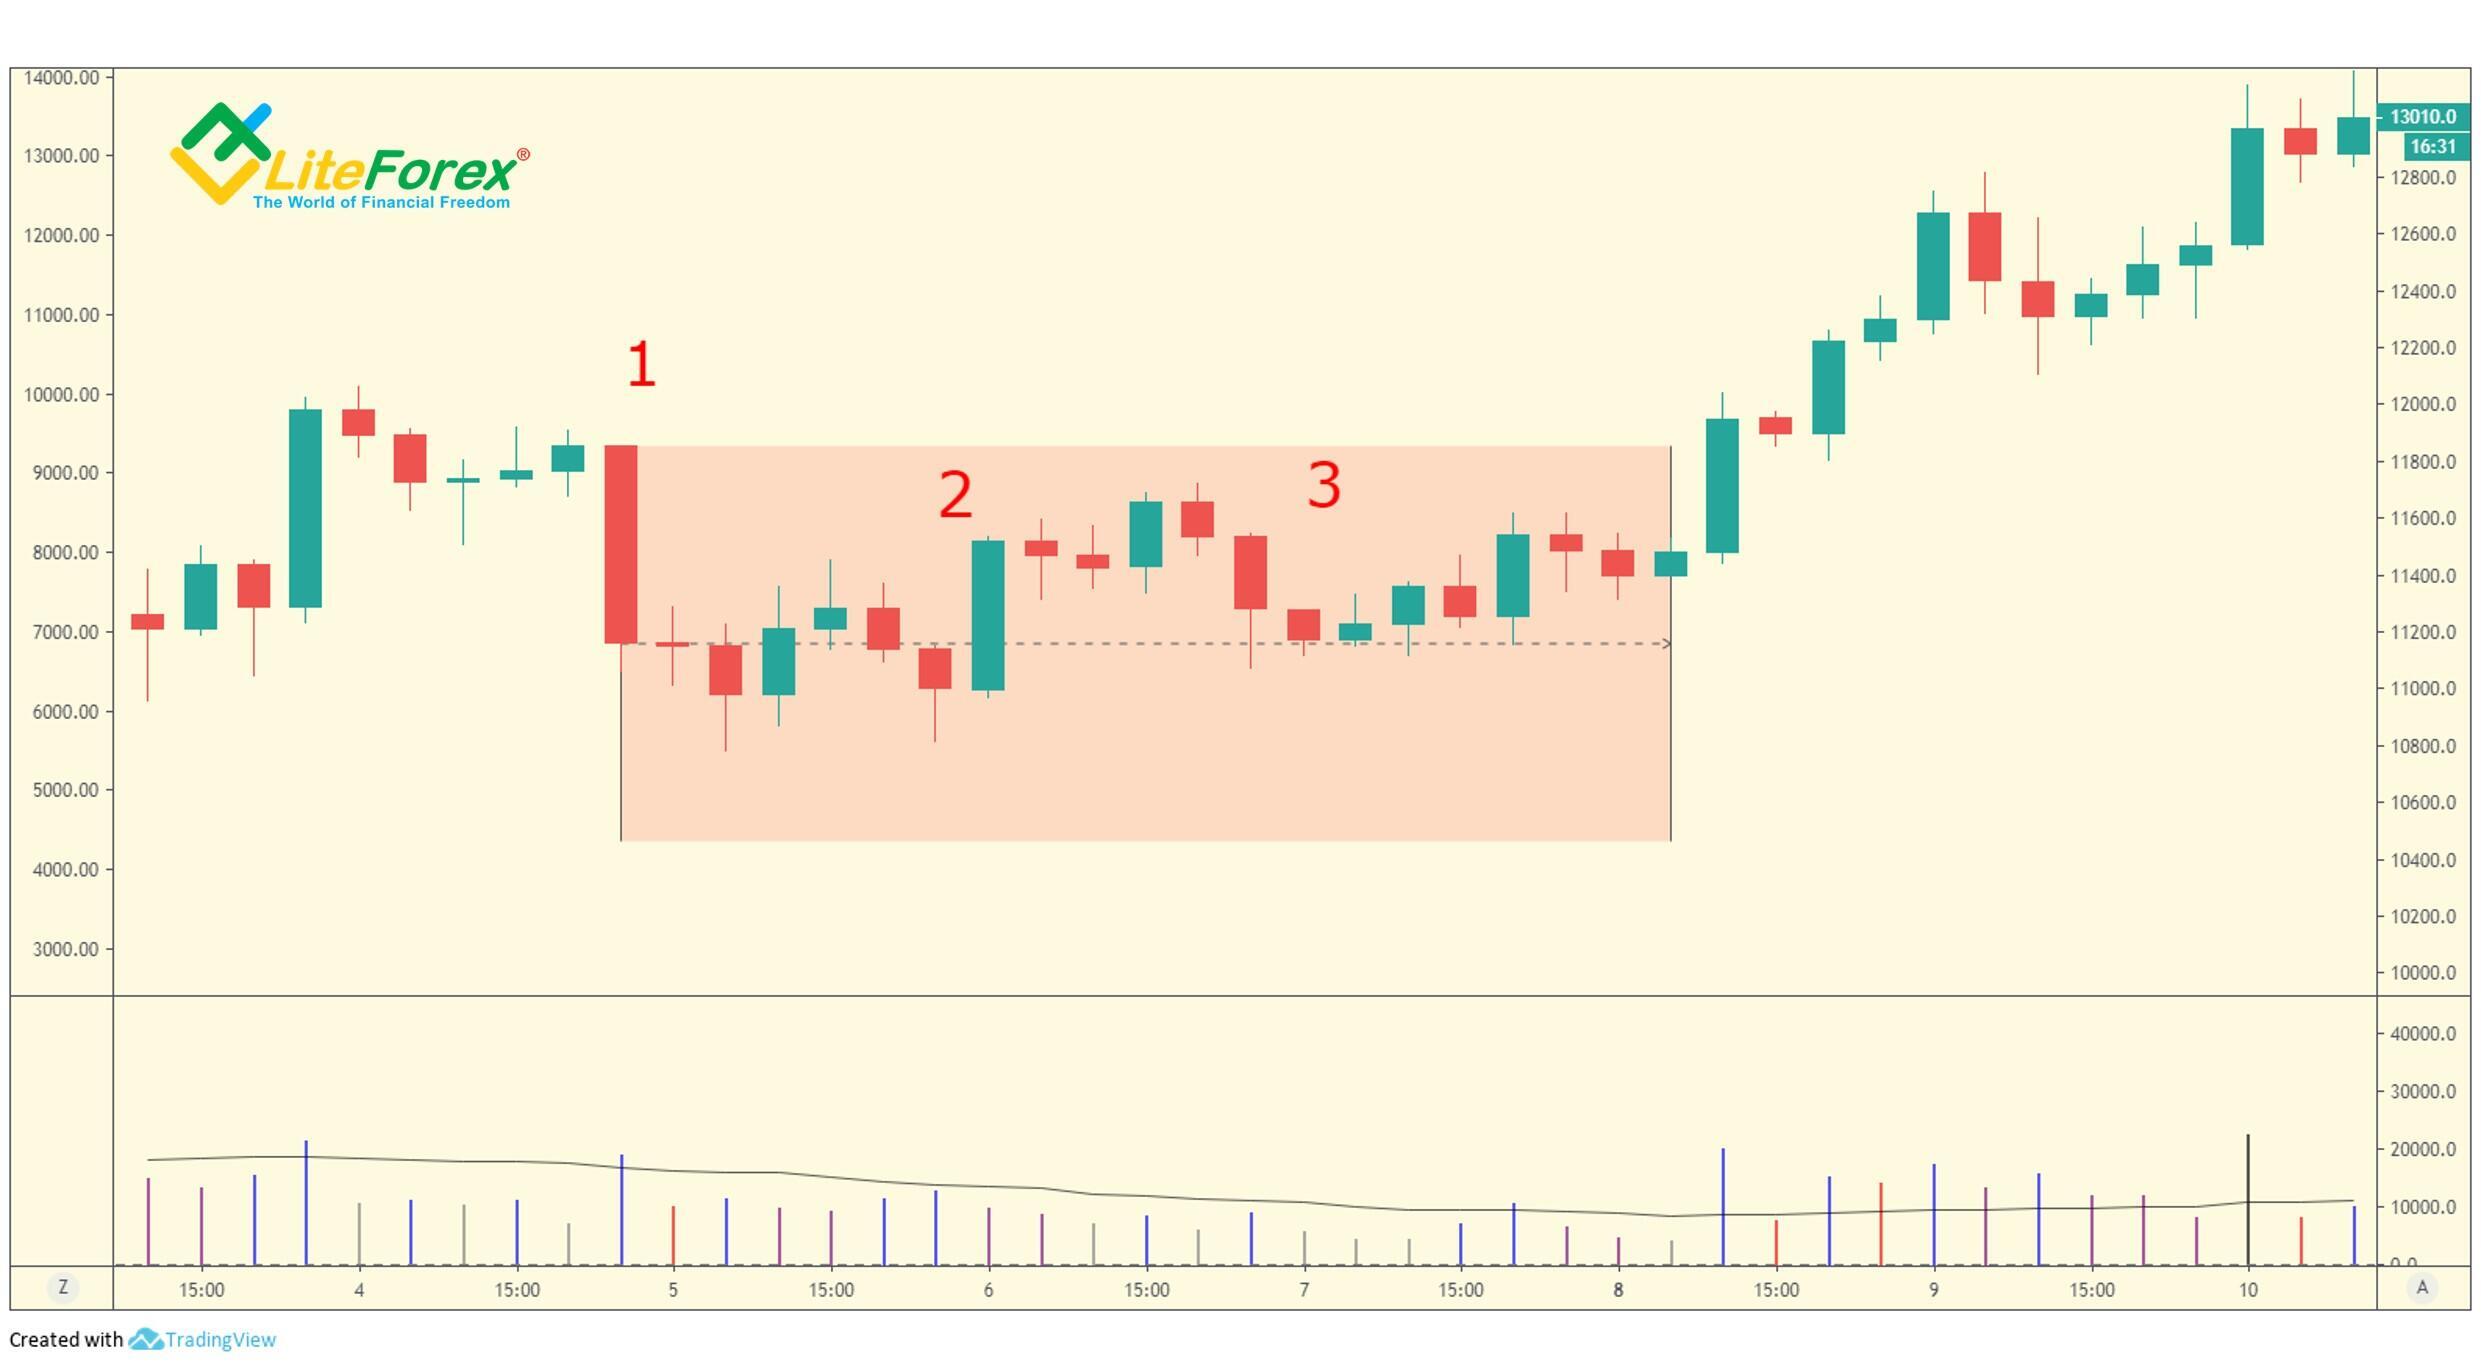
In the given example, bar 1 closes on the lows and is accompanied by low volume. It may seem to be a sign of weakness. However, on the following bars, the price is rolling back, and so, the professional money is bullish about the market.
Bar 2 shows that, although the bear move turns into a sideways trend, there are quite many traders willing to sell in the market. This is indicated by a medium volume accompanying the down move. Sometime later, the market situation gives more opportunities, bar 3 is accompanied by low volume. That is why the specialists make efforts to stimulate the bull move.
Falling Pressure
We have come across this pattern more than ones in the previous examples. It looks like y a wide spread down on low volume, closing on the low. However, it is not an indication of an immediate trend reversal.
It shows a lack of determined selling pressure; therefore, the market is unlikely to decline very much further. It should be analyzed together with other signals. For example, if the low penetrated into an old previous support, and the bar closes on the high, it is a bullish signal.
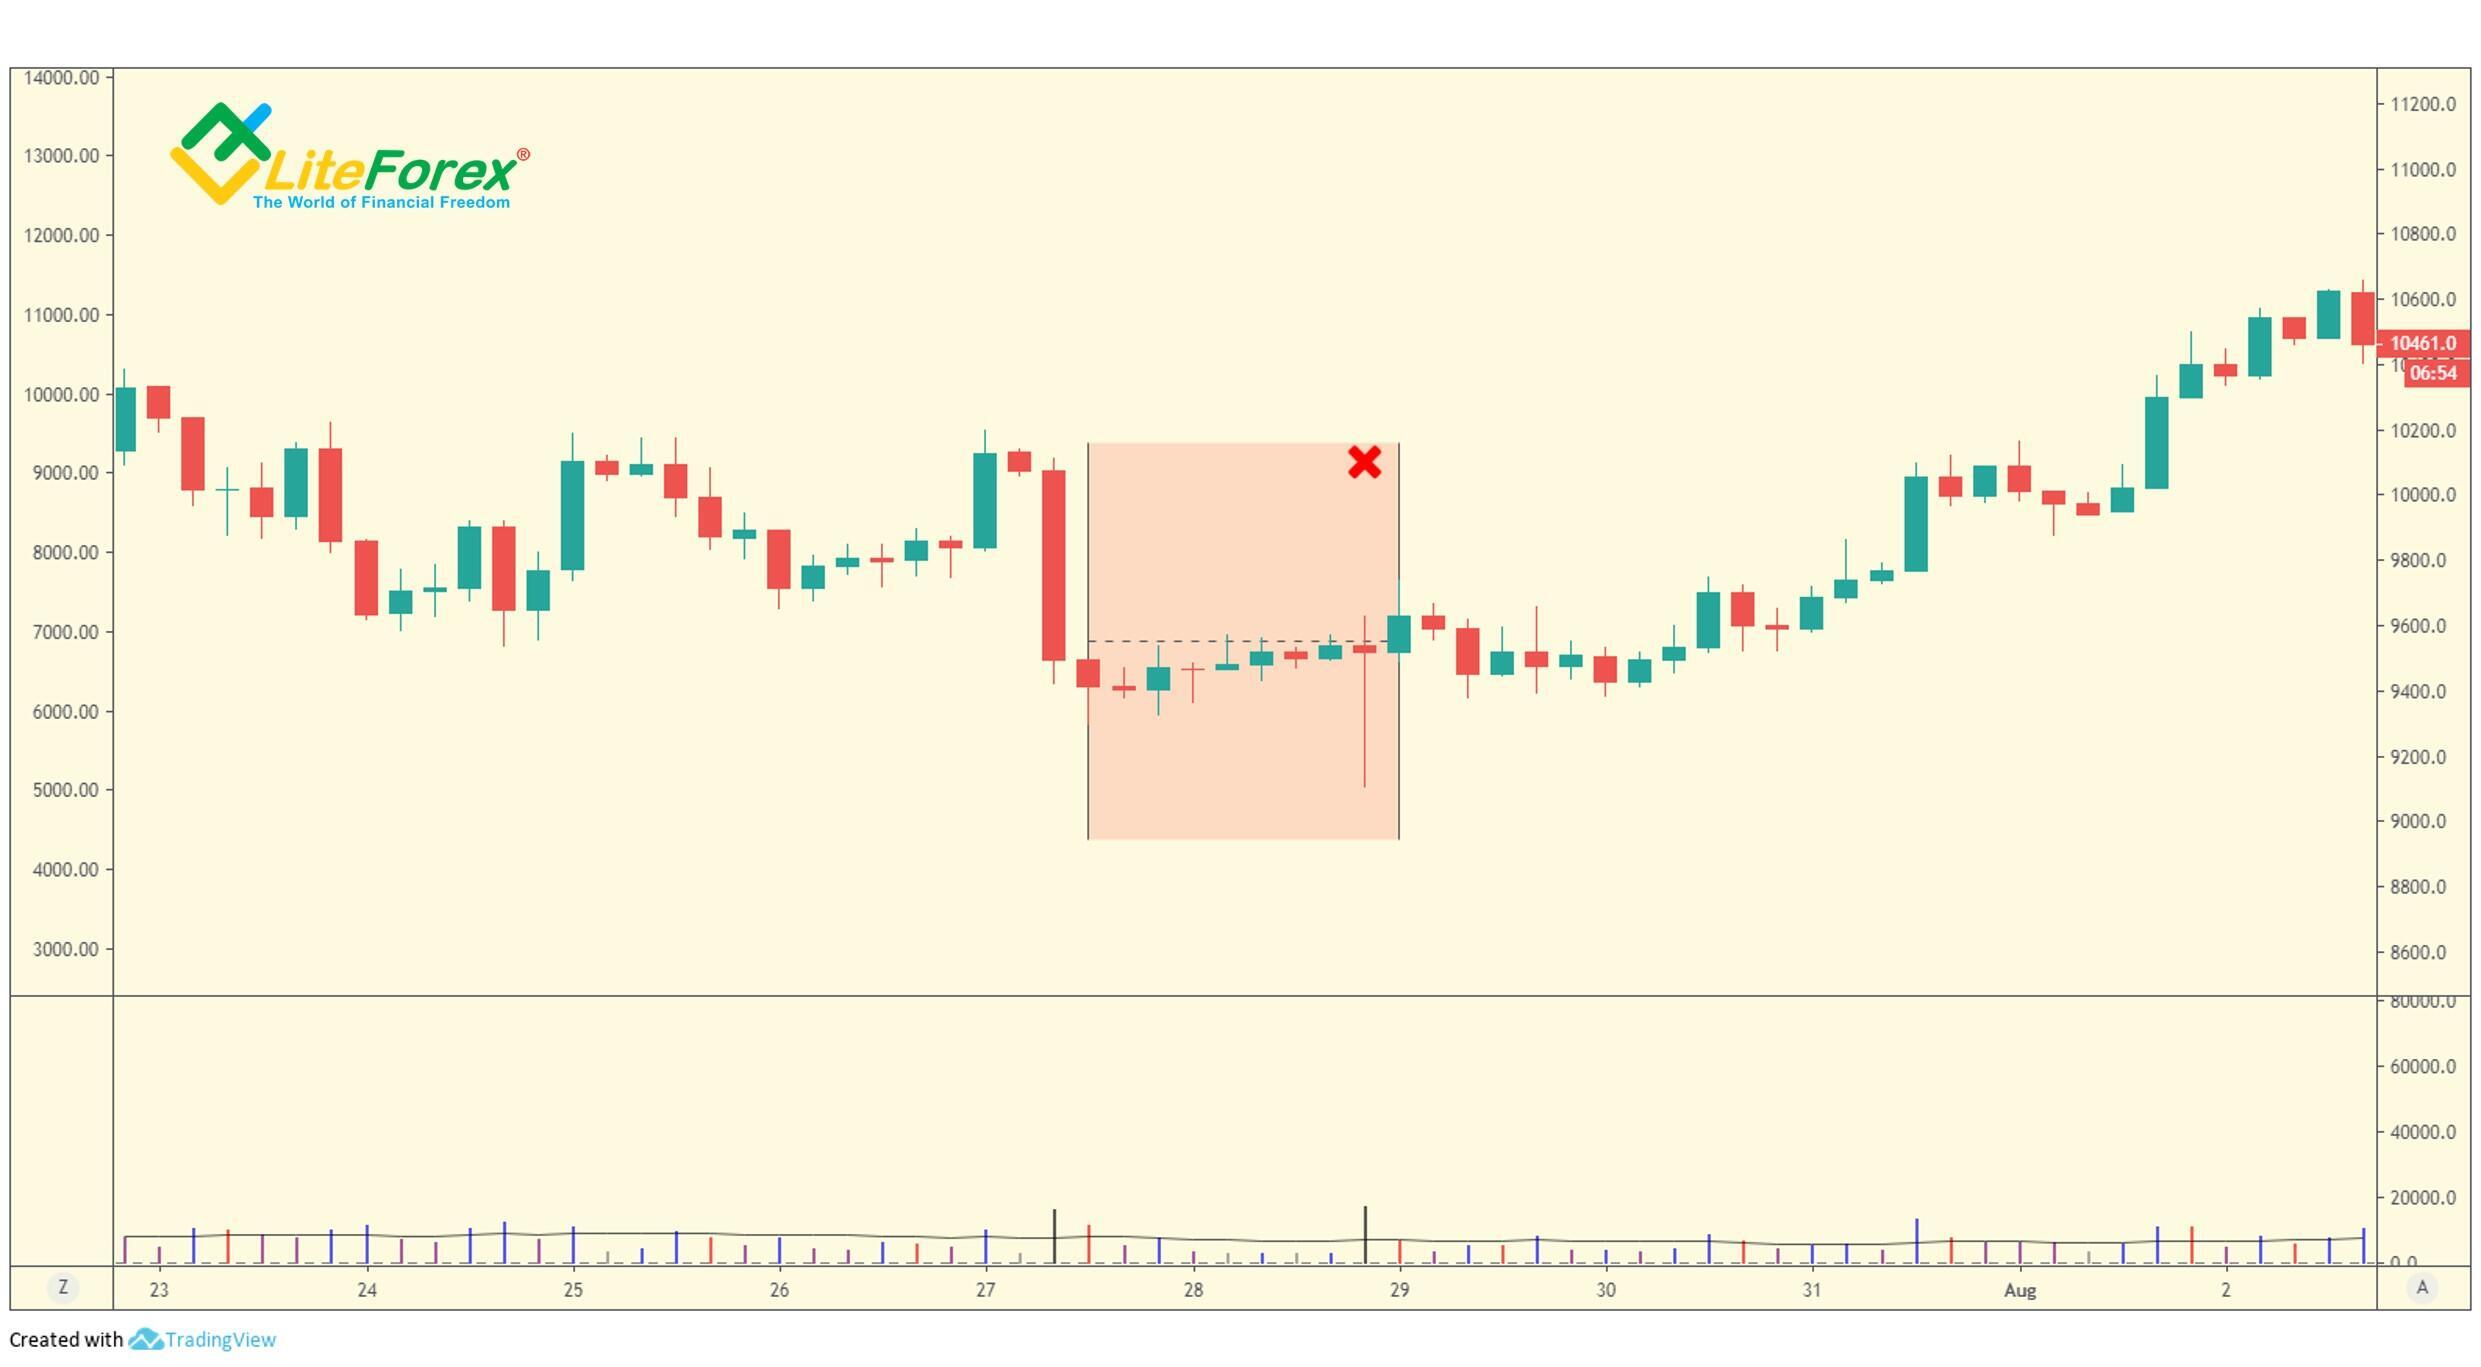
The falling pressure following a sharp drop is marked by the red zone on the above chart. The bar marked with a red cross closes around its high, which signals the growing market strength; in addition to the lack of selling, it signals a soon trend reversal up. As the next days prove, the down-move really turns into a bull trend.
Note that in the early stages of a bear market, the volume may not be high as well. In this case, the signs of weakness in the background are the great trading signals that professional traders are interested in a bear movement.
Let us sum it up
Well, we have in detail studied the major factors that start a bull and a bear market. Now, it is time to revise and sum it up.
Signs strength
- Testing. The price rolls down during a bar, but next, it goes back and the bar closes in the high area. Besides, the test bar is accompanied by low volume.
- Stopping volume. This results from a great number of buy orders that cause the down-move to stop.
- The price goes back down into the previous high volume area; the volume is now low. This signals that the market is now strong enough to be rising on its own, without any efforts made by market-makers.
- A shake-out is engineered to remove the demand and accumulated the stock to start a bull market later.
Signs of weakness
- A buying climax.
- An up-thrust.
- A no-demand day (or bar).
- A narrow spread, on an up-day (or bar), which is into new high ground, on very high volume.
- High volume present on an up-day (or bar), whilst the market falls on the next day (or bar), and
What should I take into account before entering a long trade?
When you have just started your trading career and you are still learning, I recommend you have a checklist that will help you to bear in mind all the factors before you enter a buy. An approximate checklist looks like this:
- Are there signs of strength and no signs of weakness?
- Can you recognize the early stages of an upward trend? Is the market now in the stage of uncertainty?
- Is there persistent daily support? The low of each bar should be higher than the previous bar.
- Are you going to listen to the news rather than looking at the facts? The market-makers often use the news background to mislead the weak holders.
- If you enter a trade, will you be following the market? It typically makes sense to buy in the strong market on a low volume correction.
- Where is the next support level?
You must remember that above and below any actively traded market are thousands of stops, which are actively targeted by market-makers, especially during periods of thin trading activity. The best place to position a long stop is at a point where you have seen a reaction and then the move continued up.
What should I take into account before entering a short?
Likewise, there is a suggested checklist for going short: Are there any signs of the market weakness and no signs of strength? The signs of strength are: there is a recent selling climax, the market is oversold, there is stopping volume, there is a successful test in the background and so on.
- Are there any signs of the market weakness and no signs of strength? The signs of strength are: there is a recent selling climax, the market is oversold, there is stopping volume, there is a successful test in the background and so on.
- Can you recognize the early stages of a downward trend? Or is the down-move just slowing down and the market turns into the stage of uncertainty?
- Is the market constantly falling on no support? The low of each bar should be lower than the previous day bar.
- Can you see any bars that have a narrow spread, accompanied by high volume (on an up-bar), after a substantial up-move has already taken place? This is a sign of weakness.
- Are you going to listen to the news, rather than look at the facts on your charts? The market-makers often use the news background to mislead the weak holders.
- If you enter a trade, will you be following the market? It typically makes sense to sell in the weak market on a low volume correction up.
- Where is the next resistance level?
This is all about the VSA model in crypto trading. I hope that the information from my articles will help you trade as professionals and always be on the right side of the market.
I wish you good luck and good profits!
P.S. Did you like my article? Share it in social networks: it will be the best "thank you" :)
Useful links:
- I recommend trying to trade with a reliable broker here. The system allows you to trade by yourself or copy successful traders from all across the globe.
- Use my promo code BLOG to get a 50% deposit bonus on the LiteFinance platform. Simply enter this code in the appropriate field when funding your trading account.
- Telegram chat for traders: https://t.me/litefinancebrokerchat. We are sharing the signals and trading experience.
- Telegram channel with high-quality analytics, Forex reviews, training articles, and other useful things for traders https://t.me/litefinance
Price chart of BTCUSD in real time mode
The content of this article reflects the author’s opinion and does not necessarily reflect the official position of LiteFinance broker. The material published on this page is provided for informational purposes only and should not be considered as the provision of investment advice for the purposes of Directive 2014/65/EU.
According to copyright law, this article is considered intellectual property, which includes a prohibition on copying and distributing it without consent.