Trends and Volume Spread Analysis
Dear friends!
If you don’t know the trend direction, it is difficult to identify the right place and the right time to enter a trade. That is why I will devote today’s lesson to constructing trend lines and their application within the VSA model.
This article continues the series of lessons devoted to Volume Spread Analysis.
In the previous articles:
- Masters of the market. Part 1 here, I described the basics of how the market operates in general, the influence made by market-makers on the price movements, and how to tell whether the market is strong or weak.
- In the next article, The basics of market reading. Masters of the market. Part 2, I explained the basics of the market reading, identifying lack of demand, testing supply, pushing up through supply, and many others.
Today, I will deal with the following techniques of the market reading:
- constructing trend lines,
- bottoms and tops,
- trend lines and perceived value,
- using trends to identify overbought and oversold levels,
- pushing through support/resistance levels,
- absorption volume and lower trend lines.
Why do you need to draw trend lines on the price chart?
To identify the direction of the underlying trend. Markets are generally moving in one general direction or a trend about 30% of the time. If you determine this direction, you will anticipate how the price will change shortly.
To identify breakouts and changes of direction. A strong move up or down will often be followed by a strong move in the opposite direction.
To identify support and resistance levels. Price bars on the chart often rebound from the trend lines. As well as using the current trend lines, old trend lines originating well back in the chart's history can be used to identify areas of particularly strong resistance or support.
Rules to construct trends channels
In an uptrend, we use two low points and one intervening high point. Accordingly, in a bear market, we use o use two high points and one intervening low point.
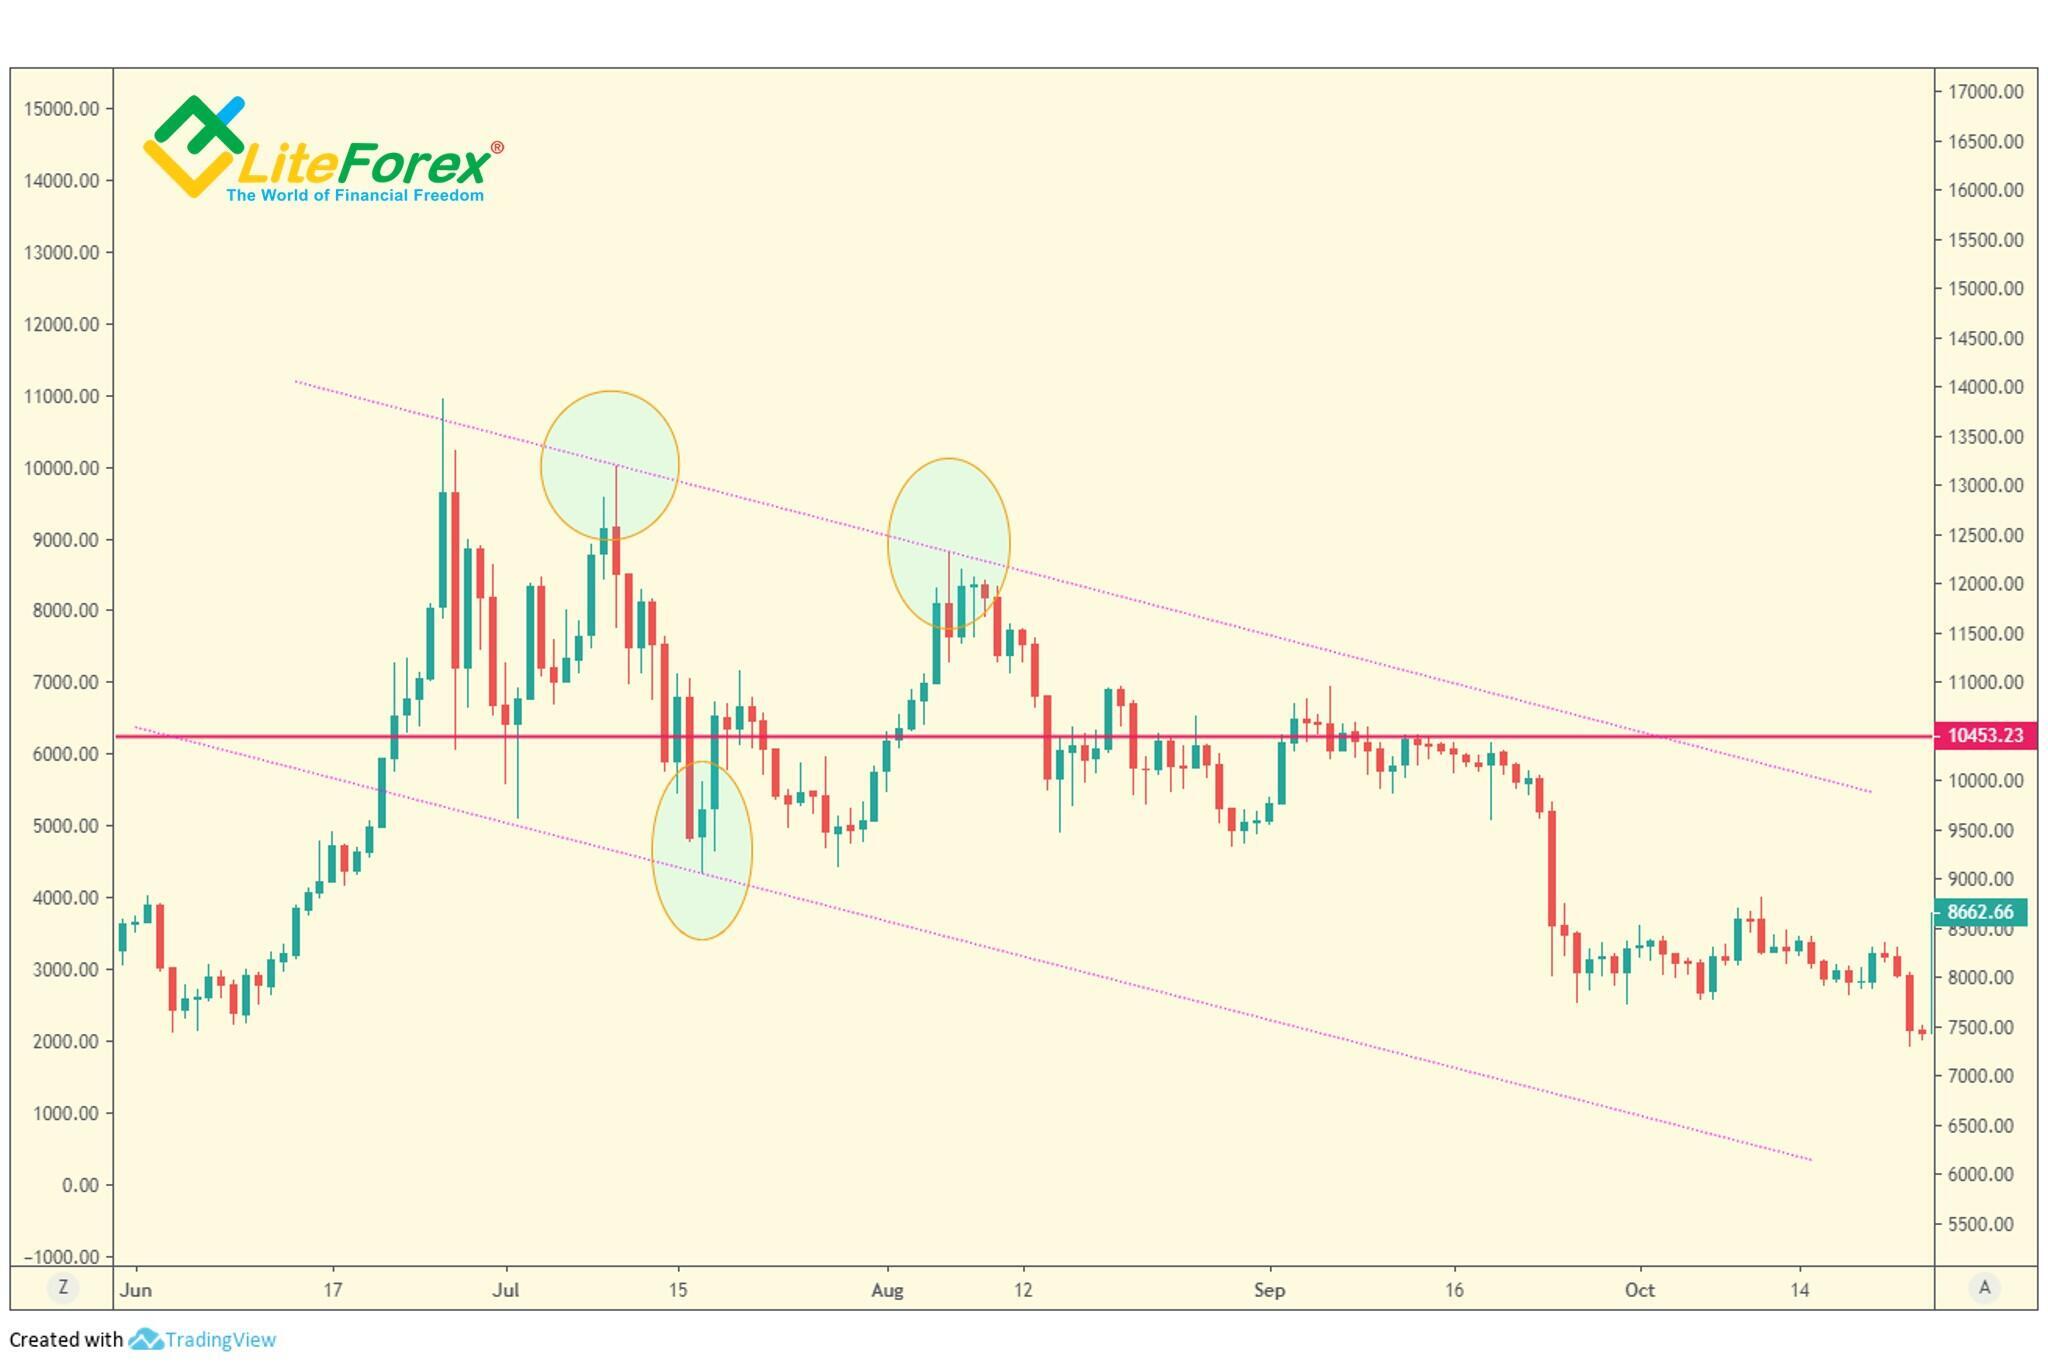
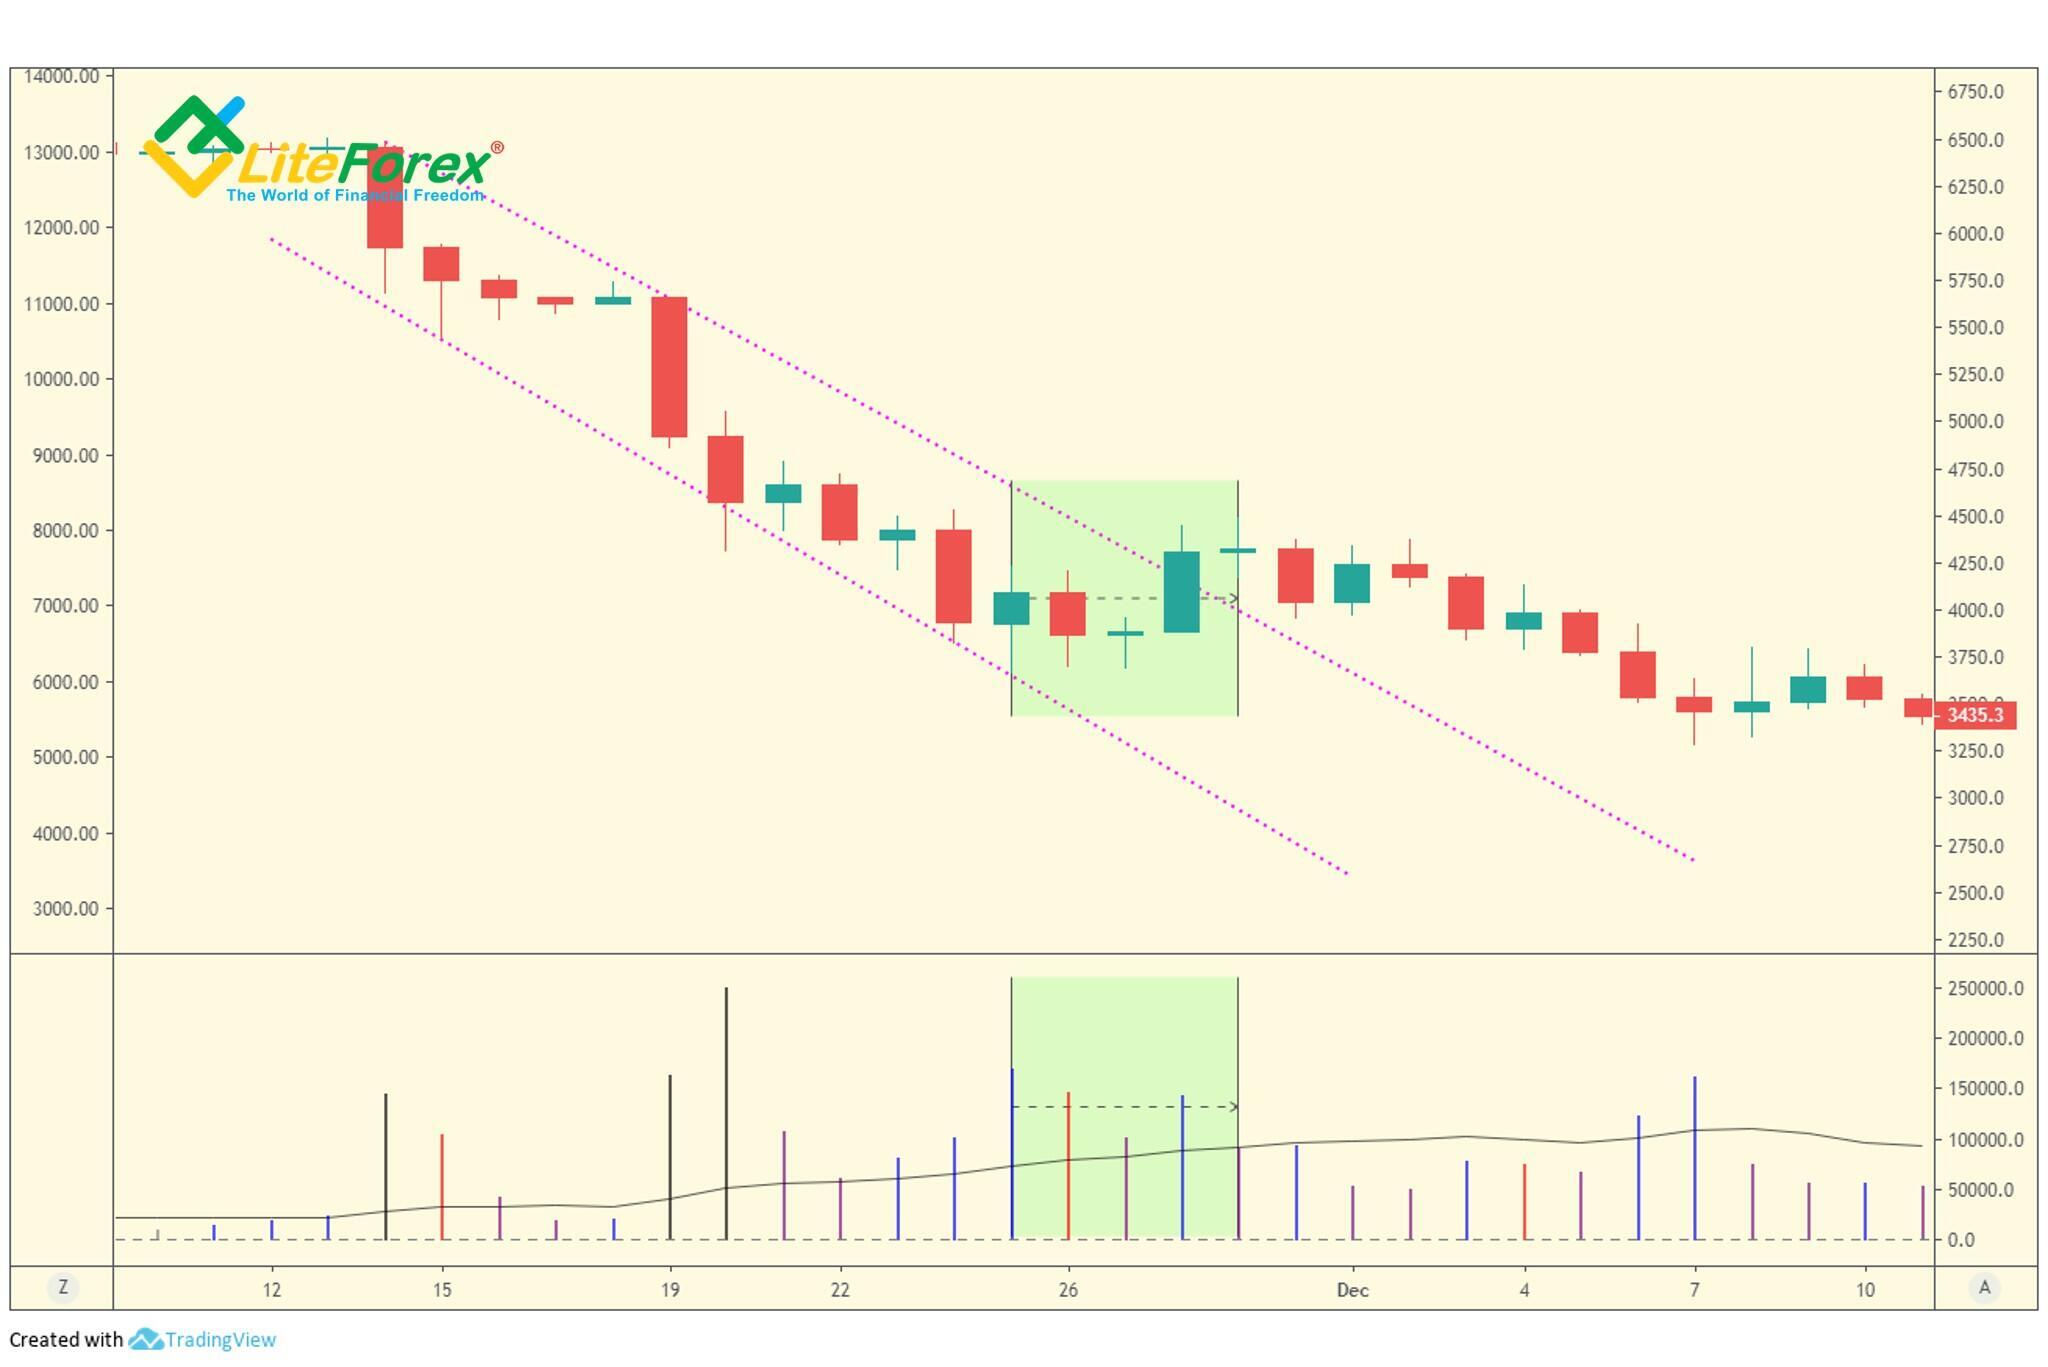
An example of constructing a bearish trend channel. The highs and the low, along which the lines were constructed are circled in the chart.
What trends should be taken into account?
When we look at trends, they are often classified as long-term (major), intermediate, short-term (minor). A long-term trend should be seen as the basis for choosing the trend type. At the same time, the intermediate (middle-term) trend is of excellent use when combined with VSA charting techniques, allowing to determine optimal market events in terms of frequency and intensity.
It makes sense to pay attention to minor trends and counter-trends within overall trends. They will help you identify the most optimal entry point.
In addition, I recommend compare signals discovered in two or more timeframes and make any conclusions only if the signals coincide. This way, your forecasts will be more accurate.
What do price extremes mean?
When you analyze the highs and lows in a trend channel, you learn the following:
- The sign of strength (weakness) is consecutively higher lows (lower highs).
- In addition to rising (lowering) channel’s extremes, the consecutively higher lows for a bullish trend and consecutively lower lows for a bearish trend of each bar indicate that the professional money is supporting the move.
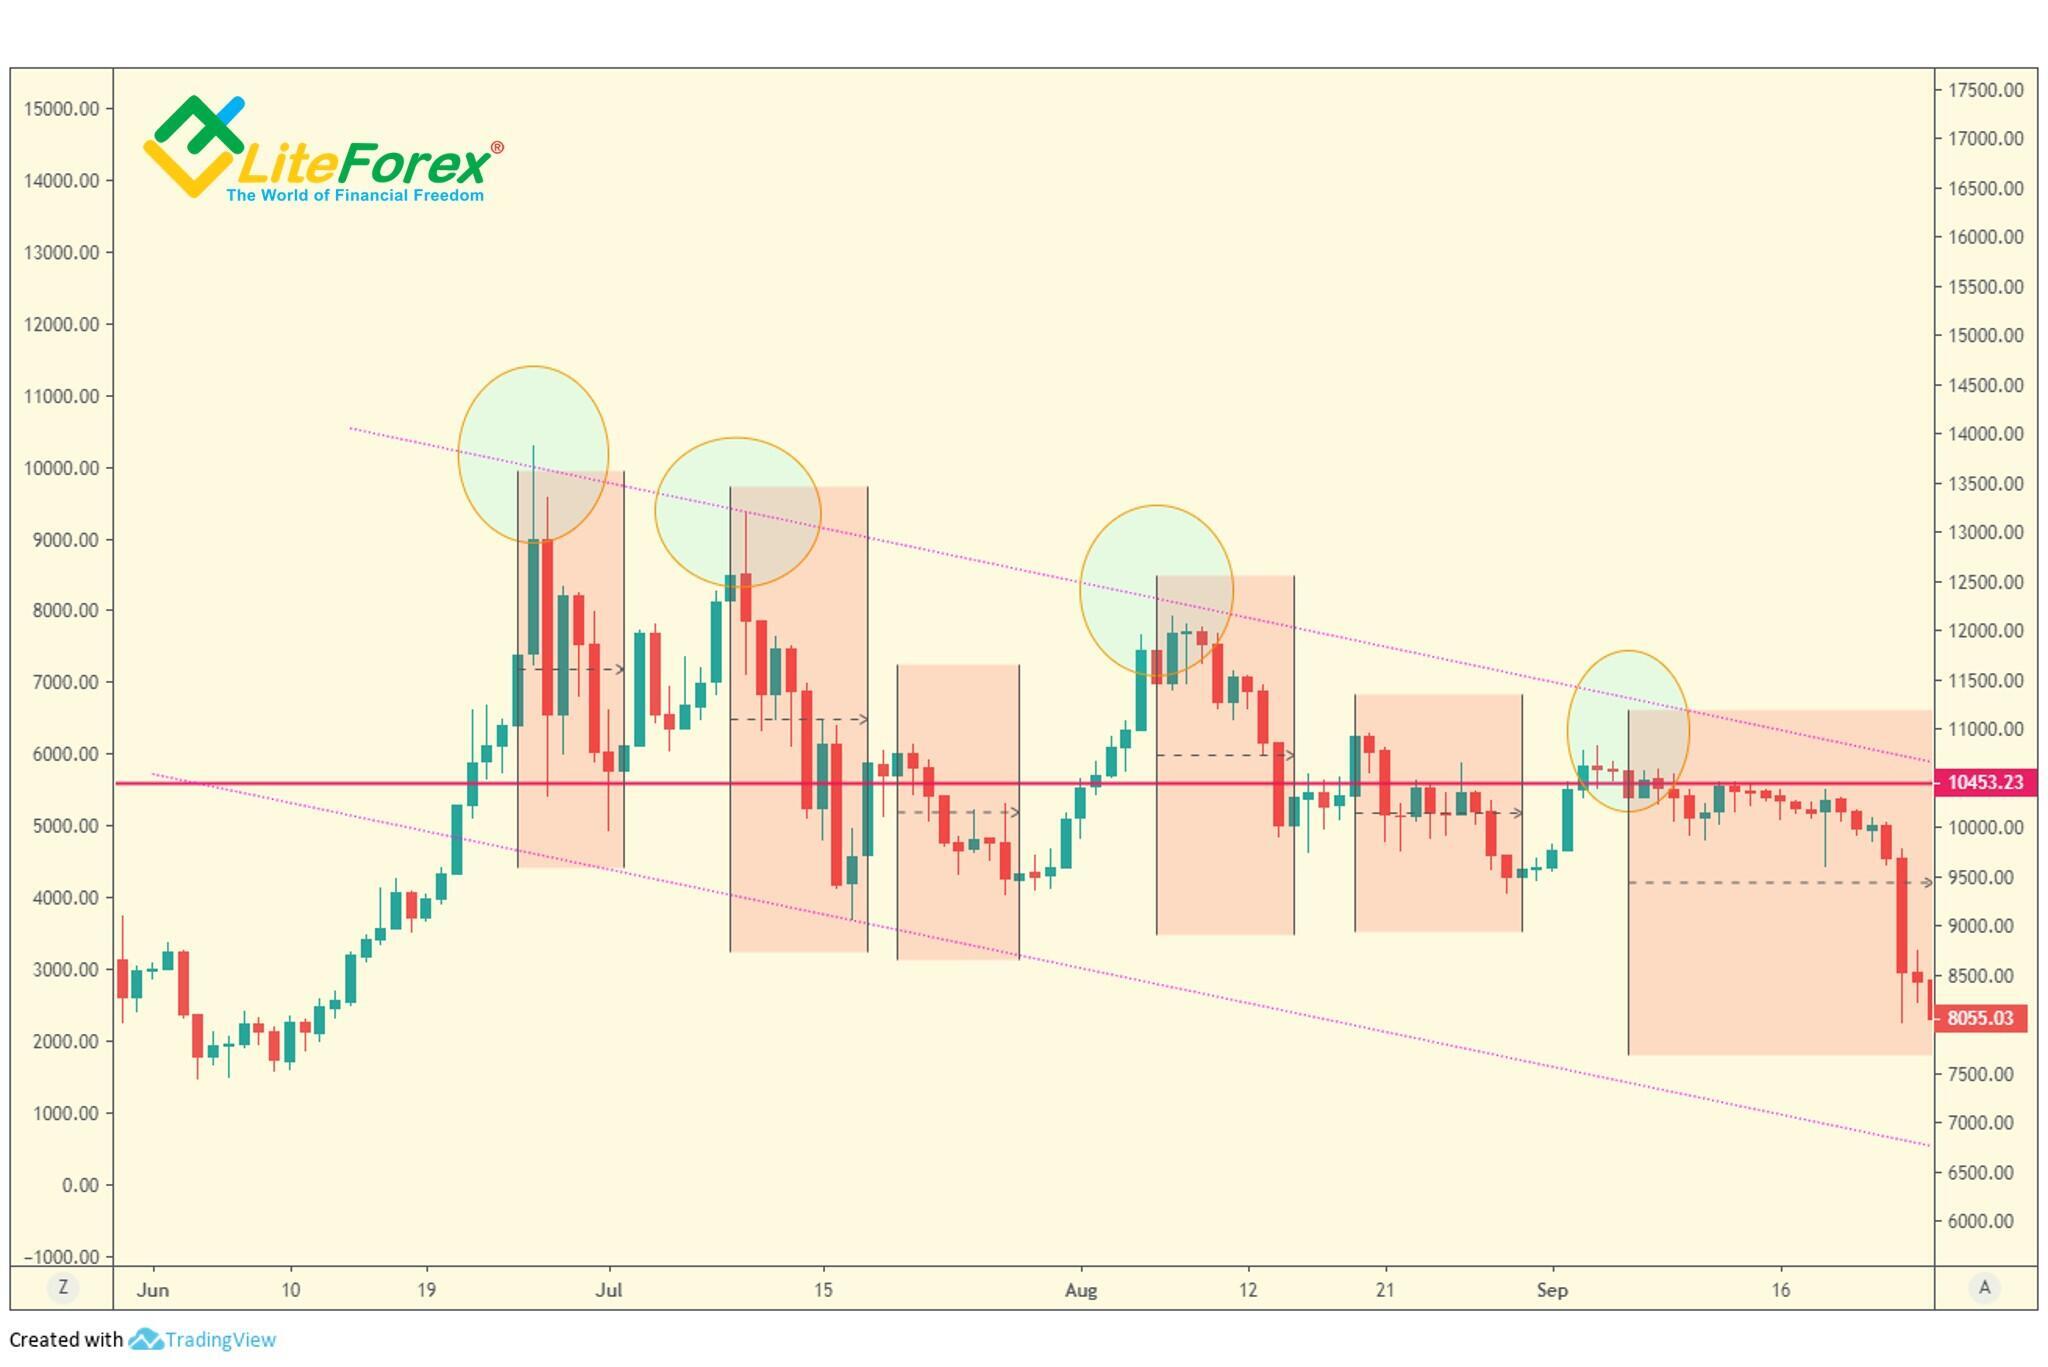
In the above BTCUSD chart, both conditions are met. Consecutively lower tops are circled. Red zones mark the periods when the professional money was supporting the down-move. In this period, the high of each bar was lower than the previous high.
By the way, these rules can be interpreted as the reversal signals. The first lower high in a bull trend or higher low in a bear trend could be considered as an indirect signal of the trend exhaustion.
However, you shouldn’t forget that old trend lines can be used to identify the support and resistance zones. It means that professional traders will have to make an effort to break through these levels, as the market itself tends to follow the path of least resistance. So, if the volume increases when the price is approaching the support/resistance level, this level is likely to be broken out.
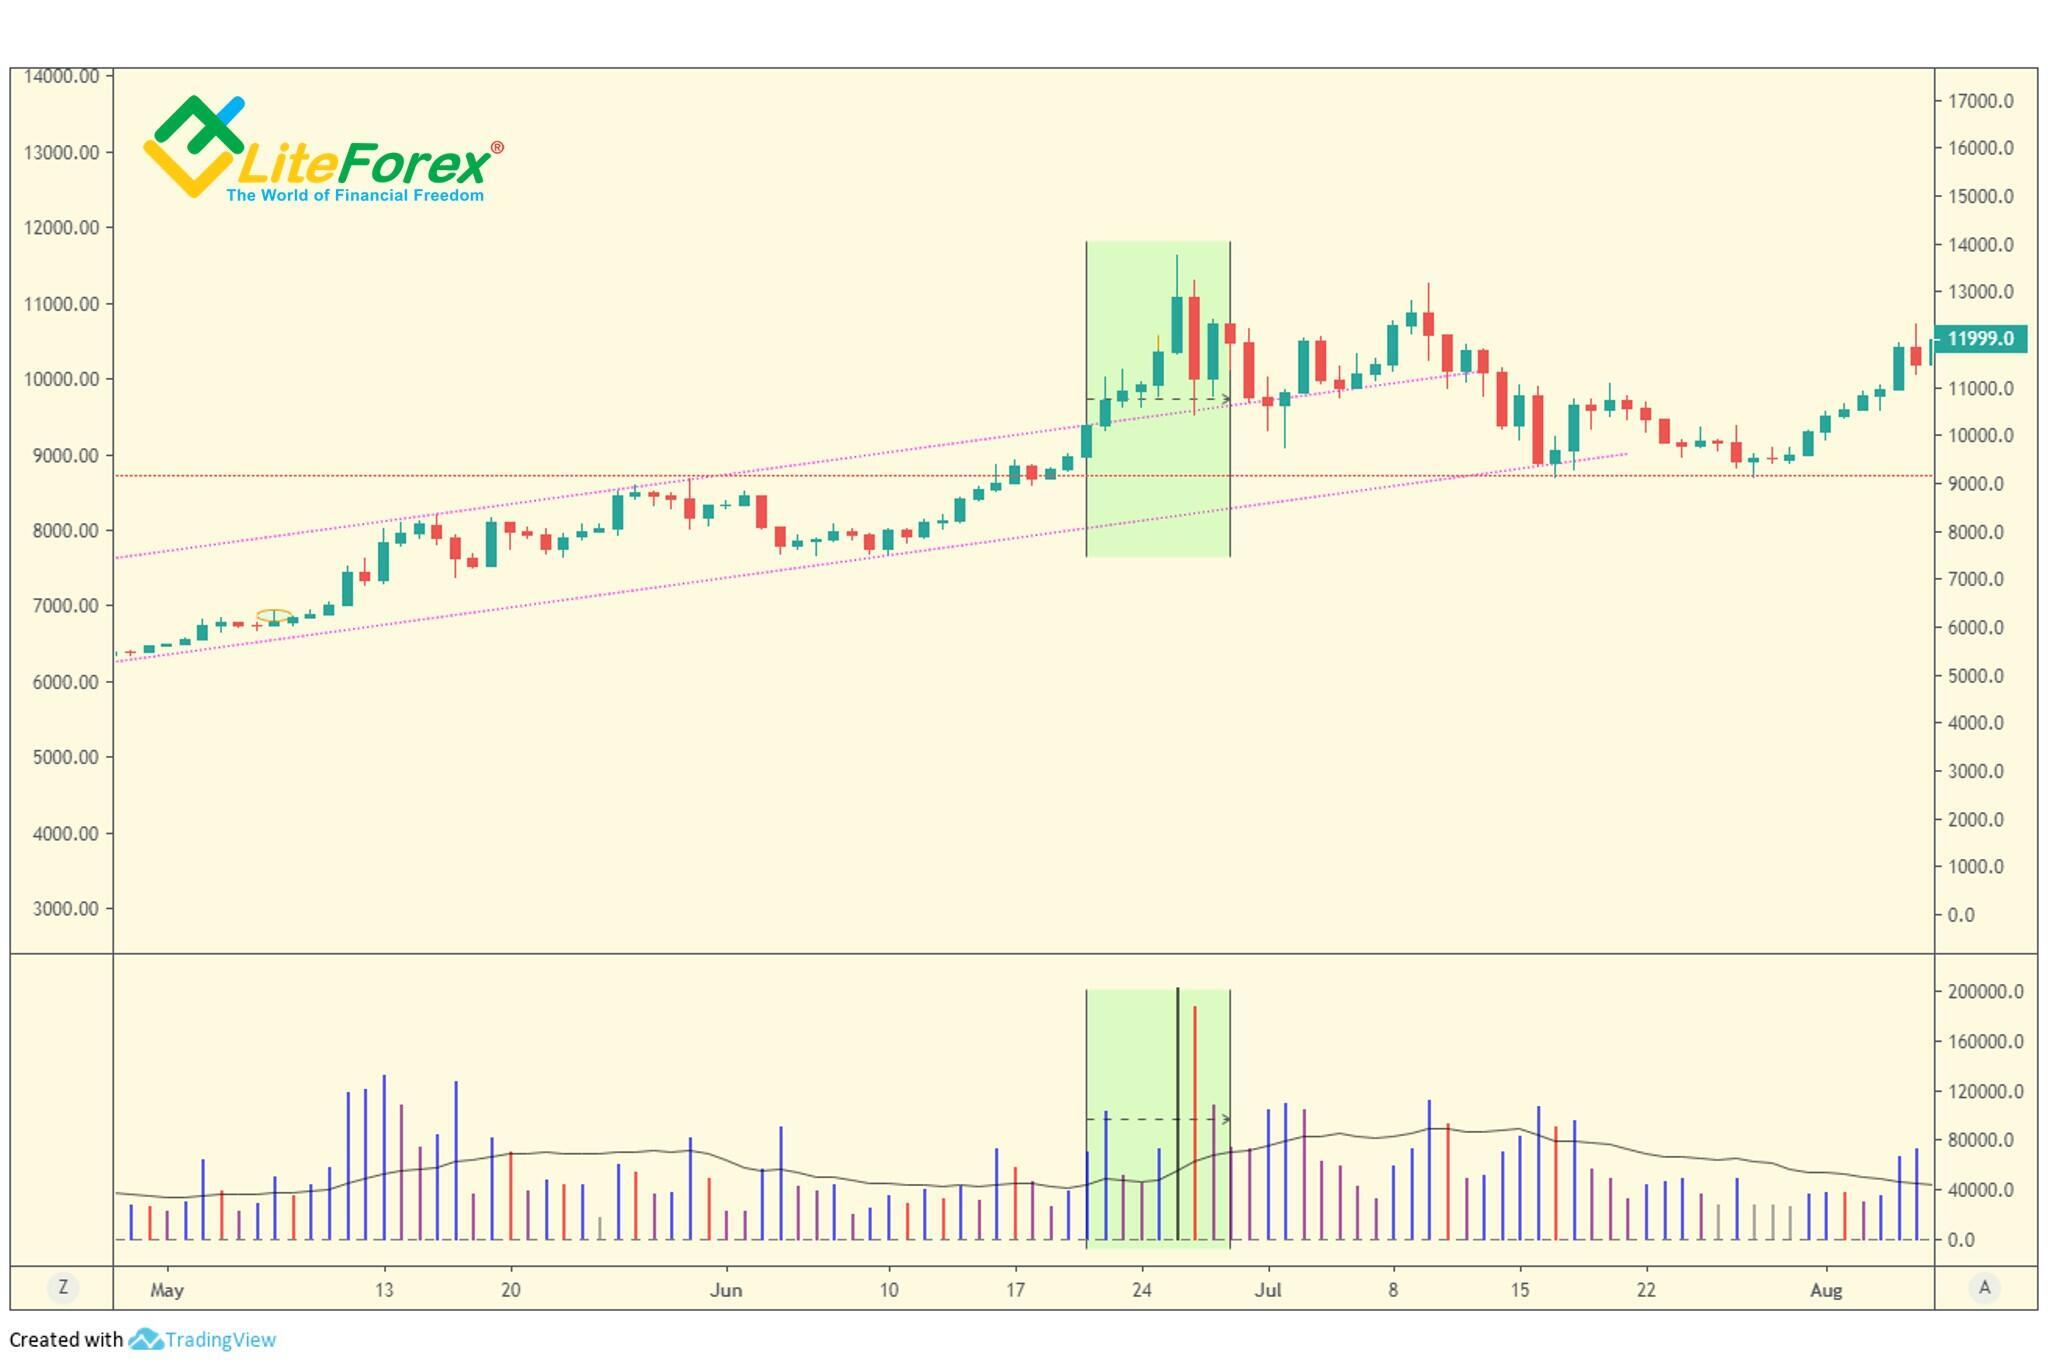
You see form the BCTUSD daily chart that the trend line breakout in the green zone is on the increased volume. When the line is broken out, it doesn’t lose its properties, having an influence from the other side. In a bullish trend, it is a new support level, in the bearish trend, it is the resistance. It means that it takes an effort to break it out from either side.
Trend lines and perceived value
To understand why trend lines are perceived as the support and resistance levels, I will give a simple example. Suppose we have three traders who have been trading the same instrument at the same time.
- The first one bought near the highs and was locked-in when the price suddenly fell. He is now holding out in the hope of reducing his loss.
- The second one bought earlier and sold with a small profit. When he saw the price continue rising, he entered a purchase again and sold when his stop-loss was triggered by the price fall for a small loss.
- The third one shorted and is in profit.
The difference between the imagined traders is that they perceive the value differently:
- The first trader is in a panic. He wants prices to rise so he can reduce his losses. If prices continue to fall, he is going to be shaken out of the market at some stage.
- The second one is not concerned about his money as the overall losses are small. He is out of the market and is looking for a new trading opportunity to enter a long. He expects prices to fall and is waiting for a buying opportunity
- The third one knows what he is doing. He sees the market weakness and has a good short position expecting prices to keep on falling. He has placed a stop-loss order above the market to protect his profits.
This just a case with three traders. In practice, there are many thousands of ways the asset value is perceived. Some are looking for trading opportunities, some are hanging on at a losing trade, some are waiting for a good moment to take the profit. One way or another, they all identify the trend borders. Differently put, perceived values tend to increase in a bullish market and fall in a bearish market. The trend channel is a graphic display of averaged hopes and expectations of the market participants.
Using trend line to determine overbought and oversold levels
The area between the upper and lower trend lines is known as the trading range. The market can be going sideways within the range. In the VSA terms, the (sideways) market is trading within its range and will continue to do so until applied (selling or buying) effort makes it break out.
Using the VSA principles, we shall analyze price action in the top and bottom quarters of the trading range, because important observations take place in these areas. I shall also mention the so-called overbought zone that is above the supply (higher) trend line and the oversold zone that is below the support (lower) trend line. The middle of the range represents the mean of the data. Here there is no vulnerability to a move in any direction
The price move tends to go to the edges of the established trend channel (first to the quarter, then, to the overbought/oversold zone) if there is an imbalance of supply and demand. Besides, when the price goes closer to the edge of the channel, the price is getting more likely to roll back into the old trading range; in the overbought/oversold area, this likelihood increases.
The edges of the trend channel are marked with the purple line in the daily BTCUSD price chart. The red zones mark the bars gone into the oversold area. Besides, when the price touches the bottom, the low volume indicates that professional traders are not bearish, which pushes the price back up into the trading range.
I also want to mention a strange phenomenon that can occur. I have already mentioned that the trend boundary line offers resistance in both directions. So, if the price goes far into the oversold zone, the resistance level becomes the support. And vice versa, in a bear move, the support level now is the resistance to the sellers. Let us see an example.
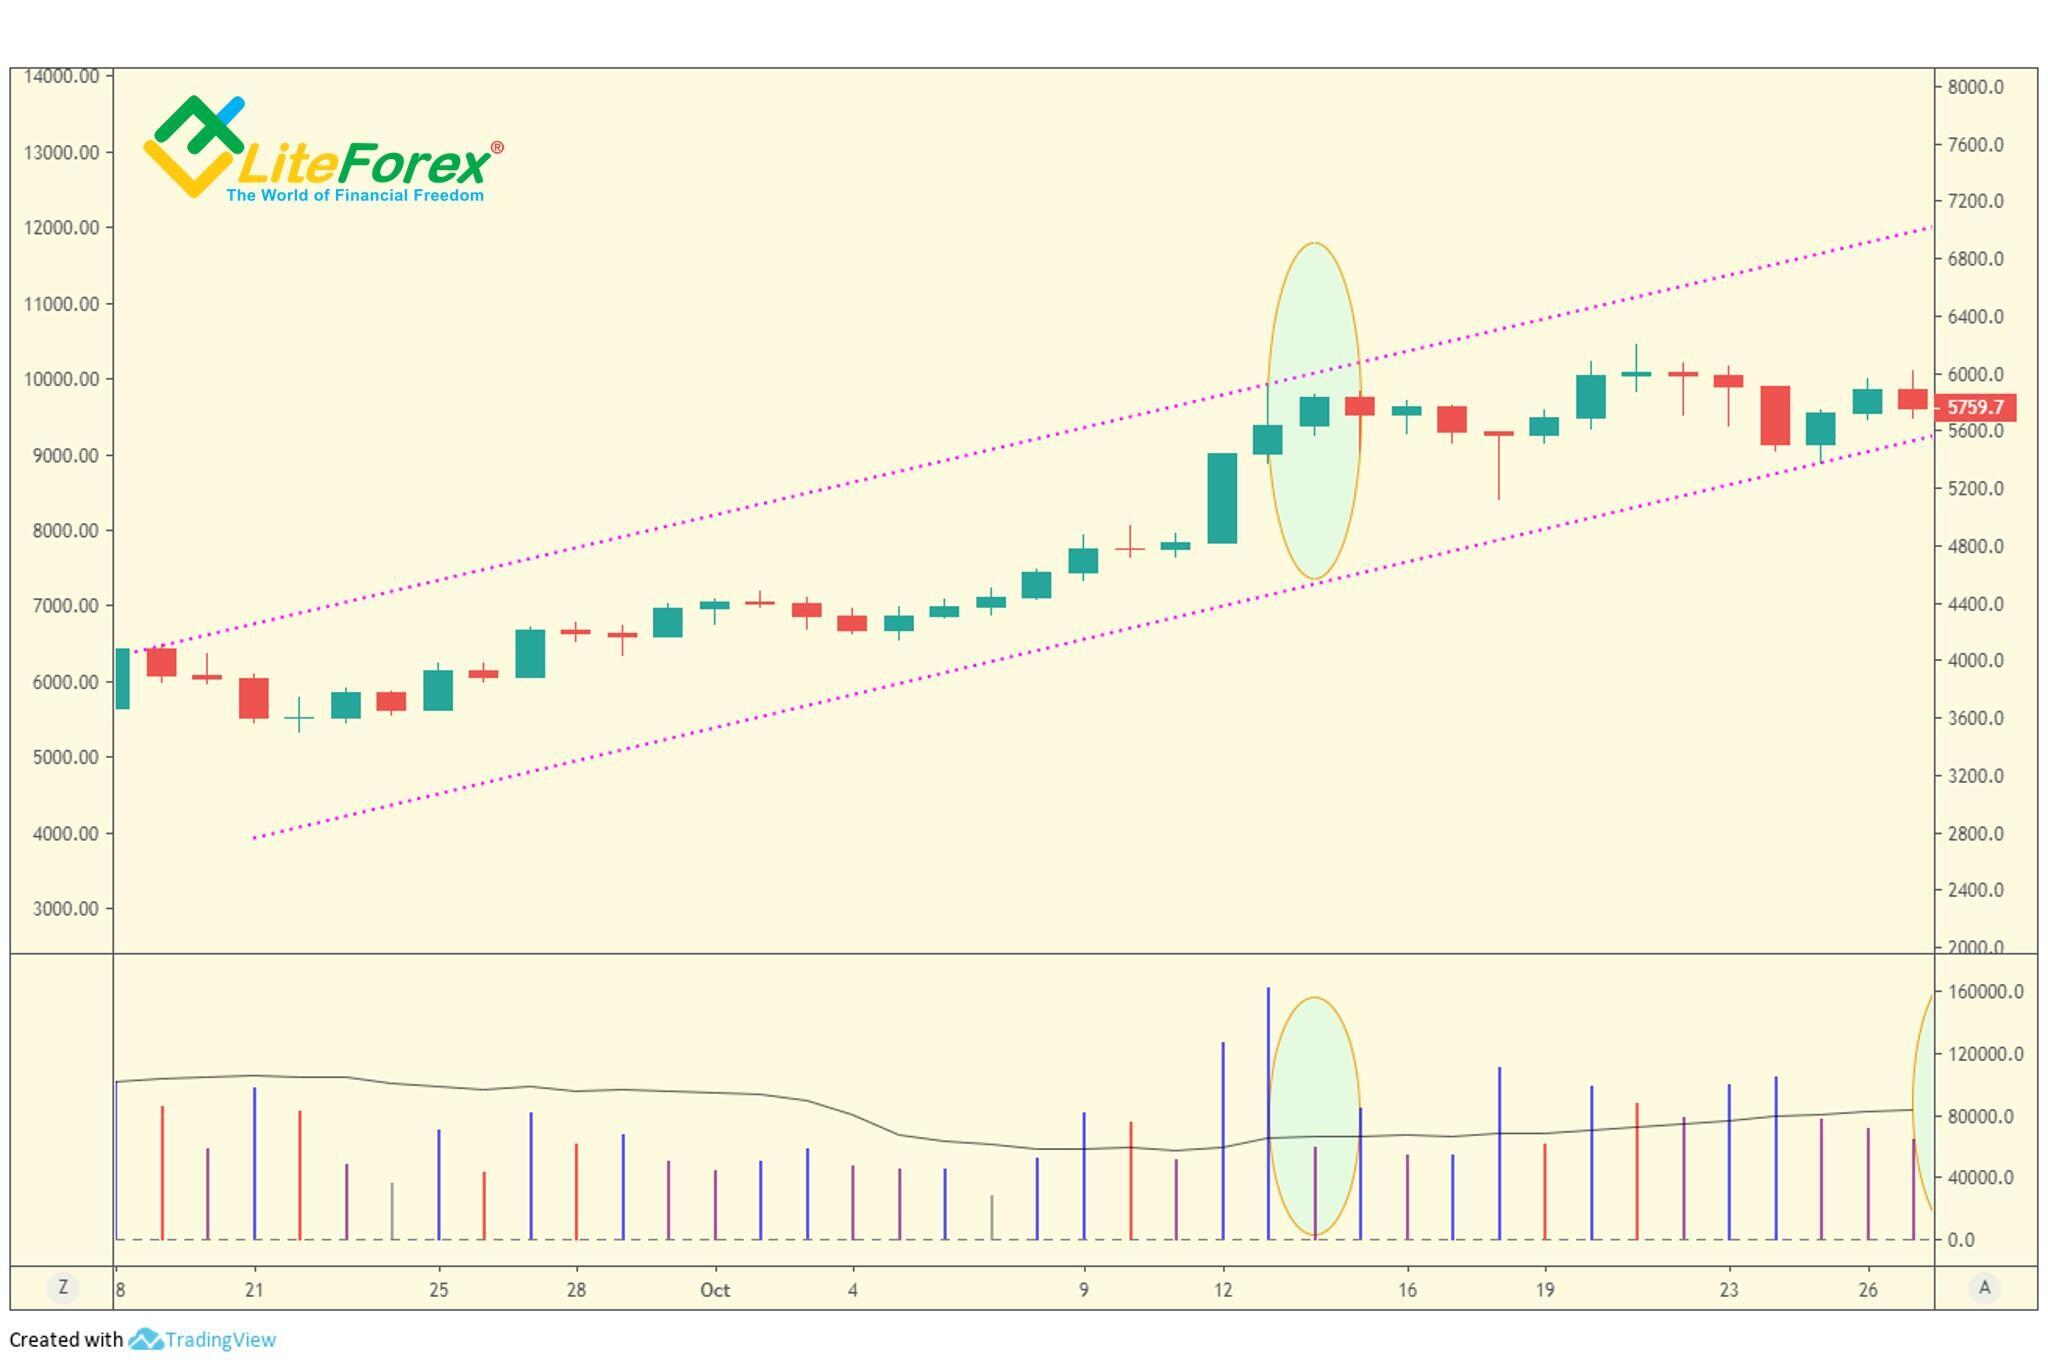
You see from the chart, the price breaks through the resistance line with some increase in volume (marked with the green zone). After this, the resistance level becomes the support. Further, the price with no significant volume continues moving in the original direction only being supported by the new support line. It now will take an effort to break it out downside.
This phenomenon is explained by the action of market-makers or specialists. If there has been an increased effort to go up and through the upper trend line (resistance), most of these professional traders may have taken a bullish view. Now, as the price approaches the line again, this time from the opposite direction, you will still need the effort to break it out downside. However, if the specialists are still bullish, there will be no effort to go back down. This is indicated by low volume when the price is approaching the new support line.
Analyzing volume near a trend line
As I have said many times, it will take professional activity, money, and effort to change the trend. The effort to penetrate trend lines is usually seen as prices approach the line, not actually on the line. Most often, it looks like wide spreads up (or down), with increased volume.
Another way to overcome the resistance is gapping that I described in detail earlier. Price gaps, when there is a big distance between the previous close and the current open, always result from the activity by the market-makers or specialists.
This effort must always be cost-effective. For example, they are unlikely to push up through resistance unless they are bullish. And if the support is broken out, it signals that the professionals are bearish.
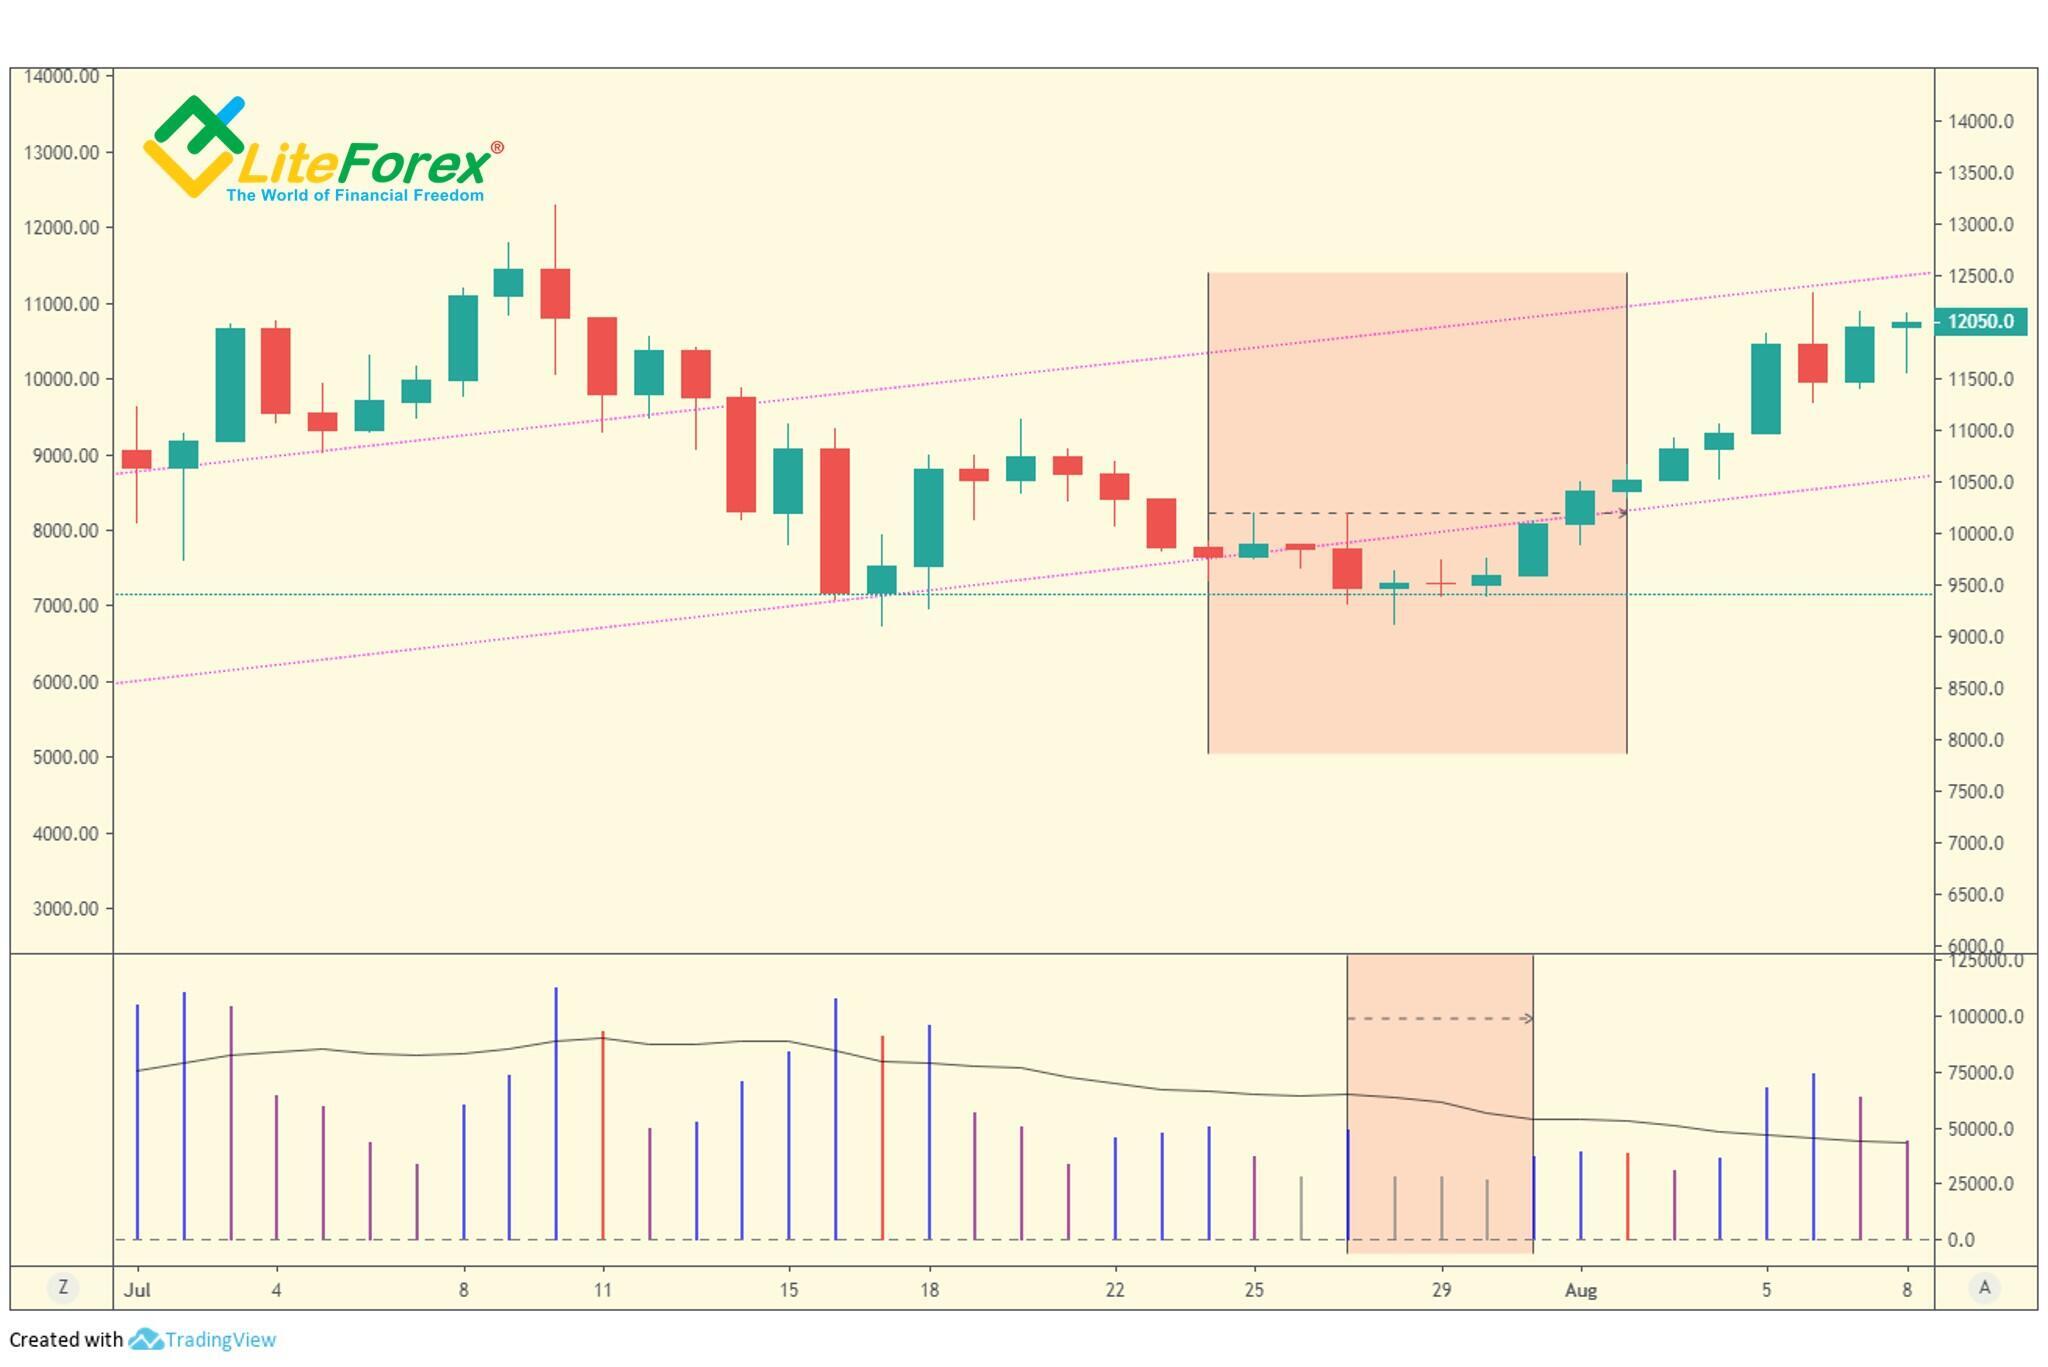
In the four-hour BTCUSD chart, there are two wide spread bars on fairly high volume. Furthermore, the volume starts increasing once the price is just approaching the lower trend line. After the support level is penetrated, the volume shrinks, and, finally, the market goes in the direction of the previous trend. Remember, we have already seen this phenomenon in other examples.
In longer timeframes, for example on a daily or weekly, the increased volume will correspond to the bar that penetrates the trend line. So, shorter timeframes are more convenient to spot the effort when the price is only approaching the trendline.
In some cases, the price moves up in price and reaches the upper trend line, and high volume appears with a wide spread up-bar. But you do not see any results on the high volume by the next day (or bar), the price doesn’t continue growing. In these cases, The high volume must have contained more selling than buying, which, of course, doesn’t support the up-move. In a down-move, the high volume results from more buying than selling in these cases. To avoid great losses, you should carefully track the price moves and immediately close the position, if the trend is not confirmed on the next bars.
Pushing through resistance/supply levels
If you observe a wide spread up-bar, on high volume, breaking through the top of a trend channel (resistance line), and the next day it is around this level or even higher, then you would now be expecting higher prices. Any low volume down-bar next day (meaning a potential test) will confirm this view. The rule works in the opposite direction as well. If there is a wide spread down-bar breaks through the lower trend line (support level) on high volume, and the next day it is around this level or even lower, then you would now be expecting lower prices in the bearish trend.
The bar that punches the upper or the lower trend line represents pushing through the level.
The chart displays the wide spread up-bar (marked with a circle), on high volume, breaks through the lower trend line. I want to focus again that the volume is high. The next bar is also down, and the volume is still high. It means that market-makers are bearish, so, the price will hardly roll back to the trading range, at least in the short run.
Moving towards resistance and support
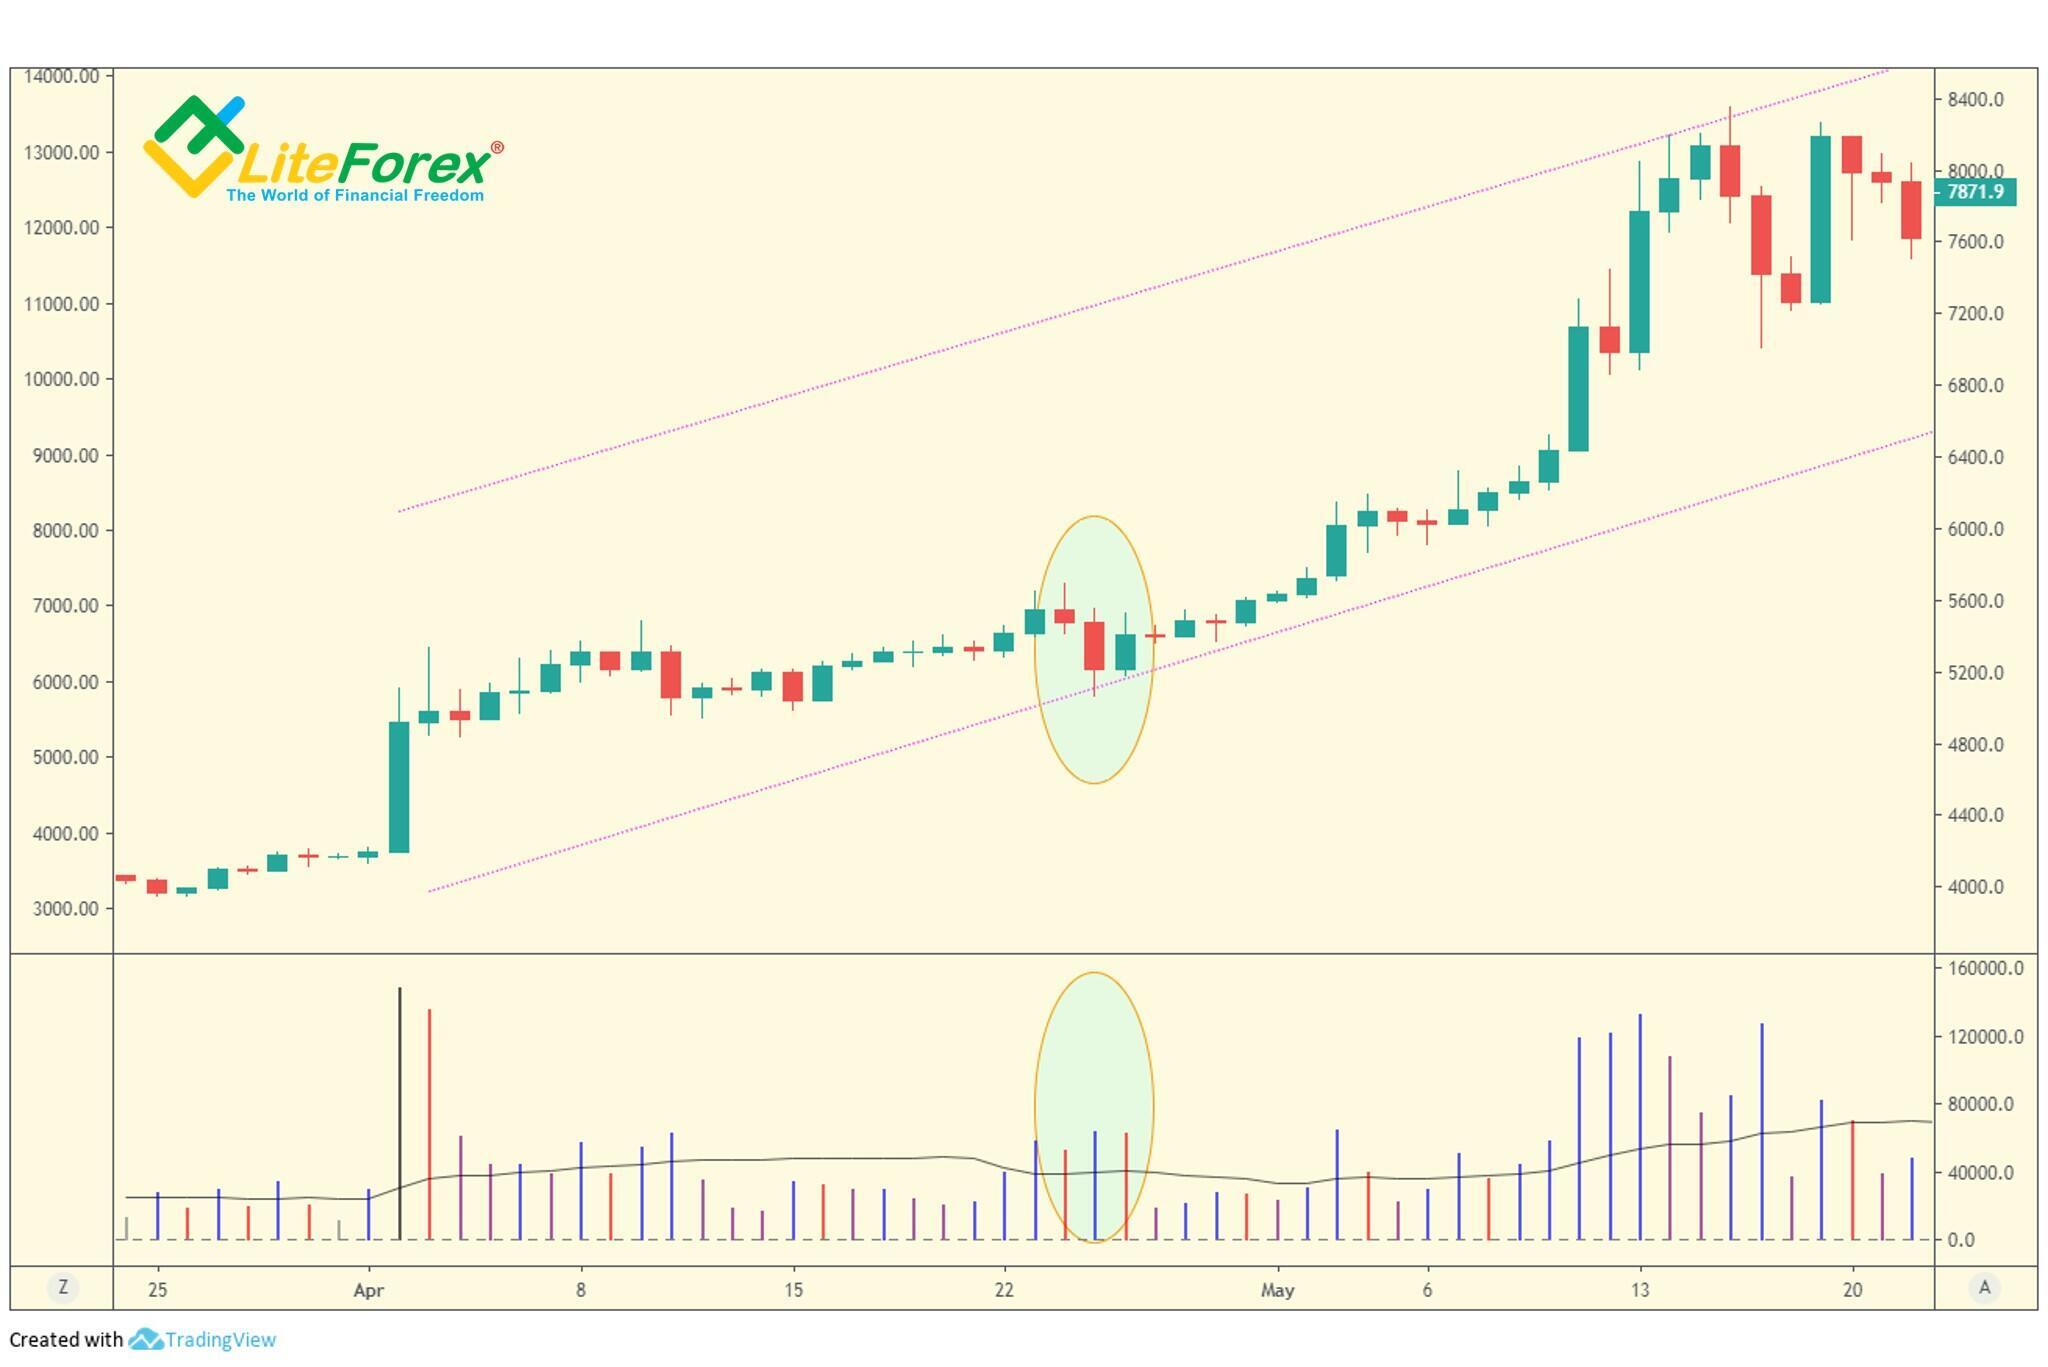
If a wide spread bar, on low volume, approaches the resistance level but doesn’t break it through, the price is likely to be trading in the previous trading range in the short run. This pattern may also signal the sideways trend.
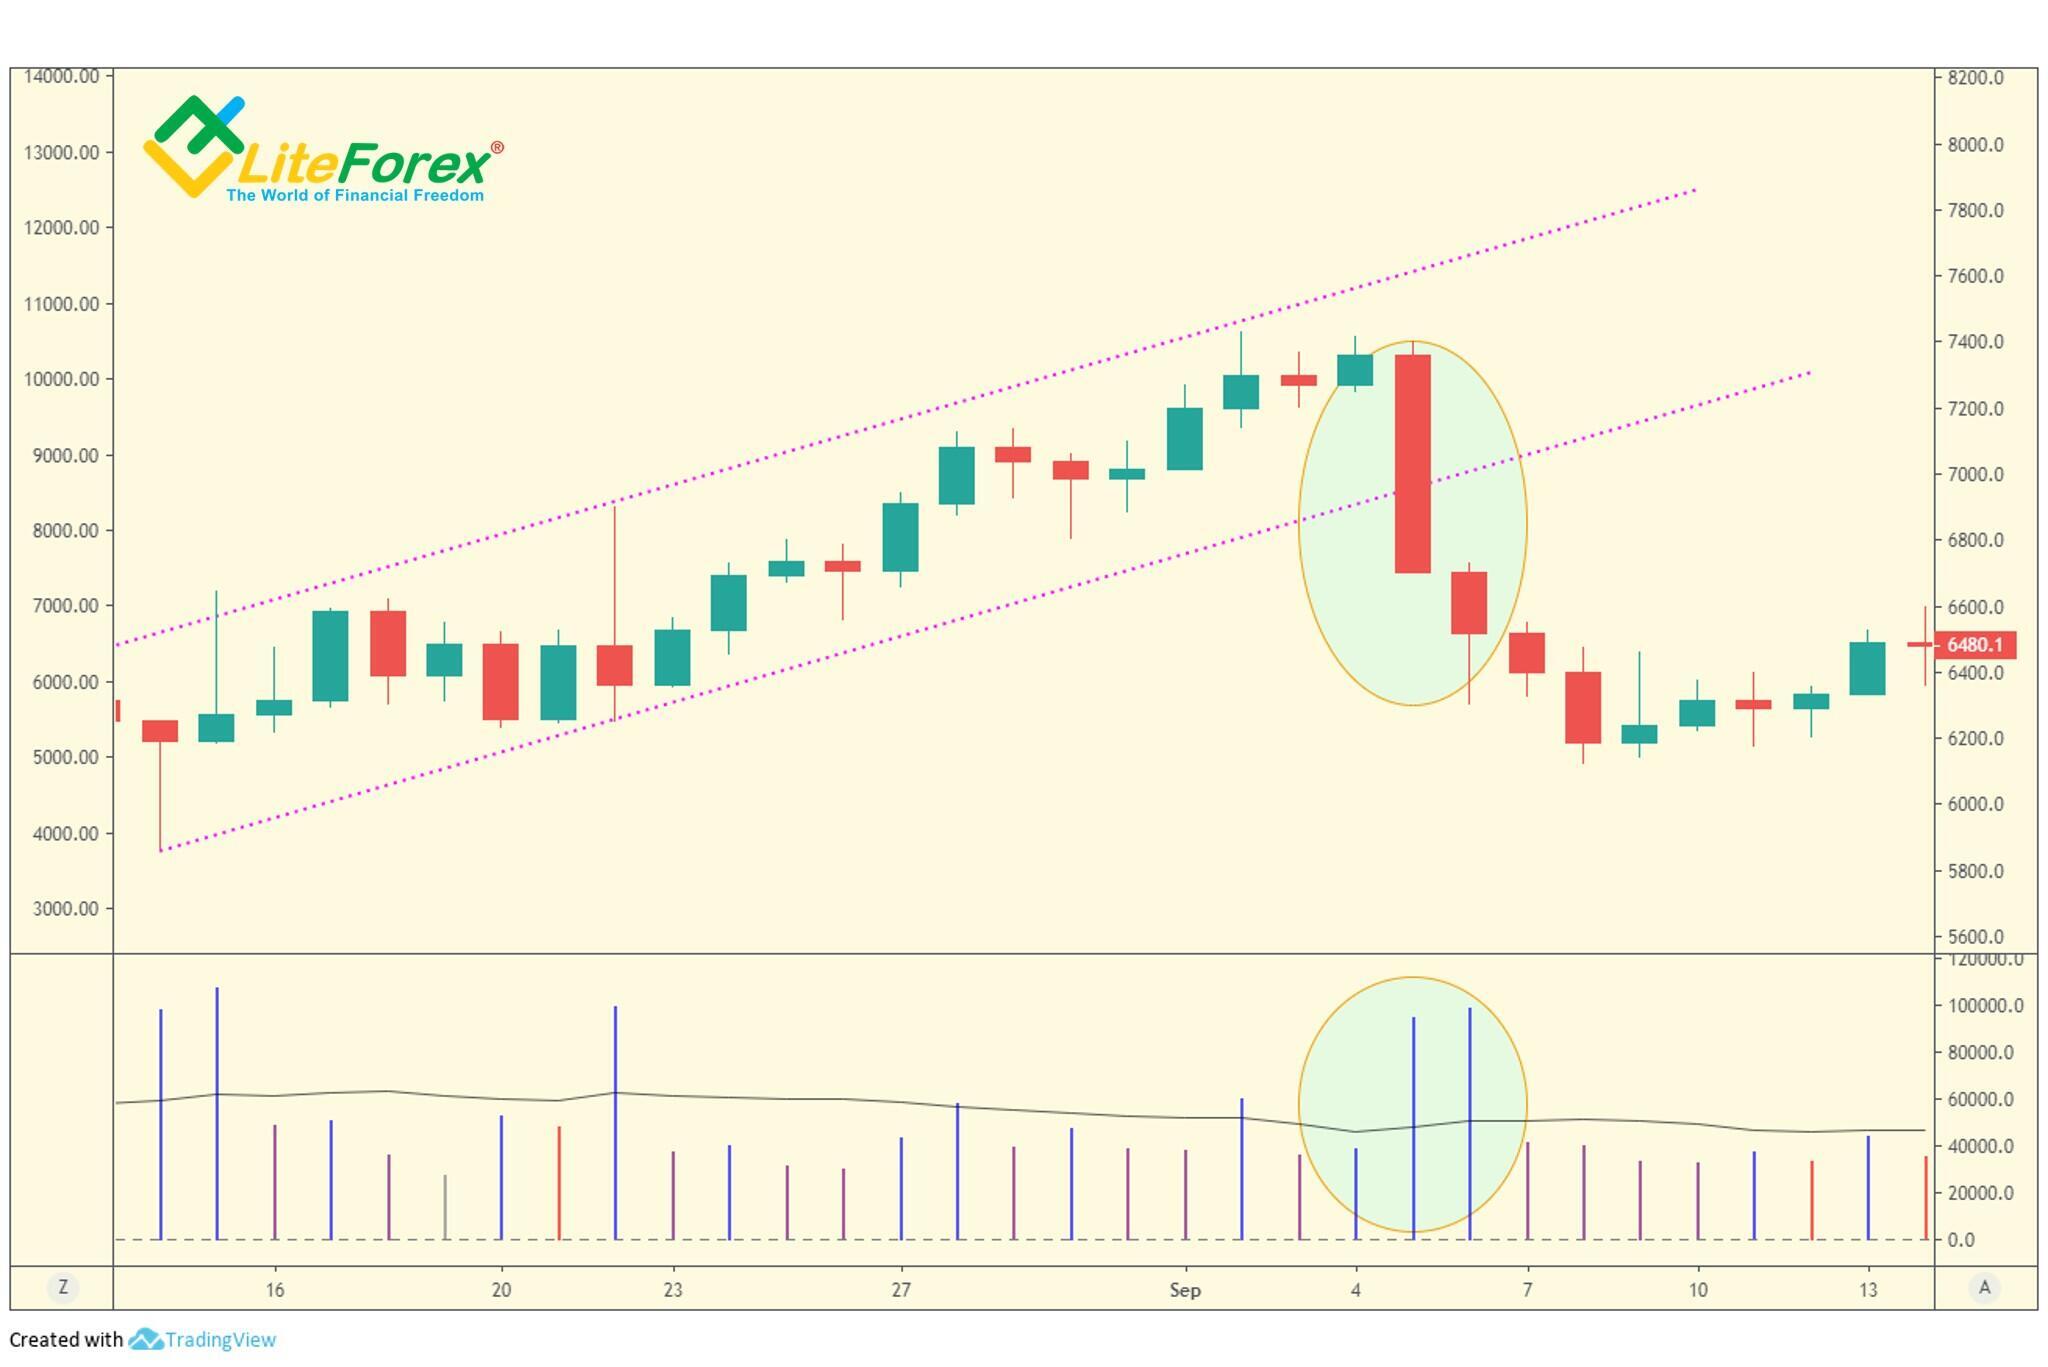
In the BTCUSD chart, two wide spread bars on high volume are driving the price near the upper trend line. It is followed by the third bar (marked with the oval zone), that very closely approaches the resistance level and closes in the upper quarter. This bar is on low volume, which means that the professionals are not bullish now.
Next, the price rolls back to the middle of the trend channel (in the previous lesson, the VSA principle, “effort versus results”). Summing up, all this indicates that there is not enough effort (i.e. buying) to break through the resistance. Therefore, the price should be trading within the trend channel.
The same is with the bear move. In a down-move, where the price is getting close to the lower trend line (Support Line), any low volume appearing will tell you that there is not enough selling effort to break through the line.

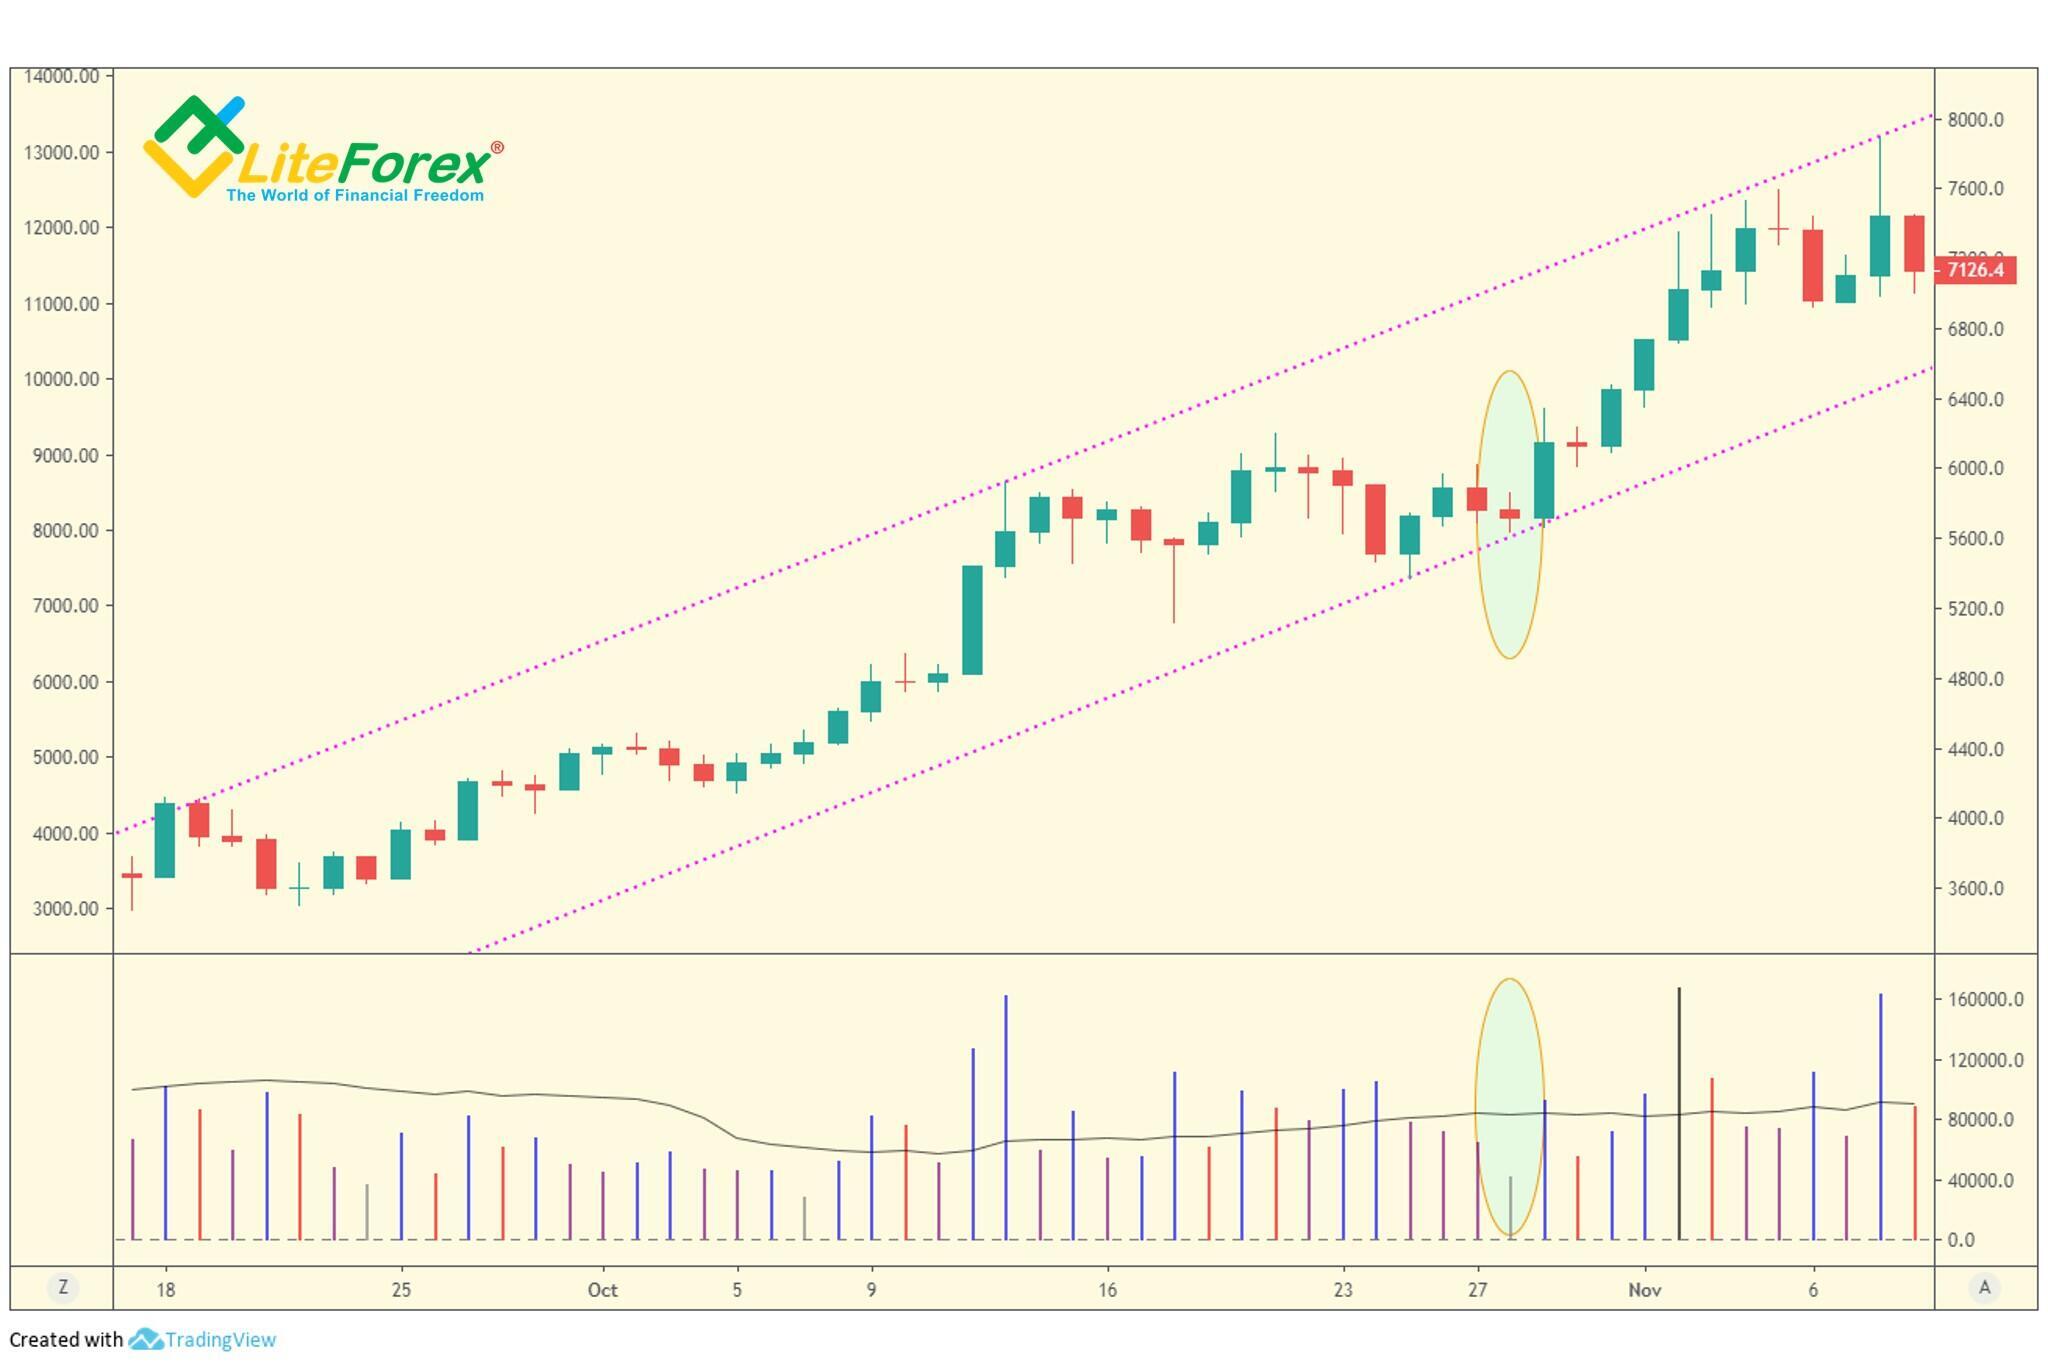
A few days after the studied example, the price is approaching the support line (marked with an oval in the chart). However, the spread is narrow, and the volume is low, so there should be no effort to push through the lower trend line.
Absorption volume and lower trend line
High volume on a down-bar, as it nears or touches the lower trend line usually indicates that there is strong selling pressure, and the price can potentially go outside the trend channel. But, if the price is up on the next day, it must show that the high volume down-bar contained buying. This is the so-called absorption of the selling, which is the signal of the market strength.
However, before a proper rally takes place, you will still need a phase of accumulation featured with low volume. The longer time it takes, the stoner up-momentum will receive the market.
Oval zone marks the down-bar that approaches the lower trend line on high volume. It is followed by an up-bar accompanied by comparable effort. This indicates the absorption volume that next develops into the accumulation phase with fairly low volume. After this phase finishes, the professional activity surges and there is a strong bear move.
This all for today.
In the next lesson, I will deal with the anatomy of bull and bear markets and will introduce the trend clusters. Subscribe to the trader blog and be on top of crypto trading!
I wish you good luck and good profits!
P.S. Did you like my article? Share it in social networks: it will be the best "thank you" :)
Useful links:
- I recommend trying to trade with a reliable broker here. The system allows you to trade by yourself or copy successful traders from all across the globe.
- Use my promo code BLOG to get a 50% deposit bonus on the LiteFinance platform. Simply enter this code in the appropriate field when funding your trading account.
- Telegram chat for traders: https://t.me/litefinancebrokerchat. We are sharing the signals and trading experience.
- Telegram channel with high-quality analytics, Forex reviews, training articles, and other useful things for traders https://t.me/litefinance
Price chart of BTCUSD in real time mode
The content of this article reflects the author’s opinion and does not necessarily reflect the official position of LiteFinance broker. The material published on this page is provided for informational purposes only and should not be considered as the provision of investment advice for the purposes of Directive 2014/65/EU.
According to copyright law, this article is considered intellectual property, which includes a prohibition on copying and distributing it without consent.