Develop your trading system using the combination of popular technical analysis trends
Both VSA and Price/Action help traders read the market: understand big players’ intentions and suppose how these or those quotes will behave in the future, based on popular patterns. If we combine the methods of these technical analysis types, we may get quite an efficient trading system. As it’s grounded on logic and not on a thoughtless compliance with trading signals, it allows turning trading into a creative process. That we may and should enjoy.
Pattern 1-2-3. Some like it, some hate it. This pattern turns up in the market so often that the attempts to make use of the signals it produces can easily turn you into a scalper. As a result, traders start applying various filters, including indicators and Fibonacci levels that are supposed to boost the trading efficiency. In fact, the best solution would be observing the behaviour of big players near the extremums of the 1-2-3 pattern.
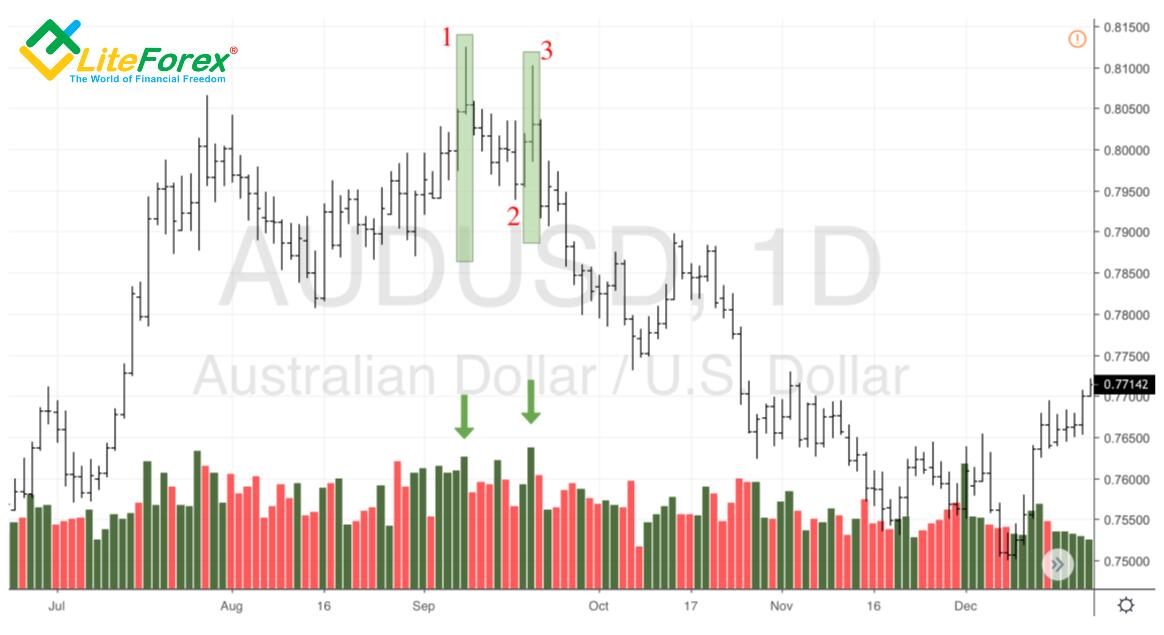
For example, two upthrusts at once (bars with a large spread and closure in the lower part of the trading range) appeared in points 1 and 3 in the daily chart of the Australian dollar. They both were marked by a big volume, which allowed detecting a big seller. The classical approach to the 1-2-3 pattern implies that the bulls’ inability to restore an uptrend signals their weakness. The bears take the initiative. If at the same time VSA points to the presence of sellers, it’s time to make a trade!
1-2-3 pattern in AUD/USD chart
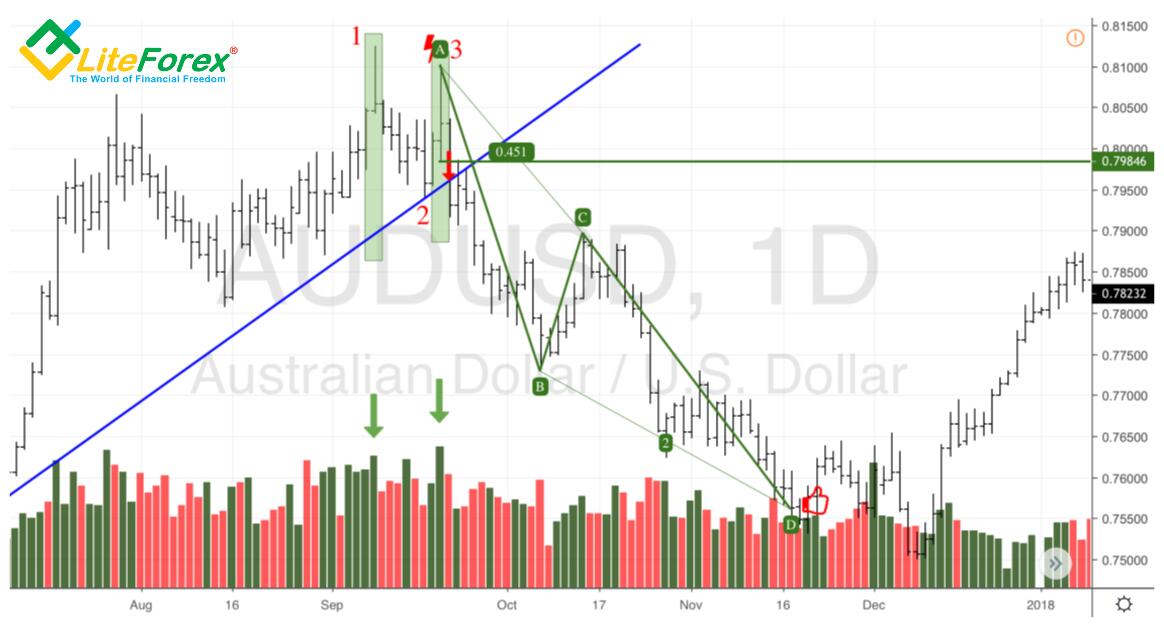
As a rule, short positions are opened at the breakout of a short-term diagonal support. However, considering the trading peculiarities of the VSA method, one can go short in a more aggressive way using a pending order placed at the lowest of the second upthrust. According to the classical approach, a protective stop-loss order should be placed near the maximum of point 3. Take Profit is calculated considering 200% target of the AB=CD pattern. In case of AUD/USD, the strategy’s profit factor was 4 to 1.
Strategy of work using 1-2-3 pattern in the AUD/USD chart
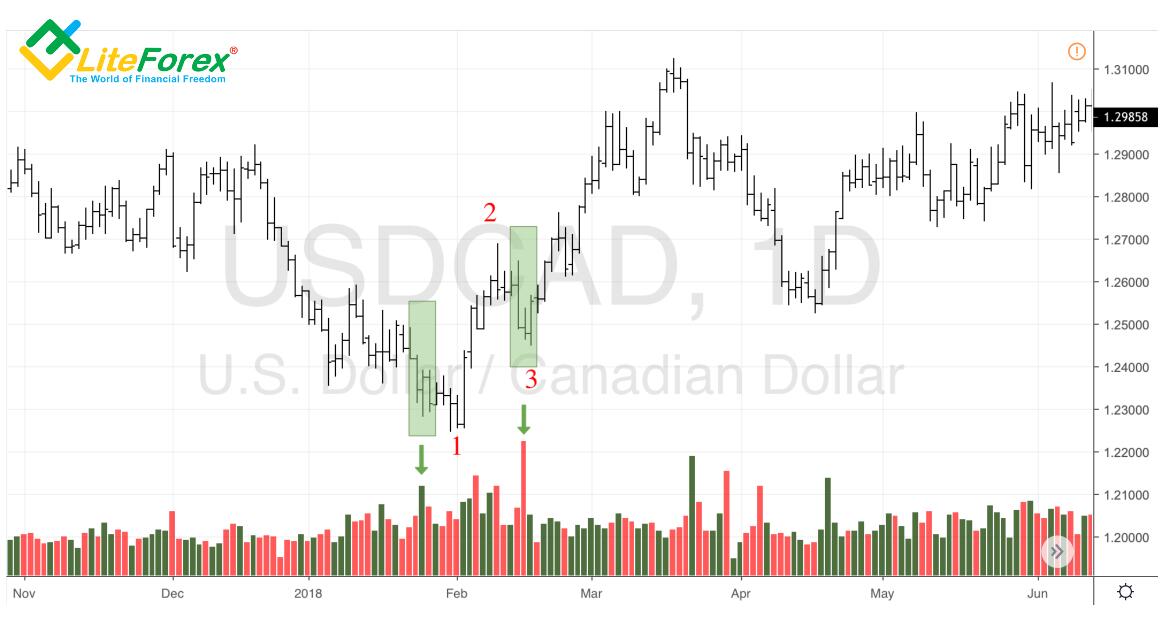
In the example of the downtrend reversal for USD/CAD, the first alarm for the bears was a reverse upthrust under increased volumes. It pointed to big players’ desire to start buying the USD against the CAD. Later on, points 1 and 3 of the 1-2-3 pattern were formed. A bar with a narrow range and a high volume appeared near point 3. It usually means that buyers aren’t willing to let the initiative go. Their active resistance signals bears’ strong intention to reverse the downtrend.
1-2-3 pattern in USD/CAD chart
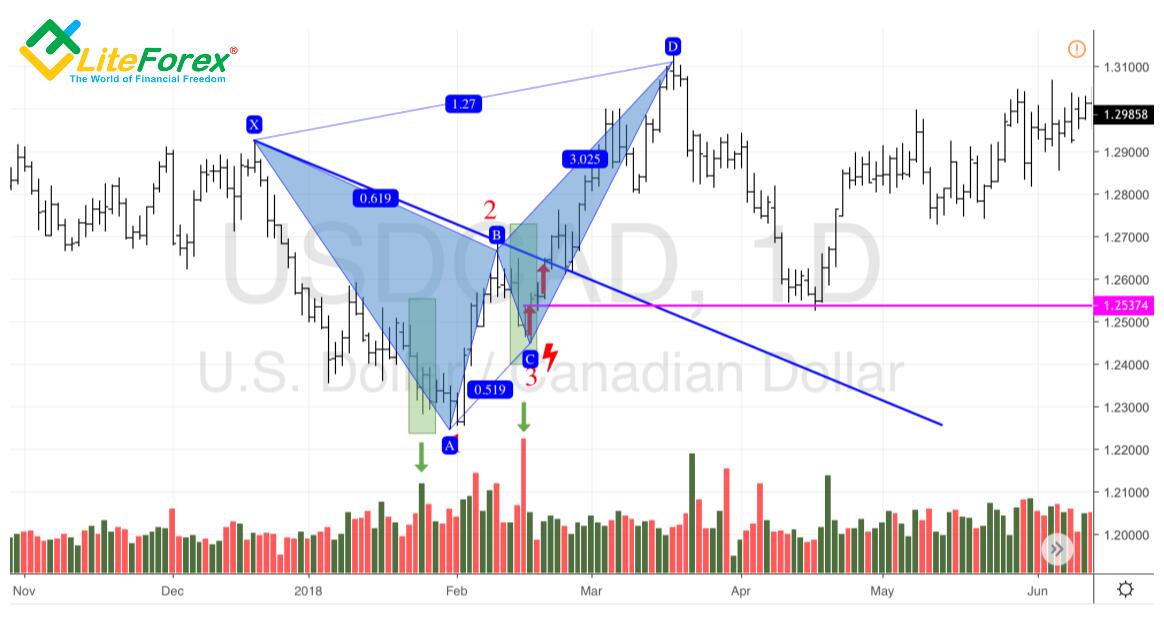
Having read the market, one can start forming their trading strategy. Long positions are relevant at the breakout of a diagonal resistance or at the maximum level of the bar that signalled big players’ intention to fight till the end. A protective stop-order is placed at the fluctuation minimum in point 3. Closing should be done according to the harmonic trading principles: once the target at 127.2% has been reached (Butterfly pattern).
Strategy of work using 1-2-3 pattern in the USD/CAD chart
Thus, the combination of such trends of technical analysis as indicator-free trading and VSA allows traders to deeper understand the market without having to use incomprehensible filters for finding the best trade. All you need for efficient trading can be found in price and volume charts.
P.S. Did you like my article? Share it in social networks: it will be the best "thank you" :)
Useful links:
- I recommend trying to trade with a reliable broker here. The system allows you to trade by yourself or copy successful traders from all across the globe.
- Use my promo code BLOG to get a 50% deposit bonus on the LiteFinance platform. Simply enter this code in the appropriate field when funding your trading account.
- Telegram chat for traders: https://t.me/litefinancebrokerchat. We are sharing the signals and trading experience.
- Telegram channel with high-quality analytics, Forex reviews, training articles, and other useful things for traders https://t.me/litefinance
Price chart of AUDUSD in real time mode

The content of this article reflects the author’s opinion and does not necessarily reflect the official position of LiteFinance broker. The material published on this page is provided for informational purposes only and should not be considered as the provision of investment advice for the purposes of Directive 2014/65/EU.
According to copyright law, this article is considered intellectual property, which includes a prohibition on copying and distributing it without consent.