Let’s continue studying the peculiarities of using the “Two graphic pattern screens” trading system
Having reached the convergence zones detected through harmonic trading isn’t a mandatory condition for using the Two graphic pattern screens system. If you use “price action”, understand the advantage of trading on 2 timeframes and are psychologically ready to put into practice such a golden rule as “keep losses low, let profits grow”, you’ll always find a way to enter the market efficiently.
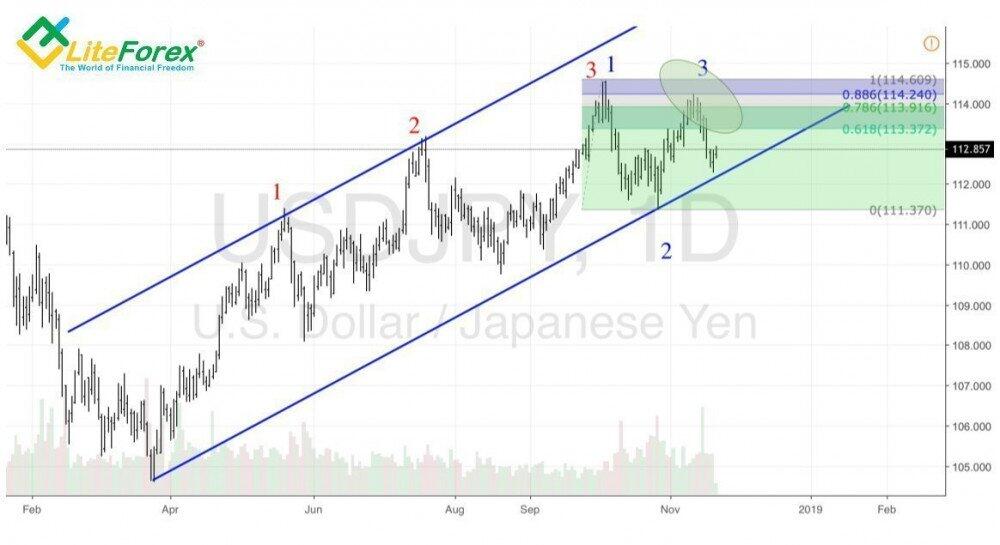
One of my previous articles was devoted to the explosive mixture of the Three Indians and 1-2-3 patterns that predicts a reversal with a high probability. Let me remind you that harmonic trading is based on the principle of a highly probable price movement direction change once the convergence zone is reached. It allows combining the two methods and enlarging the limits of applicability of the “Two graphic pattern screens” trading system. If you’re waiting for the above mentioned combination to form on daily charts, draw attention to a shorter timeframe and start looking for an entry point in case of confirming signals.
Bulls’ inability to move USD/JPY quotes above 88.6% of the wave 1-2 of the 1-2-3 pattern was the first sign of their weakness. Considering three Indians formed earlier, one could suppose that the yen is ready for a reversal against the USD and switch to a shorter time frame. In general, as my experience has proved it, the assault of 78.8% and 88.6% levels is an important event for detecting the bulls/bears ratio.
Three Indians and 1-2-3 on USD/JPY daily chart
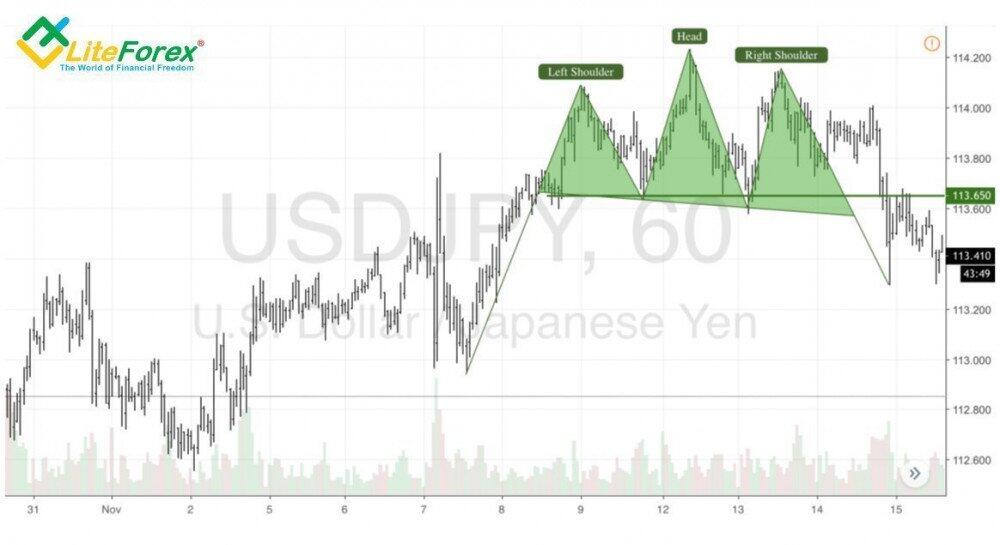
On the USD/JPY H1 chart, price action fans could detect quite easily the reversal pattern “Head and Shoulders”. Its components are “Shark” and one of the harmonic trading patterns based on 1-2-3 (Gartley, Crab, Bat or Butterfly). The latter allows identifying target points, but it’s not essential in case of the “Two graphic pattern screens” trading system as the targets are placed on longer timeframes here.
Head and shoulders on USD/JPY H1 time frame
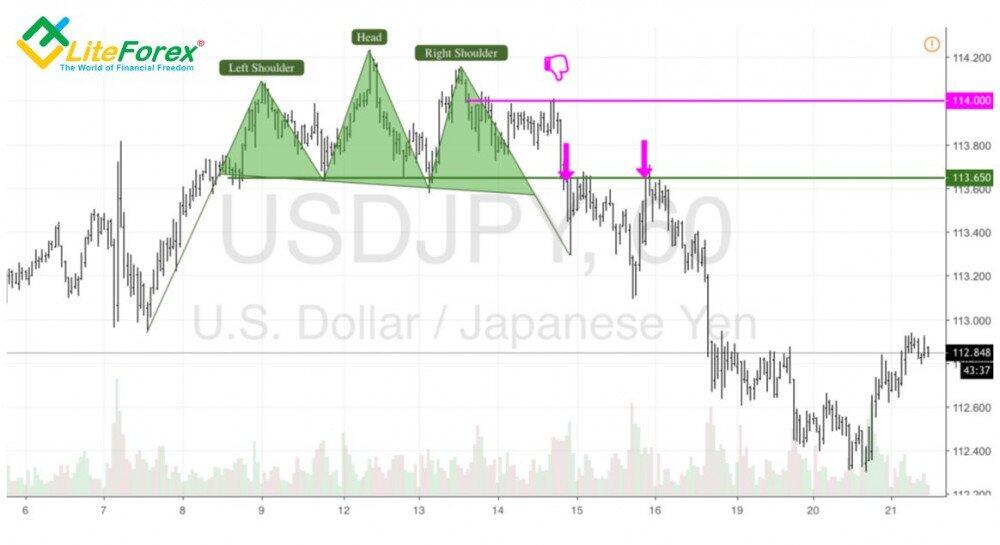
Next, look for entry points for short positions and stop orders. In our example, a breakout of the neck line of the Head and shoulders pattern or its retest would allow opening short positions. The protective stop order is located near the fluctuation peak and equals 35 pips.
Two graphic pattern screens on USD/JPY H1 chart
Placing target points on a longer timeframe allows increasing the profit factor and earning good money, provided that the strategy has worked out efficiently. However, one should be psychologically ready to use the golden trading rule “keep losses low, let profits grow”. Increasing risks of missed profits makes both private traders and hedge funds close their trades. In the USD/JPY example, the target of short positions is placed near the convergence zone. It can be detected via Gartley pattern.
The Gartley pattern on USD/JPY daily chart
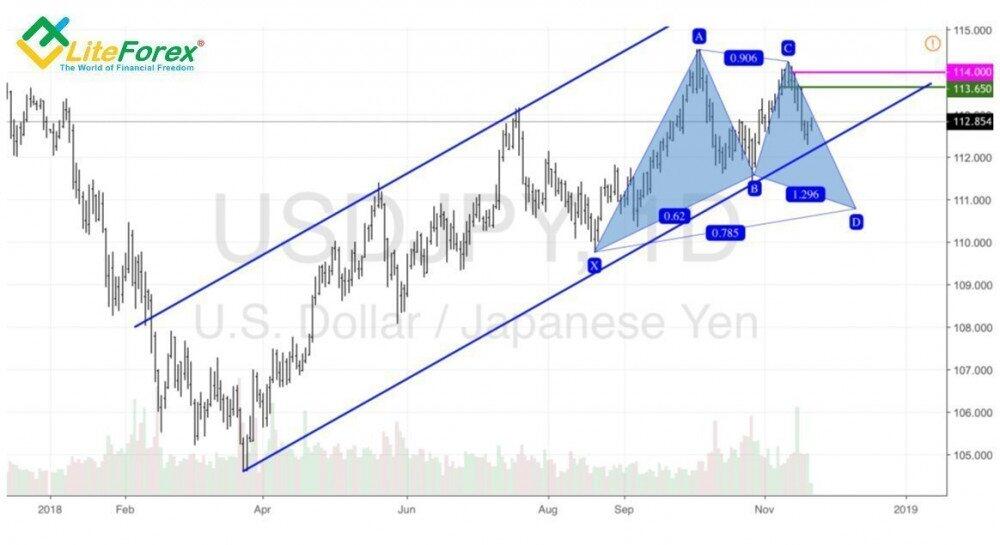
The potential profit/loss ratio exceeds 8 to 1. With this profit factor, the probability of profit-making trades may even be less than 50%, but it will still allow making money. In my opinion, the use of the Two graphic pattern screens system makes us think logically and turns trading into a creative process. It’s important as a routine compliance with signals is simply boring.
P.S. Did you like my article? Share it in social networks: it will be the best "thank you" :)
Useful links:
- I recommend trying to trade with a reliable broker here. The system allows you to trade by yourself or copy successful traders from all across the globe.
- Use my promo code BLOG to get a 50% deposit bonus on the LiteFinance platform. Simply enter this code in the appropriate field when funding your trading account.
- Telegram chat for traders: https://t.me/litefinancebrokerchat. We are sharing the signals and trading experience.
- Telegram channel with high-quality analytics, Forex reviews, training articles, and other useful things for traders https://t.me/litefinance
Price chart of USDJPY in real time mode

The content of this article reflects the author’s opinion and does not necessarily reflect the official position of LiteFinance broker. The material published on this page is provided for informational purposes only and should not be considered as the provision of investment advice for the purposes of Directive 2014/65/EU.
According to copyright law, this article is considered intellectual property, which includes a prohibition on copying and distributing it without consent.