In this article, we will look at concepts that are important not only in trading but throughout economics in general - supply and demand. As always, in this article, you will find detailed answers to questions such as: What are supply and demand? How to calculate supply and demand for a currency? How do supply and demand work in the real world? How to trade using supply and demand? What are the supply and demand zones? I will also share my opinion on this issue and offer you a fairly simple trading strategy.
The article covers the following subjects:
Supply and demand in economics
There is no point in talking about using supply and demand in trading if we do not understand the essence of these concepts. Most educated people are familiar with these concepts from university economics classes. Today the fundamentals of economics are taught even in schools, and I taught this course in several educational institutions. Before we approach the market adaptation of these laws, let's look at these concepts from the perspective of the primary source, namely, the classical laws of economics.
Demand is a request of an actual or potential buyer or consumer to purchase goods for the means available to them, which are intended for this purchase. Demand reflects, on the one hand, the buyer's need for certain goods or services, the desire to purchase these goods or services in a certain amount, and, on the other hand, the ability to pay for the purchase at a price that is within an acceptable range.
Supply is the opportunity and desire of the seller to offer their products for sale on the market at certain prices. In quantitative terms, supply is characterized by its size and volume. The volume or size of the supply is the amount of the product (goods, services) that the seller, in accordance with the availability or production capabilities, wants and is able to offer for sale on the market for a certain period at a certain price.
As we can see in these definitions, in essence, supply and demand are a state of opportunities between buyers and sellers at a certain point in time.
Based on these definitions, we have two basic laws of economics - the law of demand and the law of supply. I will not describe these laws in full, but rather only try to convey the essence. The essence of the law of supply is that the higher the price of a product, the higher the supply of that product. The law of demand says the opposite - the lower the price of a product, the greater the desire of the buyer to buy this product. We encounter these laws all the time in our everyday life. If you are a buyer in a store, you want to buy goods of the quality you need at the lowest possible price, and if you are a seller, your interest is to sell your goods at the highest possible price. Also, there is a concept of satisfaction with supply and demand. This means that supply and demand cannot grow forever. Sooner or later, a moment will come when there will be a turning point in the trend, or the price of a product will become so high that there will be no one who wants to buy it, or vice versa, there will be very few goods at a low price and too many people willing to buy them.
In order to apply these concepts to Forex trading, we need to make the following conclusions:
- Demand is a desire to buy;
- Supply is a desire to sell;
- Both supply and demand may increase and decrease;
- The main factor affecting supply and demand is time;
- Both supply and demand are volume values.
Supply and demand on the exchange
Demand on the exchange is a situation when a buyer wants to buy the necessary amount of goods at an affordable price at a particular point in time.
Supply on the exchange is a condition where the seller wants to sell the necessary amount of goods at an affordable price at a particular point in time.
As we see from these definitions, they are almost identical to the classic economic definitions, but with a specific emphasis on exchange factors, such as the volume of goods and time.
When can a large number of exchange participants have a desire to sell? I think everyone knows the answer to this question - when the price of goods has reached a peak value. A desire to buy arises in a large number of participants when the product price is very low. This is the main law of the exchange, which was formed at the dawn of economy - sell when it's expensive, buy when it's cheap.
But how do we determine when it’s expensive and when it’s cheap? On the exchange, time is so compressed that it is almost impossible to understand the state of the price at a particular moment in time. There is a way though. And the answer is hidden in the question itself – it’s time. Supply and demand, or rather, the desire to sell and buy always have a clear attachment to time. Demand may exceed supply in a particular moment, and in a minute everything can change. It follows that if you want to find supply and demand zones on a price chart, you must learn to tie them to a point in time.
Let's now define such concepts as supply and demand zones, or areas. These are areas in which market participants can form maximum demand or maximum supply.
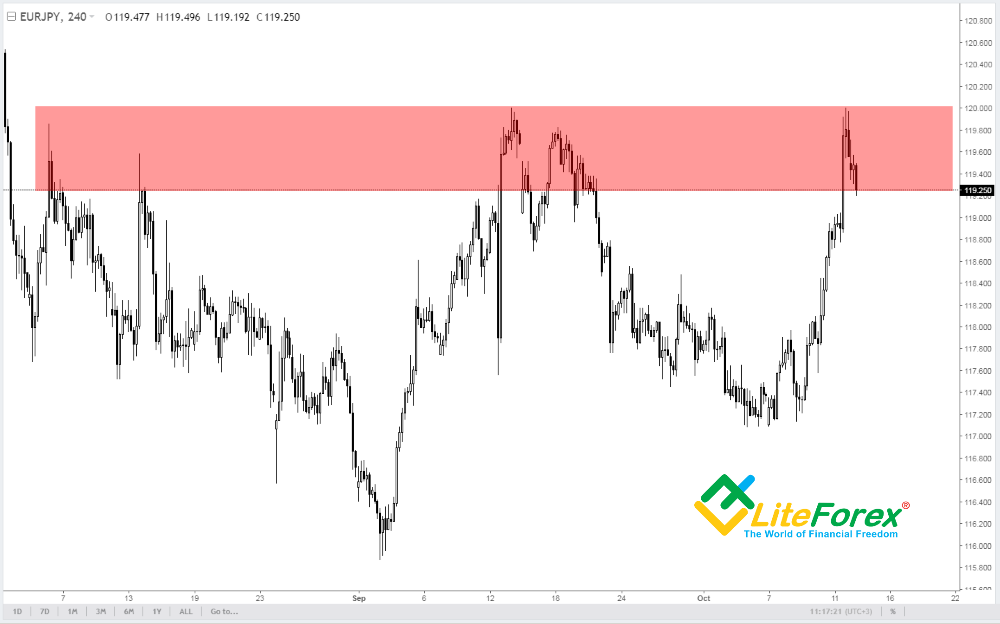
The chart above shows a possible supply zone. If you describe the qualities of this zone, it will become clear why it is located there.
The supply zone is an area in the price chart that, when reached, sees the desire of sellers beginning to exceed the desire of buyers. Desire can be described as volume, and therefore, in this zone, sell volume will exceed buy volume - an imbalance of supply and demand is created. If this proportion is correct at a particular moment in time, then the price will stop growing and begin to decline. Traders call this situation a reversal. Perhaps the greatest desire of any trader is to know how to correctly identify the point of price reversal. Returning to our chart, we see that in this zone the price really reverses due to a strong imbalance, and this has already happened 5 times.
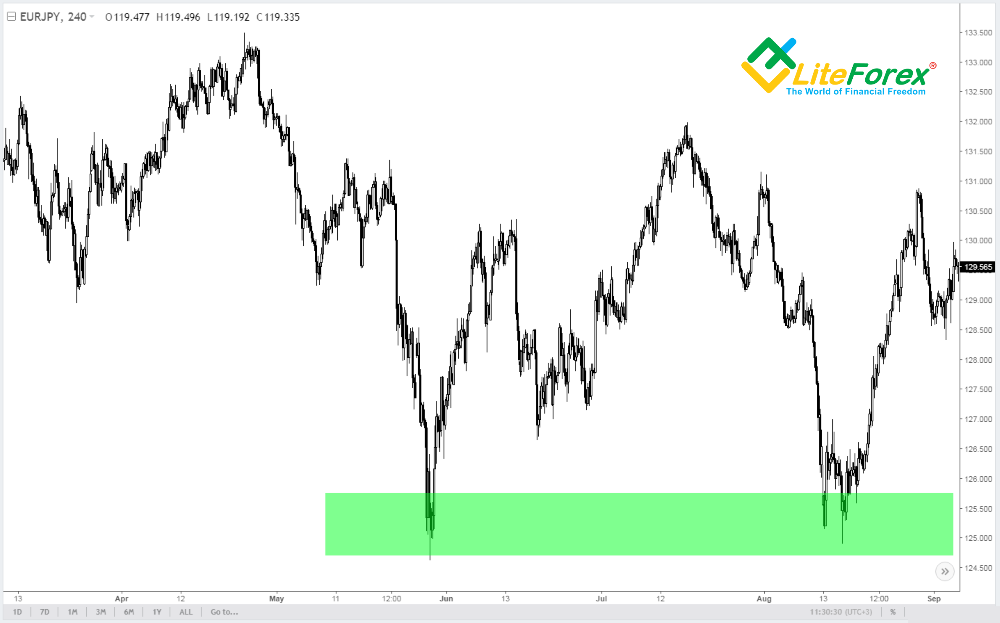
The next chart shows the demand zone. The demand zone is an area in the price chart that, when reached, sees the desire of buyers beginning to exceed the desire of sellers, or the buy volume becomes higher than the sell volume. If this proportion is correct at a particular point in time, the price will stop declining and growth will begin. This is also a reversal, but this time in a downside market. Finding supply and demand zones is what every trader must be able to do.
How supply and demand zones work
Now let's talk about the zones themselves. The first question that most people have is this: why is this a zone and not a specific point or level? To answer this question, let us turn to the theory of position formation on the exchange. The price on the exchange moves because participants sell and buy at various times, and therefore invest money (volumes) in their expectations. Suppose, I believe that the price of 100 is acceptable for me, and I want to buy goods at this price. I send an order to the exchange specifying my desire to buy at 100. At the same time, someone believes that the price of 100 is a good opportunity to sell. At the moment when the price approaches this quotation, my buy order is executed, and the seller’s order is executed at the same time. In the future, the price will move in the direction of higher volumes. If I bought five lots of goods at 100, and the seller sold only 4 lots at 100, this will lead to an increase in price, since the buy volume is higher than the sell volume. But if that was it, we would see a reversal at a specific point and movement to the point of the next reversal. But it’s not like this in reality. Why? Because there are many other participants in the market besides the two of us, who either did or will do similar actions. Thus, the price fluctuates up and down, and the actual turning point occurs only after some time. In other words, at each particular moment, every trader sees that it is better to buy or sell, but each has his own preferred price. This is why the moment of reversal is not a specific price level, but a price range. And the larger the time interval, the larger the range.
Supply and demand zones relative to time
In addition to trading volumes, there is another important parameter - time. Let’s talk about the time interval of the chart (timeframe).
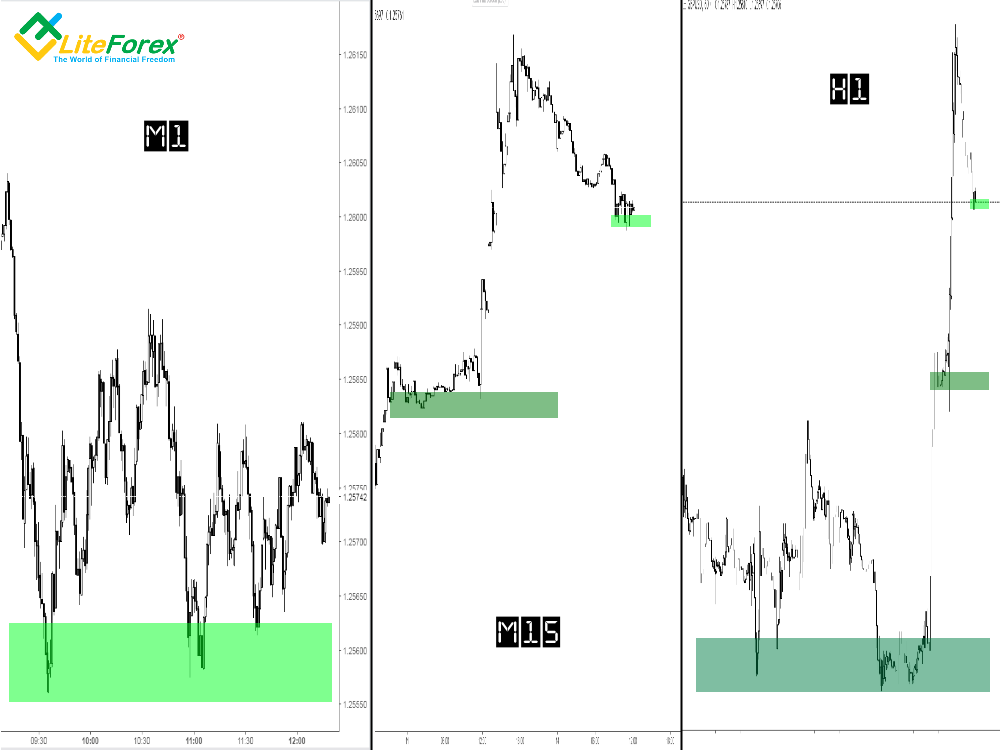
In the figure above, I depicted demand zones at different time intervals. The first chart displays the price behaviour in the M1 timeframe (one minute). We see a characteristic demand zone where a price reversal is formed. However, when switching to the M15 timeframe (fifteen minutes), it becomes clear that our initial zone is not so important in a larger time period and at any time the price can push through it and go down since it is inside a stronger volume that operates from an earlier demand zone. When switching to the H1 timeframe (one hour), we can clearly see that the demand zone in the M15 timeframe is not so strong, and there is a stronger volume that acts from the zone located below. Thus, we can increase the timeframe more and more and in each one we will find areas that are stronger and more important than areas in smaller timeframes.
Based on this, we should highlight the basic law of trading with demand and supply zones - when forming positions based on reversal signals from zones, only zones of a specific timeframe should be taken into account, and therefore, the operating time of these zones is also limited by this timeframe. Let's look at this law in more detail. First, if we determined the supply zone in the M15 timeframe, we should not switch to a higher timeframe and focus on its zones. Second, the zones have an operating time. This means that any zone only operates for a certain amount of time, after which it ceases to exist. This is due to trading volumes. The buyer closes the buy position and its volume is removed from the market, therefore, the balance of supply and demand is shifted. If the volume that formed the zone leaves the market, the zone ceases to exist. This is manifested in the movement of the price to a new zone. Thus, the zones are time-sensitive. In other words, the zone in the M1 timeframe is unlikely to exist longer than a couple of hours, and the zone in the 1H timeframe will last several days tops. Based on this, trading in these zones should be arranged in these time intervals.
Supply and demand zone indicators
There are a lot of various indicators, which can miraculously identify supply and demand zones. But in order to assess their effectiveness, let's look at the essence of these concepts. Supply and demand are volumes of buy and sell positions. Therefore, in order for such an indicator to be effective, it must display the balance of volumes in our chart (the real amount of currency bought and sold). I have already said many times in my articles that it is impossible to obtain data on the real volume on the Forex market due to the decentralization of the market. One bank has a certain number of orders, another has more or fewer, and even if there was an interbank information exchange system, we would never know which of these orders have real cash volume and which are formed using leverage. Based on this, it is simply impossible to create a real supply and demand indicator. Unfortunately, all these indicators the results of the wild imagination of their authors, who most often use the algorithm for binding the zones to support and resistance levels. The only volume that can be traced in the Forex market is the tick volume (the number of price changes per unit of time). Based on the tick volume, we can make an assumption about zones similar in their parameters to the demand and supply zones. You can find these zones are in the main oscillators, such as RSI and CCI.
Zones in the RSI indicator
The RSI oscillator is a zone indicator. It signals the price entering and exiting the so-called overbought and oversold zones. When these indicators were created, the definitions of these zones were described. The overbought zone occurs when the market is oversaturated with buy orders and the seller begins to form supply. The oversold zone occurs when the market is saturated with sell orders and the buyers begin to form demand. If we compare these definitions with the definitions of supply and demand, it turns out that they are really the same.
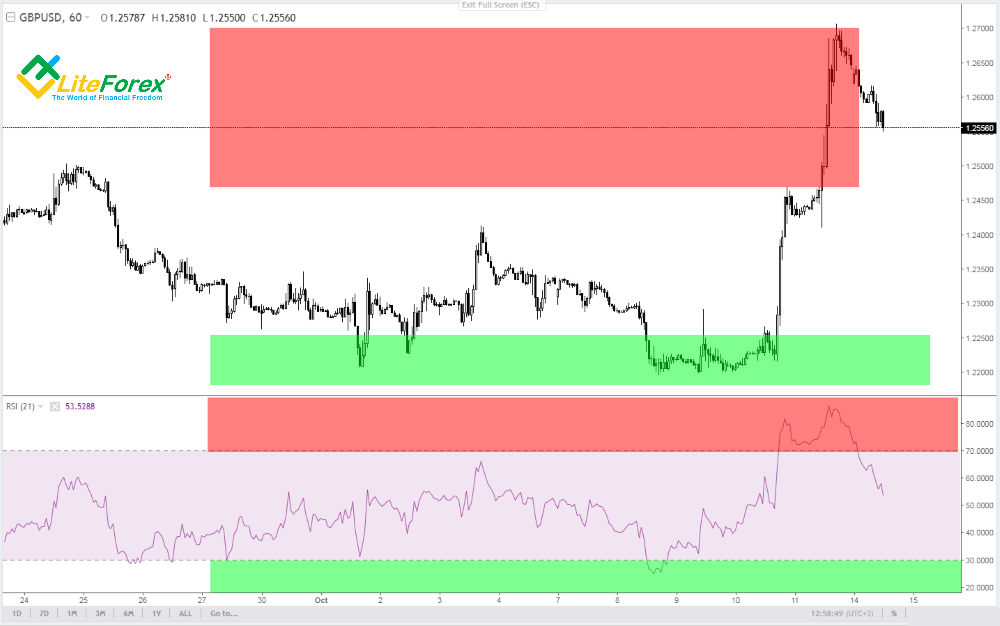
In fact, this indicator shows areas of oversaturation with supply and demand, which is exactly what we are looking for. When the indicator line enters one of the zones and stays there, the formation of a reversal position has begun, and when the indicator line goes beyond the boundaries of the zones, it is believed that the signal for the reversal has begun to form.
Zone market reversal strategy
Wrapping up my story about supply and demand on Forex, I would like to tell you about a very simple strategy that anyone can use.
In order to use the strategy, we need a chart of absolutely any instrument on the foreign exchange market and the RSI indicator. The time interval of the price chart is not important, but it shouldn’t be too small. I chose 30 minutes. The indicator period is set to standard - 14.
Getting signals
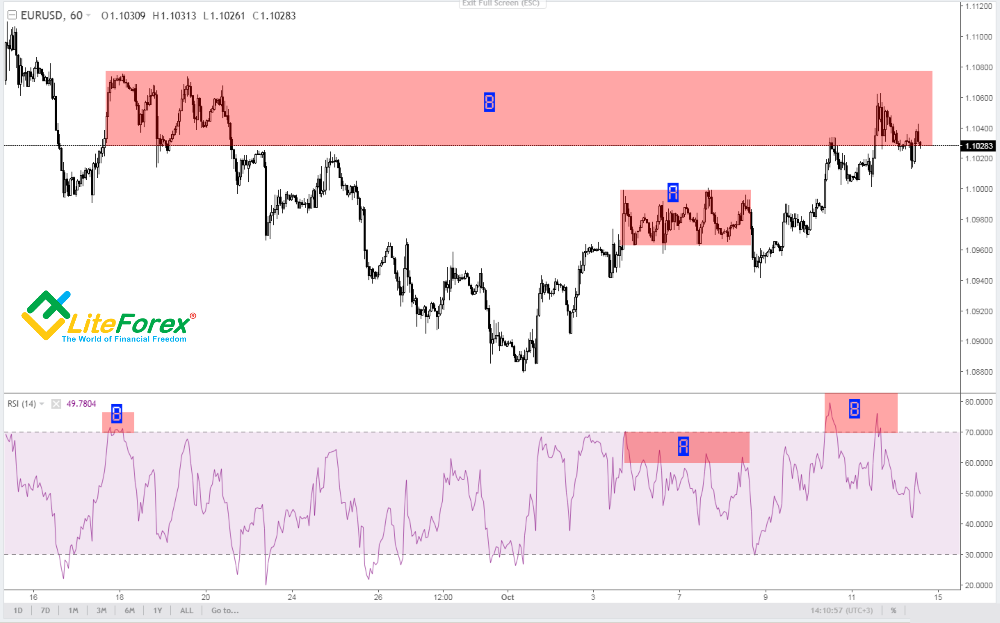
To get signals, we need the potential zone in the price chart to coincide with the zone in the indicator:
- Determine the direction of the trend in the price chart. At the moment, an uptrend is operating in the chart. Therefore, we will try to determine the zone of potential price reversal and the transition to a downtrend;
- You need to find a relatively strong resistance level inside our trend. The easiest way to find it is by possible side channels in the chart. One of these channels is indicated as “A” in the chart;
- Check our channel against the indicator values. If the indicator is in the overbought zone, then the zone is true. In our case, the zone is in the chart, but the indicator is under the overbought zone. Therefore, this zone will not do;
- If there are no more similar levels, so we should wait for the indicator to enter the overbought zone;
- In zone “B”, the indicator entered the overbought zone, which means that the desired reversal may be nearby;
- Now look for the previous entry into the oversold zone in the history of the indicator and check against the price chart. If there is a zone in that place in the price chart, we compare it with the current price. The current price should be at the level of this zone. It is in our chart. Therefore, the signal is true;
- At the moment when the indicator comes out of the overbought zone, we can open a sell position;
- Set a stop order just above the supply zone in the price chart;
- Take profit when the indicator reaches the oversold zone.
Conclusion
To conclude, I will repeat my opinion regarding using these zones for trading. I tested this method and came to the conclusion that the market is too volatile to work comfortably using these zones at intraday intervals. On the other hand, it does not make much sense to use them in the long term because of the large error margin and the very size of the zones, which often exceeds the possible profit.
P.S. Did you like my article? Share it in social networks: it will be the best "thank you" :)
Useful links:
- I recommend trying to trade with a reliable broker here. The system allows you to trade by yourself or copy successful traders from all across the globe.
- Use my promo code BLOG to get a 50% deposit bonus on the LiteFinance platform. Simply enter this code in the appropriate field when funding your trading account.
- Telegram chat for traders: https://t.me/litefinancebrokerchat. We are sharing the signals and trading experience.
- Telegram channel with high-quality analytics, Forex reviews, training articles, and other useful things for traders https://t.me/litefinance

The content of this article reflects the author’s opinion and does not necessarily reflect the official position of LiteFinance broker. The material published on this page is provided for informational purposes only and should not be considered as the provision of investment advice for the purposes of Directive 2014/65/EU.
According to copyright law, this article is considered intellectual property, which includes a prohibition on copying and distributing it without consent.