Dear friends,
I continue my series of training posts, and this time, I would like to speak about divergences.
How to apply divergence in technical analysis of cryptocurrency?
You are likely to have come across this notion in the reviews of analysts and traders, but I don’t think that you have studied this topic in detail.
Everybody knows that divergences are divided into bullish and bearish. But how many types of divergence can you enumerate?
The answer is three.
The term of divergence is quite common and is widely used in mathematics, physics, biology, linguistics. Its nature is the same everywhere and comes from Latin ‘divergo’, that means ‘deviate’.
In technical analysis, divergence occurs when an indicator and the price of an asset are heading in opposite directions.
The advantage of divergence in technical analysis is that, unlike most signals, divergence is a leading one.
The principle of this signal is rather simple. If it has appeared, the trend is likely to reverse soon, or, at least, the market is likely to move sideways.
Therefore, bearish divergence will mean the price reversal downwards, and bullish one will mean that the price will reverse upwards.
Divergence signal is relevant in all timeframes, but like for most signals, the subordination law works here as well. That is, divergence in a longer timeframe is a stronger signal than that in a shorter one.
If we discuss Bitcoin in this respect, I can say, based on my own experience, that the most suitable timeframe to identify divergences is 12-hour one.
It is difficult for me to explain, why, but exactly in this timeframe the signals work the most efficiently.
To look for divergence signals, I use a number of oscillators, such as:
- Chaikin oscillator
- DeMarker
- MACD
- Stochastic
- RSI
- Volume oscillator.
Why do I use exactly them?
Because, each of them is unique in a way, has its own features and the limit of sensitivity in different market conditions.
You can use any other oscillator, convenient for you, as in this post, I primarily aim at describing the very nature of Divergence signal and how to correctly read it in the chart.
So, as I have already said, there are three types of divergence, they are:
- Regular Divergence (opposite to the trend),
- Hidden Divergence (following the trend),
- Extended Divergence.
Besides, it should be remembered that divergence is relevant solely until the next extreme is formed, after that, it loses its relevance.
Example of Regular (opposite to the trend) divergence
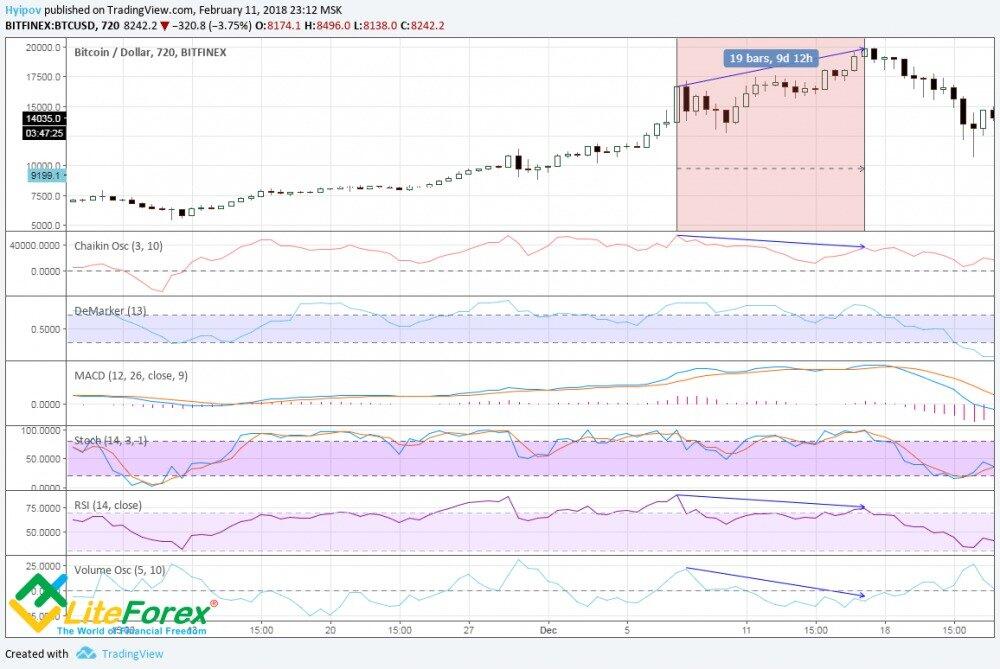
In the chart above we see an example of regular BEARISH divergence, that is also called the divergence, opposite to the trend.
The principle of the signal is based on its name.
In the chart above we see, although all-time highs are being renewed within the bullish trend, the oscillators, Chaikin, Volume and RSI, show highs lower than the previous ones.
For presentation purpose, I marked this signal with blue arrows.
As we see from the history, this signal 100% worked out, and the people who followed this signal, left the market on time, having sold their bitcoins at all-time highs.
In case of regular BULLISH divergence, the signal works according to the same principle, that is the indicator, despite the market lows renewals, will show higher lows.
Example of Hidden (following the trend) divergence
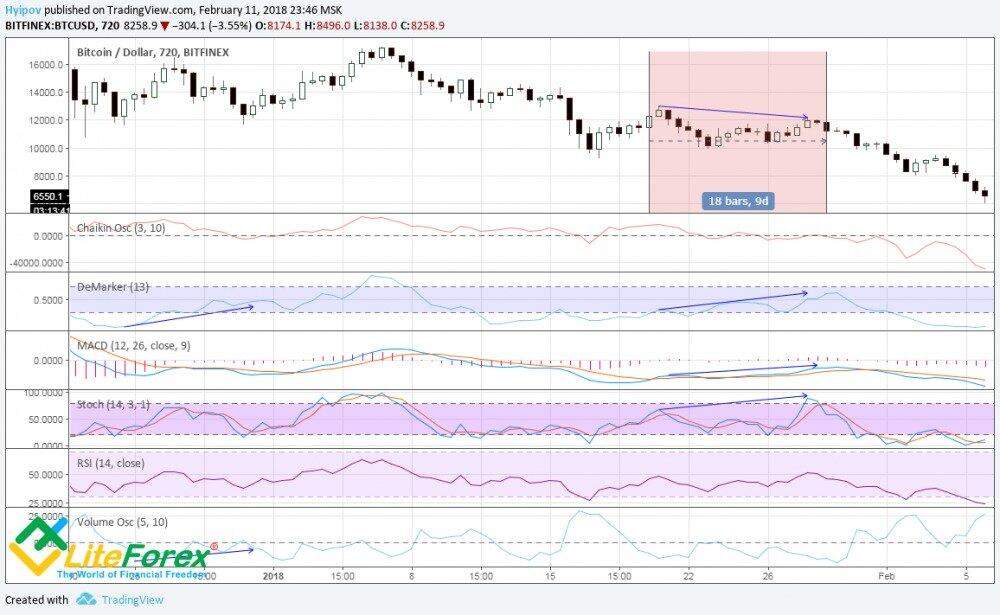
In the chart above we see a good example of the opposite divergence, which is also called hidden divergence, or following the trend divergence.
Beginners often confuse Hidden Bearish divergence with Regular Bullish one, which results in bad mistakes. Traders open long positions, when, on the contrary, they should look for short ones.
In the chart above, it especially clearly identified by DeMarker, MACD and RSI, that there is this tricky Hidden BEARISH divergence.
Its principle is opposite to the regular divergence; here, an oscillator shows higher highs, which the price fails to reach.
As you see, this signal had also perfectly worked out, and the market, following the signal, slipped down into the correction.
For Hidden BULLISH divergence, everything is visa versa; an indicator shows lower lows, when the price fails to reach them.
An example of Extended divergence
Extended divergence often occurs during the market moving sideways, when there are not so many highs and lows. It also occurs when Double Bottom or Double Top patterns are forming, being a perfect confirming signal of the trend reversal.
In this case, one needs to follow, what value indicates an oscillator, when the price reaches the border of the lateral (side-way) channel.
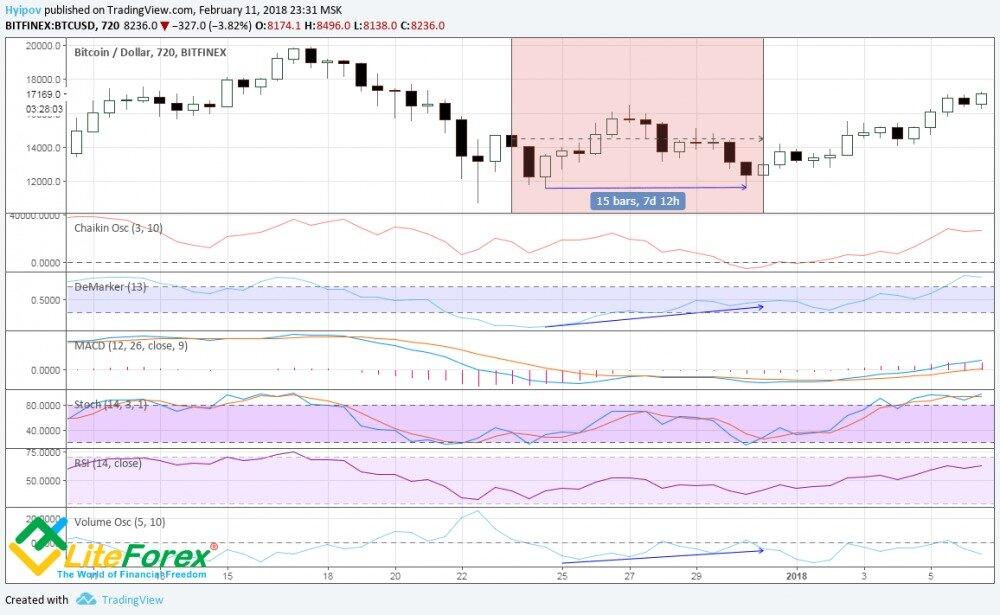
In the chart above, we see that the price had only reached the previous low, when Volume oscillator and DeMarker showed the higher lows.
This signal is Extended BULLISH divergence.
Extended BEARISH divergence based on the same principle. It occurs when the price highs are at the same level, but an oscillator fails to indicate the previous highs and showed the highs, lower than the previous ones.
What’s now?
To analyze the situation accurately and find out divergences, it is necessary to follow an asset moves in all timeframes, from the weekly one to the hourly one.
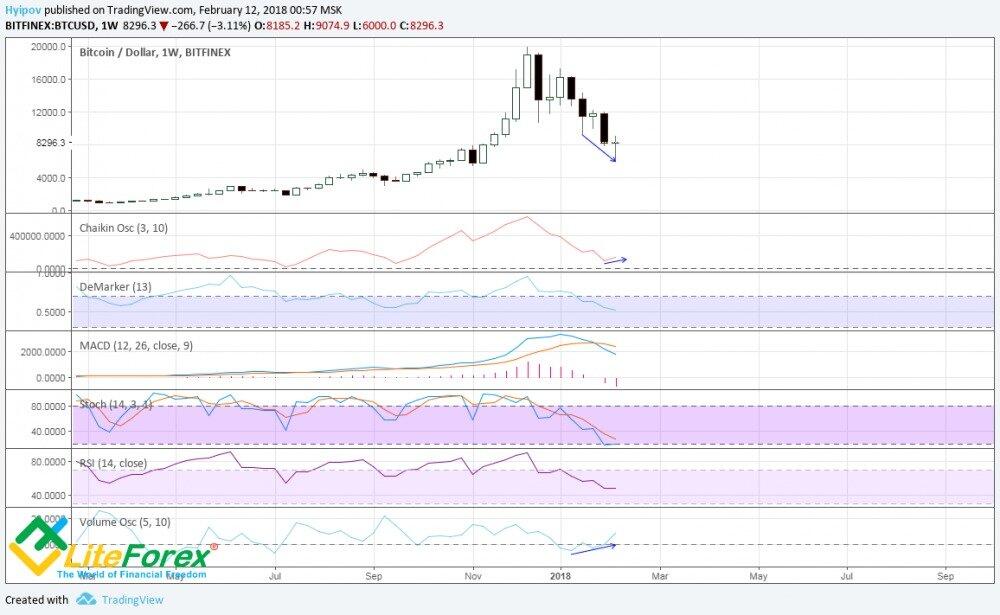
Let’s try to analyze our dear Bitcoin in this respect.
As wee see, in the weekly chart, there are weak attempts to form regular bullish divergence on volume oscillator.
This oscillator is one of the most sensitive, so, its signal always need proofs.
As wee see, the rest of oscillator are still following the market, and only Chaikin oscillator gives a signal, suggesting that a divergence is likely to form.
In combination, this signal can be a sign of weakening correction and a soon beginning of the end, or at least a pause, of the bearish trend.
In the daily chart, the situation hardly clarifies.
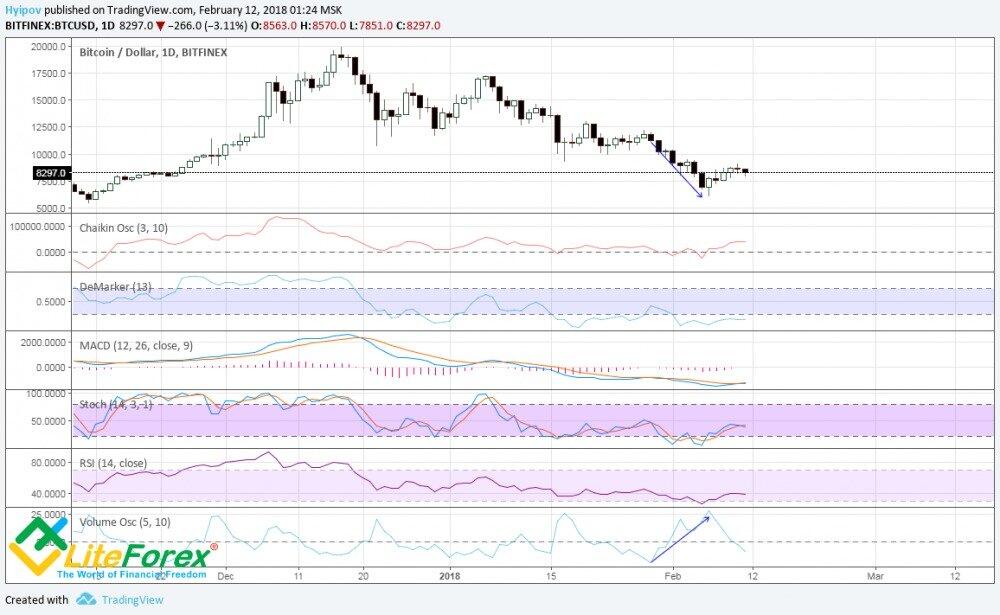
We see that volume oscillator has already started renewing the highs, although the market is still moving downwards.
However, the other indicators don’t give strong reversal signals.
That means, this slight rollback that is developing now, can well be the result of the single signs, indicated by volume oscillator.
In 6-hour chart, the situation looks even worse.
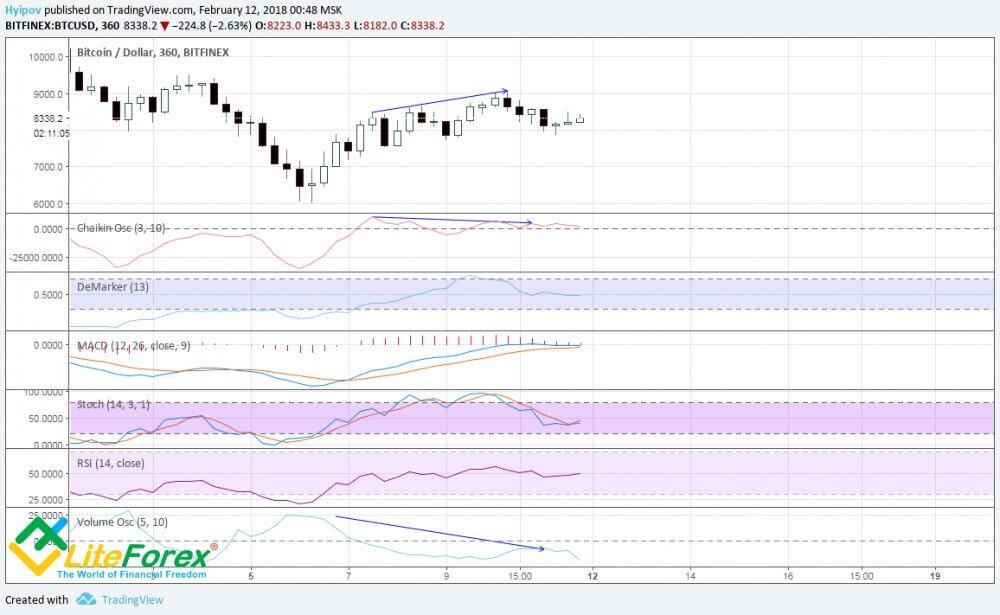
As we see in the chart above, there is bearish divergence, indicated by Chaikin and volume oscillators, it is already quite a good reason for correctional move.
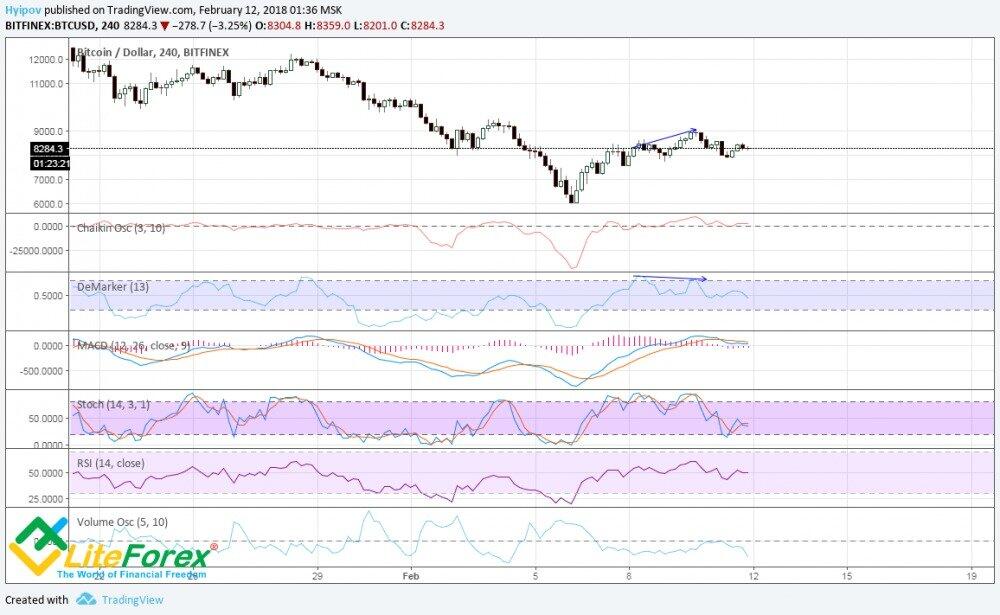
In 4-hour chart, bearish trend is confirmed by DeMarker.
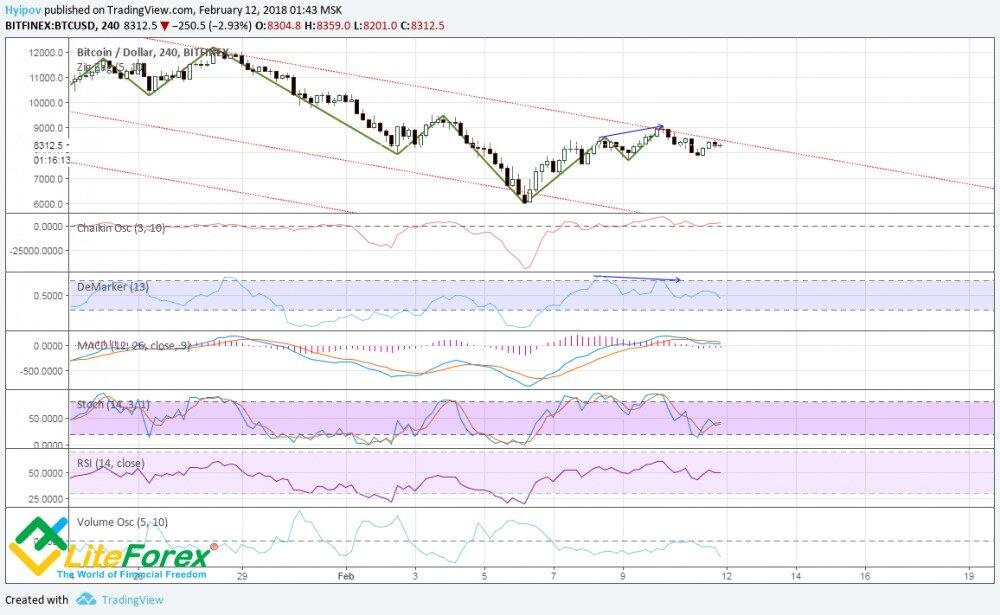
As we look for divergence by comparing the price move and the indicators, for more clarity, I recommend using Zig Zag. It highlights the local extremes in the price chart, which makes the analysis easier for beginners.
Don’t forget, to look for divergences in a bearish trend, we compare lows, and in a bullish trend – highs.
The divergences themselves should be only seen as a confirming, complementary signals for your trading strategy.
Opening a position, based on solely a divergence signal, involves extreme risk!
A good combination of the analysis of divergence with trading strategies is the use of this analysis in channel trading.
See the example in the chart above.
Now, the market is moving in a descending channel, and bearish divergence in 4-hour chart indicates that this channel is unlikely to be broken out from below. Therefore, when the price rebounds from the upper channel border, short positions can be opened with essential following money management rules and setting stop loss orders.
I wish you good luck and good profits!
P.S. Did you like my article? Share it in social networks: it will be the best "thank you" :)
Useful links:
- I recommend trying to trade with a reliable broker here. The system allows you to trade by yourself or copy successful traders from all across the globe.
- Use my promo code BLOG to get a 50% deposit bonus on the LiteFinance platform. Simply enter this code in the appropriate field when funding your trading account.
- Telegram chat for traders: https://t.me/litefinancebrokerchat. We are sharing the signals and trading experience.
- Telegram channel with high-quality analytics, Forex reviews, training articles, and other useful things for traders https://t.me/litefinance

The content of this article reflects the author’s opinion and does not necessarily reflect the official position of LiteFinance broker. The material published on this page is provided for informational purposes only and should not be considered as the provision of investment advice for the purposes of Directive 2014/65/EU.
According to copyright law, this article is considered intellectual property, which includes a prohibition on copying and distributing it without consent.