


Go on studying SK-FX strategy. We will study phantom signals. We will learn to draw adaptive channels. We will set targets for trading plan. We will sum up the information and make up a trading algorithm.
Today, we are going to study phantom signals and adaptive channels. We will also summarize the whole series of educational articles and draw the right conclusions.
Dear friends,
If you are reading about this trading strategy for the first time and haven’t read my previous educational articles, I strongly recommend you reading the articles form the very beginning in the following order:
SK-FX - a High Accuracy Strategy (part 1)
SK-FX - a High Accuracy Strategy (part 2)
SK-FX - a High Accuracy Strategy (part 3)
For the rest of you, I continue my educational section, devoted to SK-FX strategy. I’m going to describe the notion of “phantom signal”, according to the strategy author himself, ut is a very important signal, as it very reliable and often emerges when there are no other signals.
The author suggests two types of these signals; they are phantom signals along and against the trend.
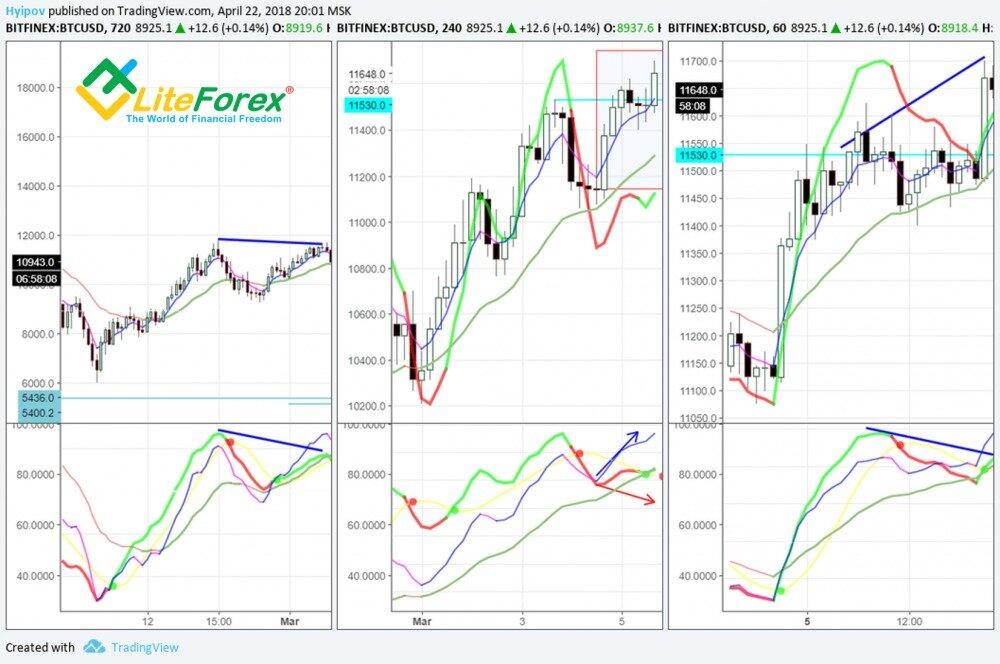
In the chart above, we see a good example of a phantom signal against the trend. In the central chart, we see a price jump that was hardly followed by any MACD reaction (in the window below); it continued moving downwards, against the main trend.
To display it, a simple five-bar moving average is placed on MACD. I marked the uptrend with a blue arrow and the opposite move of MACD - with a red one. As we see in the same window, there is divergence emerging in the centre, however, I should note that this combination of signals is not strongly required.
This reversal signal must be proved in the shorter timeframe. In the right of the chart, we see that the shorter timeframe H1 indicates a bearish divergence just before the correction starts. It is also good, when the signal is confirmed in the longer timeframe.
In the left chart, we also see a strong bearish divergence in 12-hour timeframe. The combination of these confirming signals in the shorter and the longer timeframes guarantee the inevitable correction.
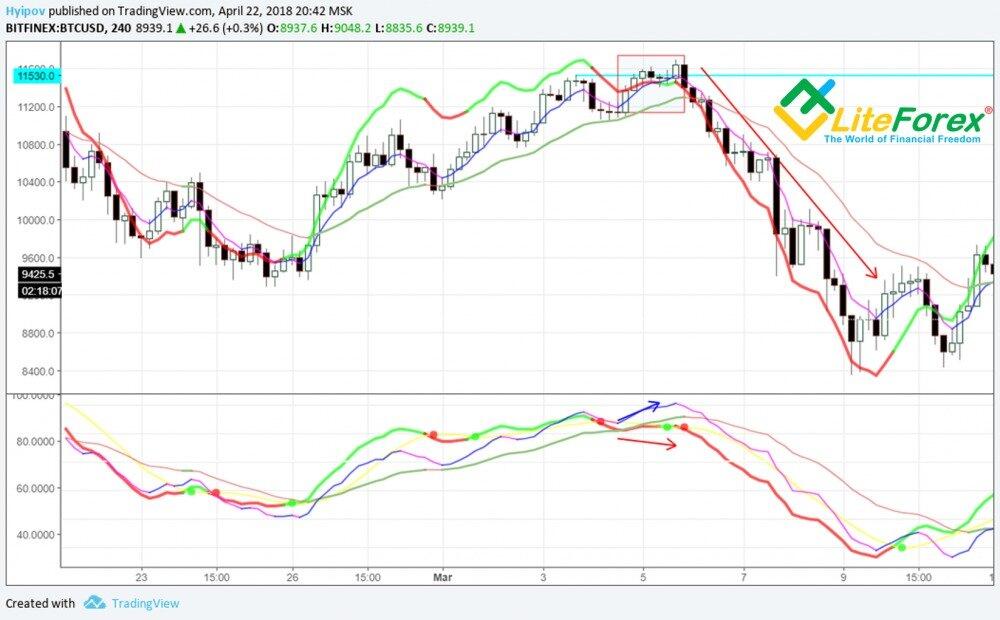
It is seen in the chart, this phantom signal was followed by the strong correction. Here, we should pay attention to the level, the signal is in the window with MACD and moving averages. The closer is the signal to the upper window border, the stronger is it, and so, the sharper will be the price swings, when the signal is working out.
As I’ve said before, there is also the phantom signal along the trend. It occurs less often, mostly in minute-timeframes.
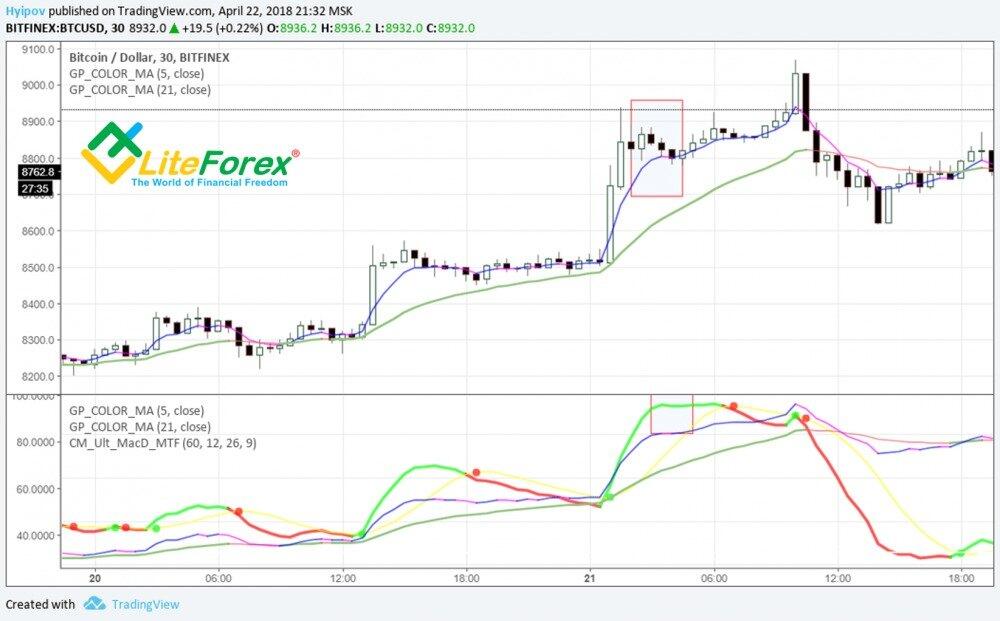
In the chart above, there is may be not the best example of such signal, but it retains the principle. The principle is that when the price ticker goes down, the oscillator moving average doesn’t move. Phantom signal along the trend is the signal of the trend extension. It indicates that the reversal potential is not strong enough and the trend is likely to continue.
In the chart above, we see that this signal was followed by the continued growth, being stopped by another price jump, which, in its turn, formed a bearish divergence, and so, signaled the reversal. Another forecasting toll in SK-FX strategy is adaptive channel of the long trend. It is used to clearly identify the trend direction in the analyzed timeframe.
As I said in my previous articles, the strategy allows trading against the trend only provided that the reversal signals are proved in the shorter timeframes. Therefore, this tool is very important for the strategy efficiency. The channel is arranged quite easily. You need to add to the price chart another moving average of nine bars that will be drawn from the short five-bar moving average.
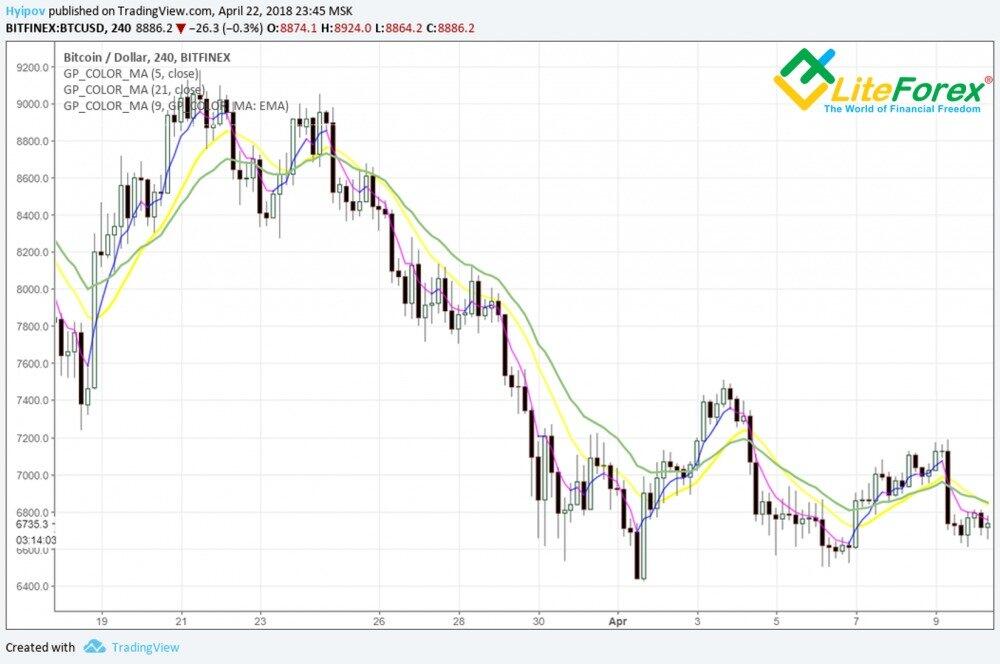
In the chart above, it is market with yellow. Finally, we have the following order of moving averages in the chart: five, nine and 21 bars. When yellow and green lines are below the short moving average, the trend is bullish.
In the opposite case, the trend is bearish. When the short moving average crosses yellow line, it means the trend reversal; it looks like a cross in the chart.
Crossing from below is bullish reversal.
Crossing from above is bearish reversal.
In more recent charts of SK-FX strategy author, there is often an indicator, looking like Keltner Channel. I haven’t found a reliable source, confirming that the author uses exactly this indicator, but, taking into account that it is completely linear, relative to the price, I’m likely to be right.
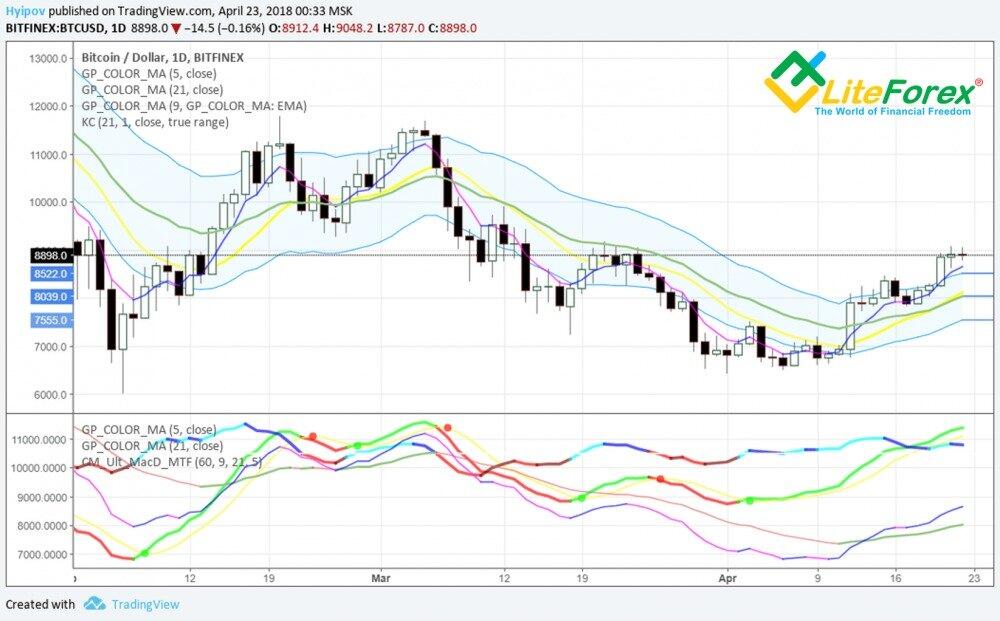
If we lay the channel over 21-period moving average, it perfectly fits in the strategy general logic, identifying not only the market equilibrium point, but the main targets during the way to it as well. For example, in the chart above, we see the daily chart of BTCUSD, whose price ticker is above the market equilibrium level, which, as we remember, is dynamic and is indicated by the last value of MA 21.
Therefore, the expected price correction in the daily timeframe should be aiming the targets in the following order:
Target 1 – 8 522 USD (the upper border of Keltner channel);
Target 2 – 8 039 USD (MA 21 and the channel center);
Target 3– 7 555 USD (the lower border of Keltner channel).
Here, the reaching of the lower channel border is based on the market inertia. In case of bearish market reversal, this level will be the first support zone.
Finally, we have a minimum tool set for working with SK-FX strategy.
In the price chart, they are:
- moving averages with the periods of 5 and 21, applied to close;
- moving average (of nine periods), drawn based on the 5-period moving average;
- Keltner channel with the period of nine bars, drawn according to close levels.
In some modifications, there is also short MACD moving average, but I wouldn’t add it, so as to not overload the chart.
In the indicators window, the tools are:
- MACD in the form of a line + its moving averages with periods 9,21,5;
- moving averages with the periods of 5 and 21, applied to close.
In some modifications, in the author’s chart, there is an indicator, looking like Aroon. I didn’t describe the indicator in my educational sections, as the author gives no further information about it, and its functions can be performed by the adaptive channel and MACD.
As a result, this combination of indicators provides the following signals:
- The price deviation from the market equilibrium level;
- Dynamic crossing of the longer indicator by the shorter one;
- Price jumps;
- Divergence and convergence of MACD lines and MACD itself with the price chart;
- The signal of reversal and correction, when the indicator is close to the window bordedrs;
- Phase signals;
- Phantom signals.
Roughly speaking, the whole process of trading is monitoring the divergence and convergence in the longer timeframes and the indicators in the shorter timeframes, considering the analysis of indicators in different timeframes and the price location relative to the balance level.
Besides, the analysis always starts from the longer timeframes, we identify the market prospects due to the degree of deviation from the balance and reversal signals. In the shorter timeframes, we identify the reversal moment itself, to open a perfect position.
Here, I should emphasize that the strategy is suggested for an experienced trader; so, before you start to apply it in practice, carefully study all the above indicators, to understand how they work and interact.
Besides, never forget about risk management!
Always use StopLoss and TakeProfit levels!
Here, I’m going to finish my education section devoted to SK-FX strategy.
I want emphasize once again that, though I was trying to summarize all the author’s information available, my variant of the strategy can differ from the last updated modification.
In addition, the strategy has some drawbacks. First, it is impossible to identify the targets in the trend, if it is already beyond the market balance level. Unfortunately, the indicators, applied in the strategy, don't help to solve the matter.
Another drawback, I think, is a total rejection of analyzing trading volume in the market, which could simplify the understanding of the market movements and improve the strategy efficiency. So, I’m not going to stop here, I will experiment with the indicators, adjusting them to reach the maximum performance of the strategy.
I will share the first results of my experiments in the next posts, as well as the all-round view of the BTCUSD pair, applying SK-FX strategy.
Looking forward to you likes, comments and reposts ;)
I wish you good luck and good profits!
P.S. Did you like my article? Share it in social networks: it will be the best "thank you" :)
Useful links:
- I recommend trying to trade with a reliable broker here. The system allows you to trade by yourself or copy successful traders from all across the globe.
- Use my promo code BLOG to get a 50% deposit bonus on the LiteFinance platform. Simply enter this code in the appropriate field when funding your trading account.
- Telegram chat for traders: https://t.me/litefinancebrokerchat. We are sharing the signals and trading experience.
- Telegram channel with high-quality analytics, Forex reviews, training articles, and other useful things for traders https://t.me/litefinance
The content of this article reflects the author’s opinion and does not necessarily reflect the official position of LiteFinance broker. The material published on this page is provided for informational purposes only and should not be considered as the provision of investment advice for the purposes of Directive 2014/65/EU.
According to copyright law, this article is considered intellectual property, which includes a prohibition on copying and distributing it without consent.