


Go on studying SK-FX strategy. In this post, I will tell you about long and short trends, signals in the longer timeframes and phase signals.
Today, we are going to study what long and short trends are. I’ll tell you about signals in the longer timeframes and phase signals.
Dear friends,
I continue my educational section about SK-FX strategy.
The strategy developer, Sergey Kucher, does emphasize in his studies the importance of the right interpretation of the divergence (convergence) signal. It is due to the leading feature of the indicator, combined with the logical tie between different timeframes, we can call the strategy a high accurate one.
Unfortunately, the divergence signal doesn’t provide any information about either the length, or the depth of the price move. To find it out, we need the trend indicators, like moving averages. Also, the depth of the price move, following the signal, is identified by any oncoming signal in the opposite direction, that is used in SK-FX strategy.
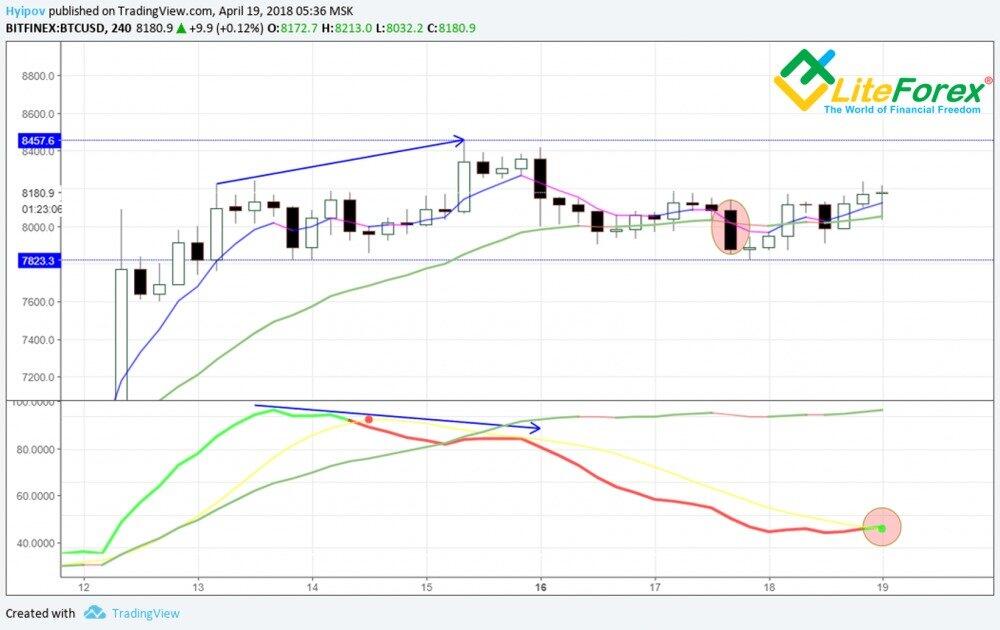
As you see in the chart above, there was a complete divergence signal in the 4-hour chart. It resulted in the price correction; and the market balance was restored. The bar, where the short and the long moving averages met, i.e. the point where the market stroke the balance, can be considered the first signal to fix the profits.
The second signal, defining the depth of this divergence impact, is the opposite MACD signal to buy in the zone, where its two moving averages met (marked with red circle):
Another sign that the divergence (convergence) signal finishes working is the divergence (convergence), emerging in the opposite direction.
In the chart above, we see that within the correction, bearish divergence is followed by reversal convergence. This signal weakens the impact of the previous divergence, and so, suggests revising the positions.
Besides, we shouldn’t forget about confirming the signal in the longer timeframes.
Modern technical analysis analytical platforms allow adjusting almost any timeframe on your won. You can experiment with this option in future. For now, within the educational section, I won’t change the order, suggested by the author.
To apply SK-FX strategy, its developer Sergey Kucher suggests the following order of timeframes (starting up form the shortest down to the longest ones):
M1 – M5 – M30 – H1 – H4 – H12 – D1 – W1 – M1
Where the minutes timeframe is used to identify the exact entry point, and the monthly one – to identify general market imbalance and the main trend direction.
Therefore, all intermediate timeframes are used to confirm or deny the signals in the shorter timeframe, which, combined, make up a single integrated chain of consecutive signals, enabling you to take the single right decision.
The level of timeframe utilization depends on the scope, you are working on:
- for long-term trades, suitable timeframes are from H4 to M1;
- for middle-term ones – form H1 to W1;
- for short term - from M30 to D1;
- for intraday trading – from M15 to H4;
- for scalping - from M1 to H1.
This division, of course, is merely indicative; however, it is based on the principle that everyone should determine the timeframes, most suitable for their trading style. If you don’t do this, you will be scared by any sharp price swing, or completely lose orientation in the market. This selection will make it easier for you to apply the strategy and to filter out false signals.
Having selected your timeframe, you should remember that you can consider the signal in the chart, only when the candlestick is closed. The matter is that indicators show the "current" situation in the chart; and if within one hour, there was a sharp price move, followed by its return, the indicator will signal the first thing, and the second one afterwards, which can confuse a beginner.
After you have decided on your trading timeframe, you need to identify the long and the short trend (the strategy author’s terms are used):
- Long trend is the general price trend in the longer timeframe.
- Short trend is determined by the direction of price jumps. These trends are temporary, short-term ones, that’s why they are called so.
To find out the main trend direction, we should draw a chart in the longer timeframe of your working range.
For example, you are a position trader (short-term one) like I am. In this case, your longest timeframe will be the daily one.
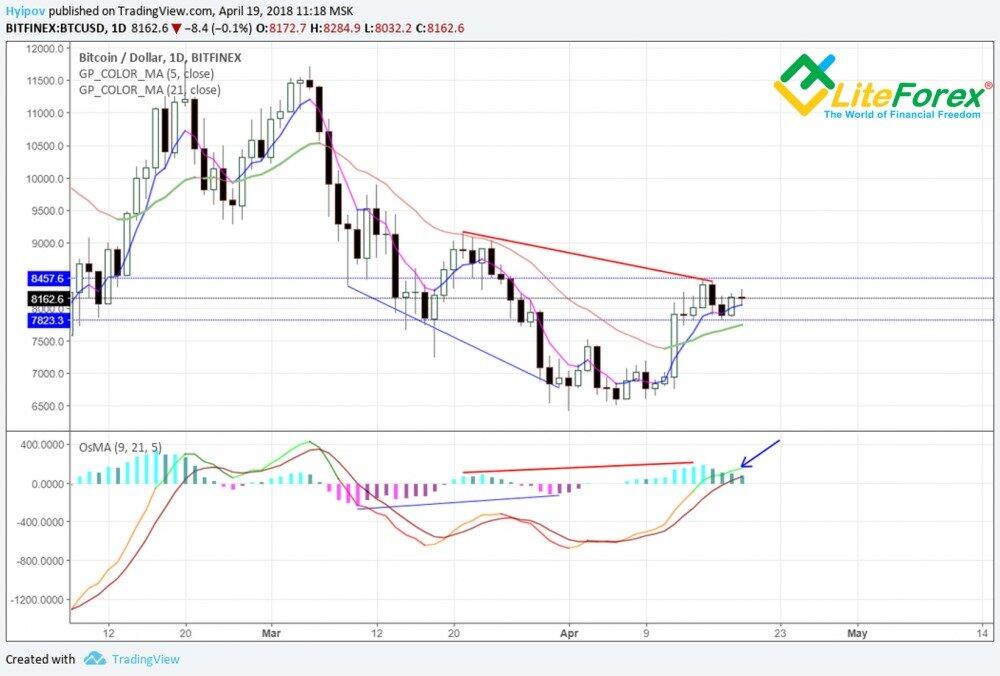
Here, to identify the trend, we are using indicator OsMA (9, 21, 5). Its moving average define the long trend direction.
If the short moving average is above the long one, as in the chart above (marked with blue arrow), the long trend is bullish. Bearish trend is indicated by the mirrored situation. As you understand, trading against the long trend involves high risk, especially for intraday traders, the long trend for those can be drawn in the 4-hour chart.
Next, we check the chart for divergences. In the chart above, there are two convergences marked. At the same time, we see that the bullish convergence (marked with blue lines) is followed by the bearish one (marked with red lines). Therefore, the last one dominates.
To confirm this signal to be strong, we check for it in the longer timeframe, in our case, it is one week.
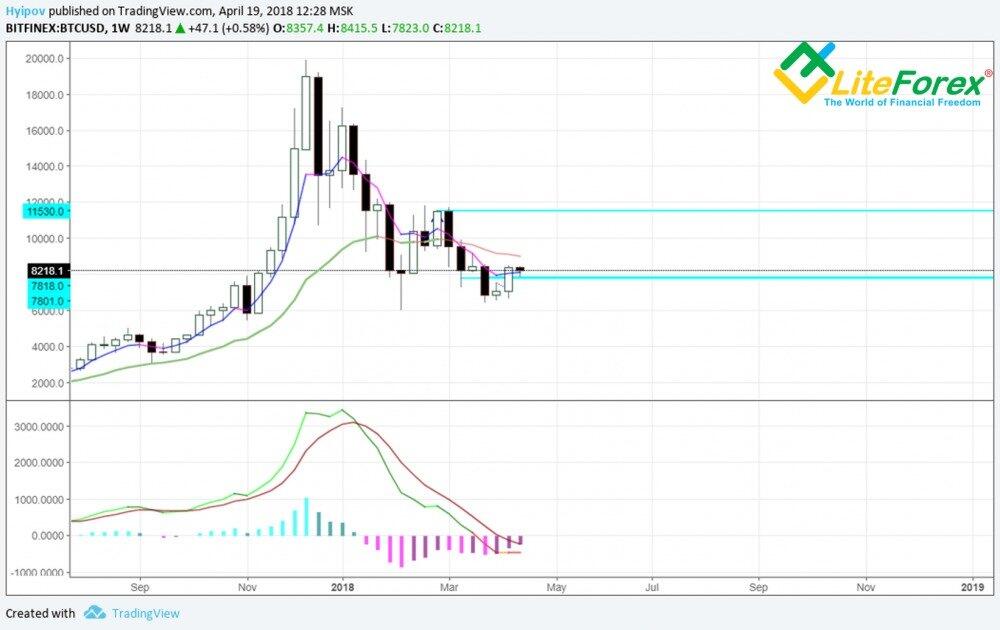
We see in the chart above that there is bearish long trend in the weekly chart. It means, this convergence is likely to work out. Now, to confirm it, we need a proof in the shorter timeframes: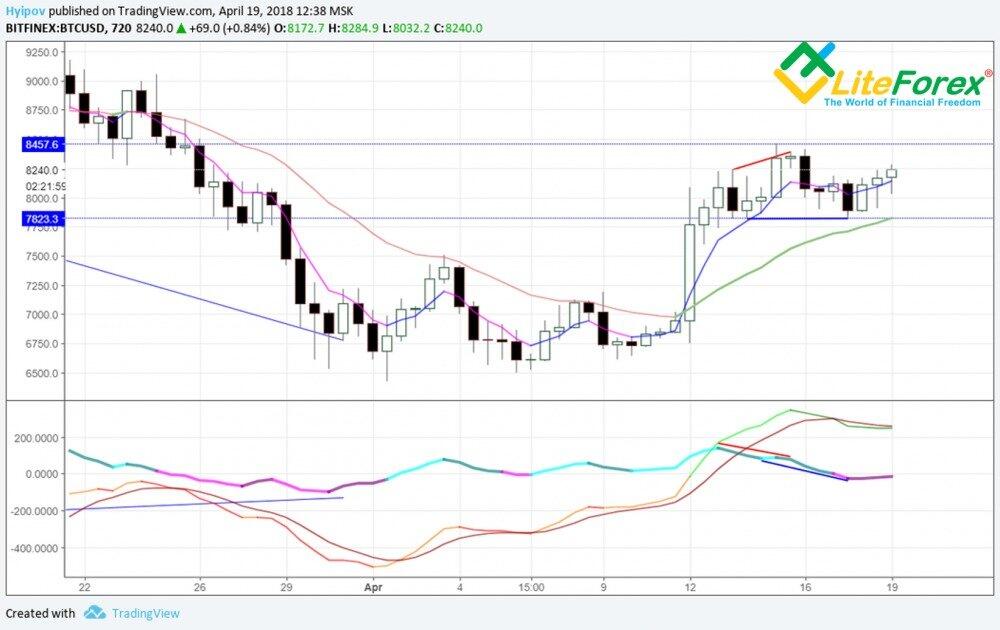
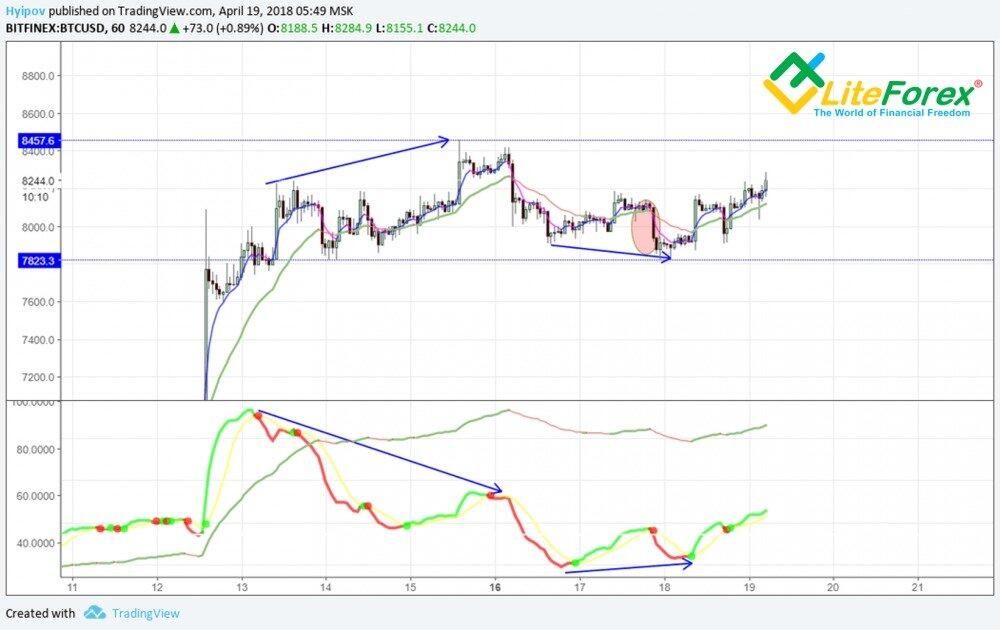
In 12-hour timeframe, we see that there was bearish divergence completed (red lines), followed by the bullish one. Considering that there is bearish divergence in the longer timeframe, we understand that the price growth after the last bullish signal is strongly limited. Therefore, for the ultimate proof of the bearish divergence in the daily chart, we need another bearish divergence to emerge in 12-hour chart.
As we understand, bearish divergence can’t emerge without the price growth, and so, we can expect the growth, so that the signal form the longer timeframe works out.
Altogether, all these divergence, combined, will be called a phase signal. In other words, a phase signal is a strong reversal signal, combining two (rarely, three) reversal divergences, and one, in the same direction, in the shorter timeframe. This formation is the featured by the market after a strong price jump (in our case, it was the jump on April 12).
Unfortunately, the phase signal, like divergence (convergence) signals themselves, doesn’t define the depth and the length of the reversal movement. Nevertheless, they clarify the process of technical analysis and help trader find out the best position to enter a trade.
Let’s sum up this educational post:
- It is important to find out “your” long trend, and base your strategy on it.
- Reversal signal in longer timeframes must always be confirmed by reversal signals in shorter timeframes.
- It is very risky to trade against the long trend if the reversal is not confirmed.
- Check the reversal signal in the longer timeframe.
- Monitor the phase signal, which is a strong reversal signal:
- it emerges after a strong, pulse jump;
- it includes a few divergences (convergences) in the same timeframe;
- it is always confirmed in the longer timeframe.
I will describe phantom signals in the next post.
I’m also going to tell about adaptive channels, teach you to set the targets, according SK-FX strategy, and try to sum up everything, written before, turning out all four posts into a clear and concise algorithm for trading with SK-FX strategy.
You can read the previous posts about SK-FX here:
SK-FX - a High Accuracy Strategy (part 1)
SK-FX - a High Accuracy Strategy (part 2)
I wish you good luck and good profits!
P.S. Did you like my article? Share it in social networks: it will be the best "thank you" :)
Useful links:
- I recommend trying to trade with a reliable broker here. The system allows you to trade by yourself or copy successful traders from all across the globe.
- Use my promo code BLOG to get a 50% deposit bonus on the LiteFinance platform. Simply enter this code in the appropriate field when funding your trading account.
- Telegram chat for traders: https://t.me/litefinancebrokerchat. We are sharing the signals and trading experience.
- Telegram channel with high-quality analytics, Forex reviews, training articles, and other useful things for traders https://t.me/litefinance
The content of this article reflects the author’s opinion and does not necessarily reflect the official position of LiteFinance broker. The material published on this page is provided for informational purposes only and should not be considered as the provision of investment advice for the purposes of Directive 2014/65/EU.
According to copyright law, this article is considered intellectual property, which includes a prohibition on copying and distributing it without consent.