TD Sequential indicator and its analogue TD Combo indicator
Dear friends,
In the first part of this article, I’ll describe in detail how to apply TD Sequential, the indicator developed by Tom DeMark. In the second part, I’ll write about its analogue TD Combo, and how to use it together with TD Sequential and the patterns like TD Camouflage, TD Clop, TD Clopwin, TD Open, TD Trap to improve the signals efficiency.
TD Sequential indicator (by Tom DeMark) and how to apply it to the technical analysis
From this part you will learn: TD Sequential structure, TD Sequential properties and requirements, TD Sequential trading signals.
I continue my educational block. Today, I would like tell you about an interesting forecasting tool of technical analysis, which is quite rarely applied to cryptocurrency charts. However, in my opinion, this indicator is one of the most efficient and can perfectly supplement any trading strategy.
I will deal with Tom DeMark Sequential indicator. Basically, the indicator shows the end of local trends, helping to identify when the trend is fading and starting to reverse.
It is important that the indicator works only in the charts of Japanese candlesticks and bars.
So, this indicator is ideally combined with price pattern analysis Price Action and is used in classic Japanese candlestick analysis
This forecasting tool consists of three elements:
- Price flip is a signal of a potential reverse.
- Setup filters out the signals, that is, it identifies where a new trend starts and when there is only a correction within the current trend.
- Countdown calculates the trend length to identify the moment of its fading and the emerging of a new cycle, Price flip element.
Not to simply retell DeMark’s strategy, I will give examples of how the tool is applied to the BTCUSD pair.
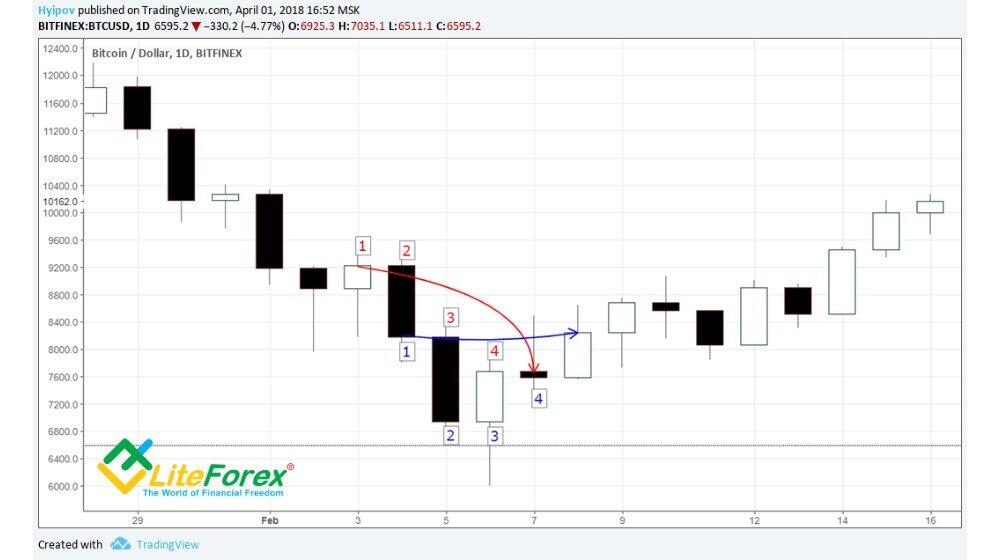
As I have already said, the first reversal sign is Price flip element. It consists of 6 candlesticks and can be easily identified.
Requirements for Sell Price flip:
- The last candle closes LOWER than the close four bars earlier.
- The last but one close is HIGHER than the close four bars earlier.
In the BTCUSD chart above, we see this reversal pattern.
There, the last candle closes Price flip pattern and marks the start of the new Setup element.
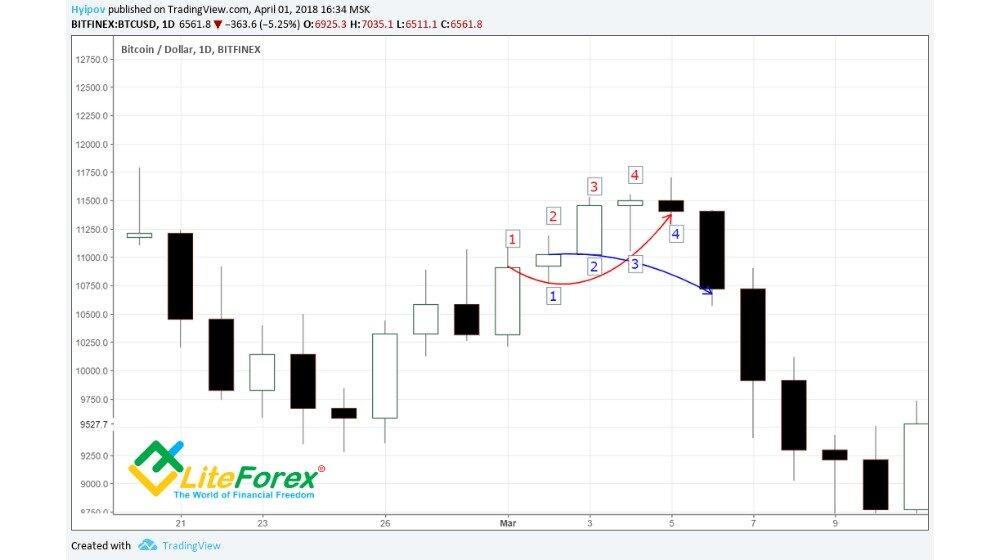
Requirements for Buy Price flip are the opposite:
- The last candle closes HIGHER than the close four bars earlier
- The last but one close is LOWER than the close four bars earlier
(an example of bullish Price Flip is in the chart below).
After this pattern has formed, the last bar indicates the start of a new element, Setup.
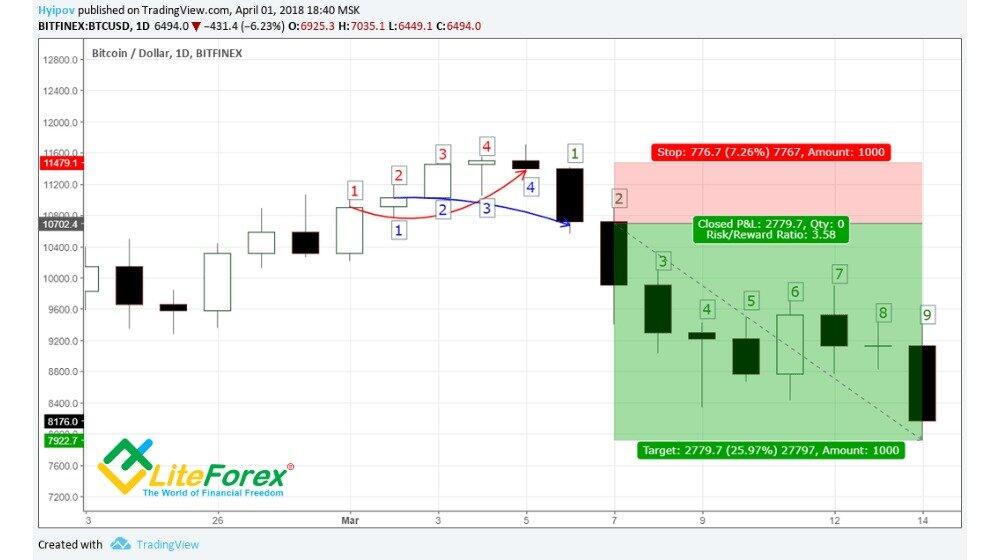
Here, it should be noted that the move from Price Flip to Setup is not the main entry signal, however, it is possible to enter a trade at second Setup candlestick with a stop order beyond the first candlestick’s shadow (DeMark call this level TDST).
In the chart below, there is an example of such a trade.
Setup is a reversal pattern and is called according to the signal that is formed after the whole cycle has been closed. Therefore, Sell Price Flip is followed by Buy Setup, and vice versa.
In short, a whole Setup pattern consists of 9 candlesticks.
Buy Setup occurs when there are 9 consecutive closes lower than the close 4 bars earlier. For Sell Setup, the requirements are opposite, that is, there are must be 9 consecutive closes higher than the close 4 bars earlier.
In addition, if this requirement is not met at any of 9 candlesticks. The pattern is considered to be broken, the whole procedure, beginning from searching for Price Flip, must be started again.
Finally, according to DeMark, to enter a trade at Setup finish, it should meet the requirements, allowing calling it “perfect” or “ideal”. That is, the high (low) of bars 8 or 9 should be higher (lower) or equal to the high (low) of bar 6 and bar 7 in Sell (Buy) Setup. If the requirement is not satisfied, it is necessary to expect new bars, until the condition of an ideal position is fulfilled.
After an ideal position has formed, the last cycle element, Countdown, starts.
You count the bars in Countdown, according to the following rules:
- The pattern contains 13 bars in total.
- It doesn’t have to be a consecutive sequence of 13 bars.
- You count only the bars that close higher (lower) or equal to the high (low) of Sell (Buy) Countdown close 2 bars earlier.
I know, it sounds a little confusing. So, to understand it better, let’s study the example in the chart below.
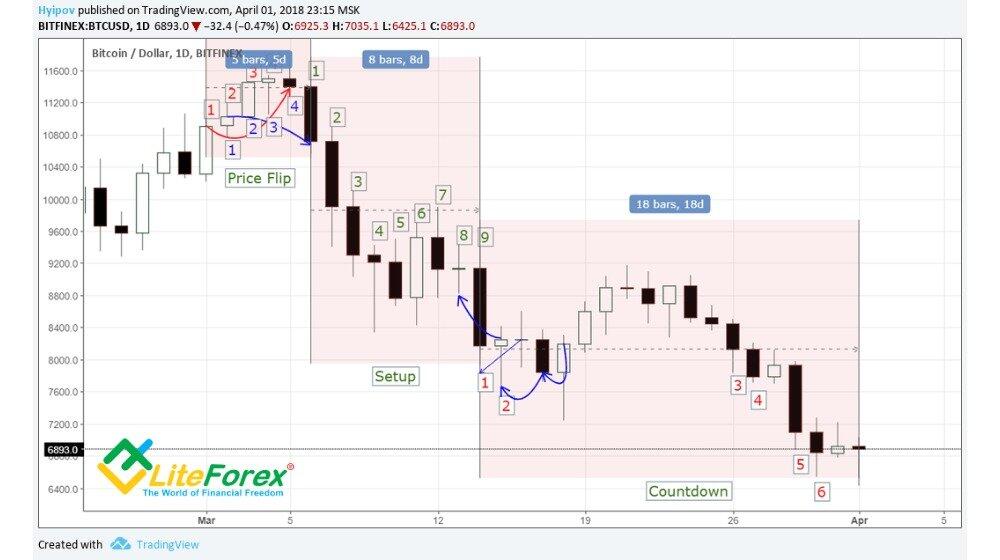
As we see, bar 9 in Setup identified the start of the last cycle element, Countdown.
It starts new counting.
The next bar satisfies the requirement that the close must be lower than the close two bars earlier, so, we mark it as bar 2.
Bar 3 closes higher than the close two bars earlier, therefore, we don’t count it.
In this way, we count to 13, and then, according to DeMark’s theory, we can expect a new Price Flip to emerge and a new trend to start.
Besides, bar 13 should satisfy two requirements simultaneously:
- the high (low) of bar 13 should be lower (higher) or equal to the close of bar 8 for Sell (Buy) Countdown;
- the close should be higher (lower) than the high (low) two bars earlier for Sell (Buy) Countdown.
If the last candlestick doesn’t meet these requirements, it is marked with «+» above, and we look for bar 13 at the next one.
It should be noted here, Countdown is counted from the last Setup bar, and so, if there forms a new Setup in the opposite direction, then we should start counting Countdown from the new one.
In his trading system TD Sequential, DeMark pays special attention to such an element as TDST. Basically, these are the support and resistance levels that are built from the extremes of the first bar in Setup pattern.
Therefore, the high of the first Sell Setup bar is the resistance level, the low of the first Buy Setup bar is the support level.
It is illustrated in the chart below.
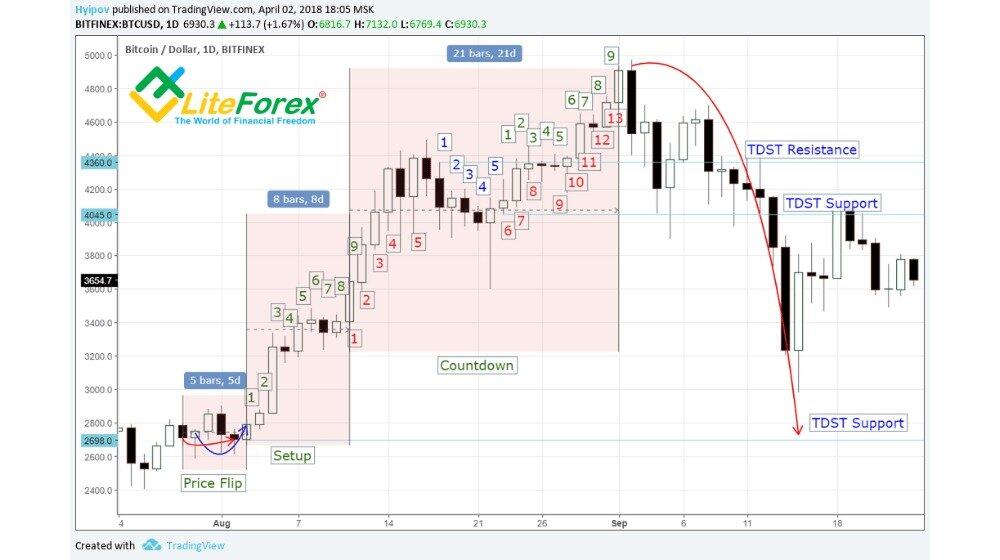
You see, the first Sell Setup forms TDST Support near the level of 2698 USD.
Then, already within Countdown, Buy Setup is emerging, so, we can mark TDST resistance level at the level of 4360 USD.
However, this Setup becomes irrelevant already with the sixth bar.
A new Sell Setup is emerging with TDST support at the level of about 4045.
As you have understood, TDST are strong levels, the ticker often moves in the corridor between them. TDST breakout usually signals the trend extension.
In the chart above, the breakout of TDST support in the last Setup confirmed the bearish trend extension. However, a strong bullish signal was the ticker reversal at the level of about 3 000 USD that didn’t break out TDST Support line, where the very first Setup had been formed, being the base for Countdown.
Let's try out the indicator using MetaTrader. You can download it here. Don't forget to register and open your trading account prior to this. You might as well use a demo account to use the indicator.
How to trade with the Demark Indicators?
Buy (sell) when buy (sell) Setup pattern is complete, satisfying three requirements:
- buy (sell) Setup is perfect;
- none of buy (sell) Setup bars crosses its line of TDST Support (Resistance);
- bar 9 closes very near TDST Support (Resistance).
Buy (sell) when buy (sell) Countdown is complete:
- aggressively – after bar 13 has formed;
- conservatively – after Price Flip has been formed.
I will note, there are lots of open access scripts and complete indicators that you can install on the chart and do not calculate manually.
Use for your search the keywords is TD Sequential and TD Setup.
I recommend testing them yourselves, trying them in different timeframes and for different trading instruments
I find this forecasting tool quite interesting in defining strong support and resistance levels. Combined with graphic analysis, candlestick analysis and oscillators, it provides quite accurate signals.
The only problem with this indicator is that it sends too few trading signals, so, to apply it in trading, one should be really patient. From personal experience, I can say that the most efficient timeframes are 4-hour one and longer. In shorter timeframes, there are too many incomplete patterns, so, you may not see any full signals.
Part 2. Technical indicators by Tom DeMark: TD Combo, TD Camouflage, TD Clop, TD Clopwin, TD Open, TD Trap
From this part, you will learn about TD Combo, its features and TD Combo requirements, compared to TD Sequential. You will also read about signals like TD Camouflage, TD Clop, TD Clopwin, TD Open, TD Trap
Since there is great interest in Tom DeMark’s indicators, I go on dealing with TD Sequential. As you know, Tom DeMark didn’t stopped at Sequential, and the indicator became the base for many other trading systems and indicators.
In this part, I will describe TD Combo, the developed modification of the well-known indicator.
Like TD Sequential, its modification, TD Combo indicates the trend exhaustion. The indicator itself is more conservative and sells a signal after 30 candlesticks, not after 22 ones like Sequential. A good strong signal will be when these two indicators coincide, as it greatly increases the chances for positive result.
Similar to TD Sequential, Combo can be grouped into bullish and bearish setup.
Requirements for TD Combo buy:
- Bearish Price Flip has formed
- A series of 9 consecutive candles has been formed; each bar should close lower, than the fourth previous candlestick closed
The difference between TD Sequential and TD Combo is that TD Sequential is complete after TD Buy Setup fully completes; and only after that you start looking for suitable conditions for a TD Buy Countdown start.
In TD Combo, the stage of TD Buy Countdown also starts as soon as TD Buy Setup completes, however, the final countdown of TD Buy Countdown starts from the last but one candlestick of TD Buy Setup.
It is not a single difference between Countdown elements in TD Sequential and TD Combo. The final countdown in TD Sequential continues, provided that the price bar closes lower than the one closed two candlesticks ago. In TD Combo the final countdown goes on when all the four requirements are met:
- Each bar of TD Combo Buy Countdown must close at an equal or a lower level than the low of two bars earlier.
- Each low of TD Combo Buy Countdown bar must be equal or lower than the low of the previous price bar.
- Each close of TD Combo Buy Countdown bar must be lower than the previous close of Countdown bar.
- Each close of TD Combo Buy Countdown must be lower than the previous price bar's close
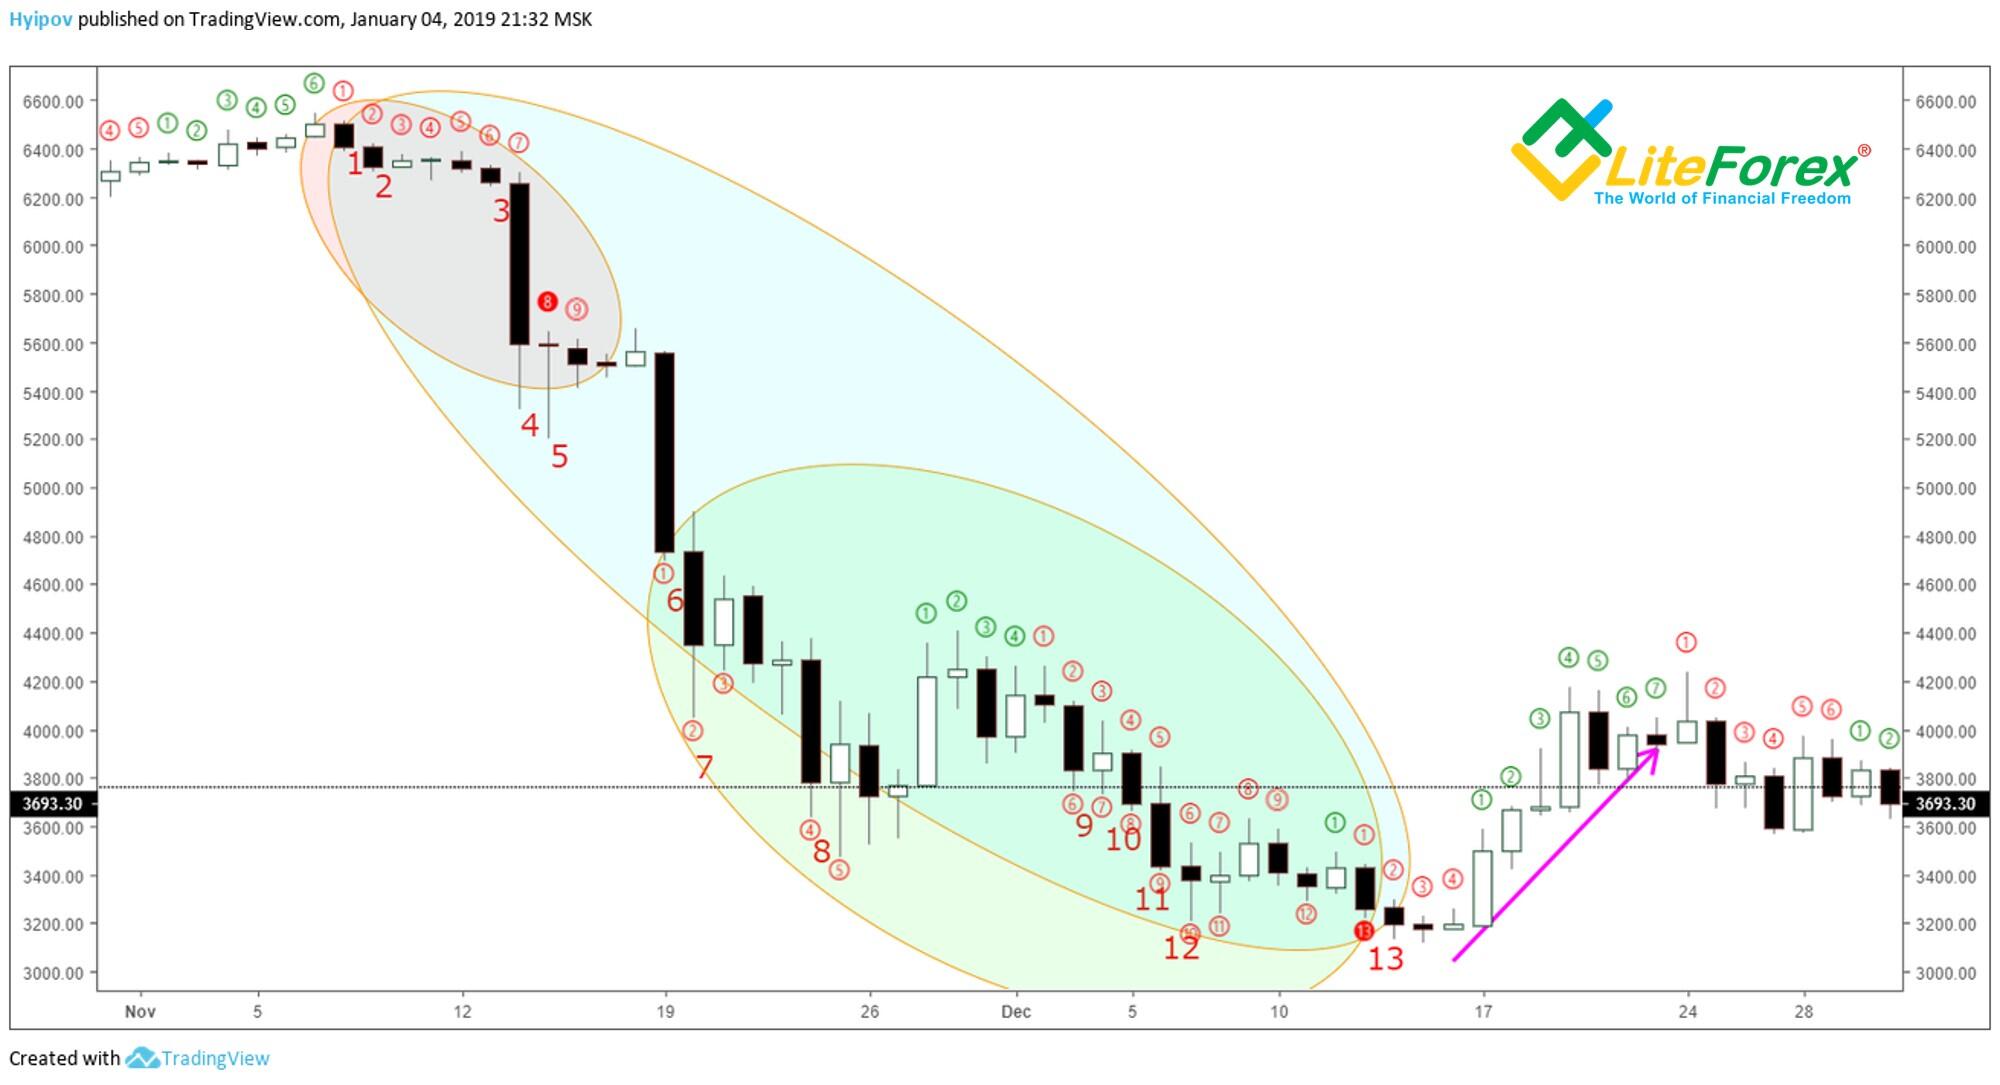
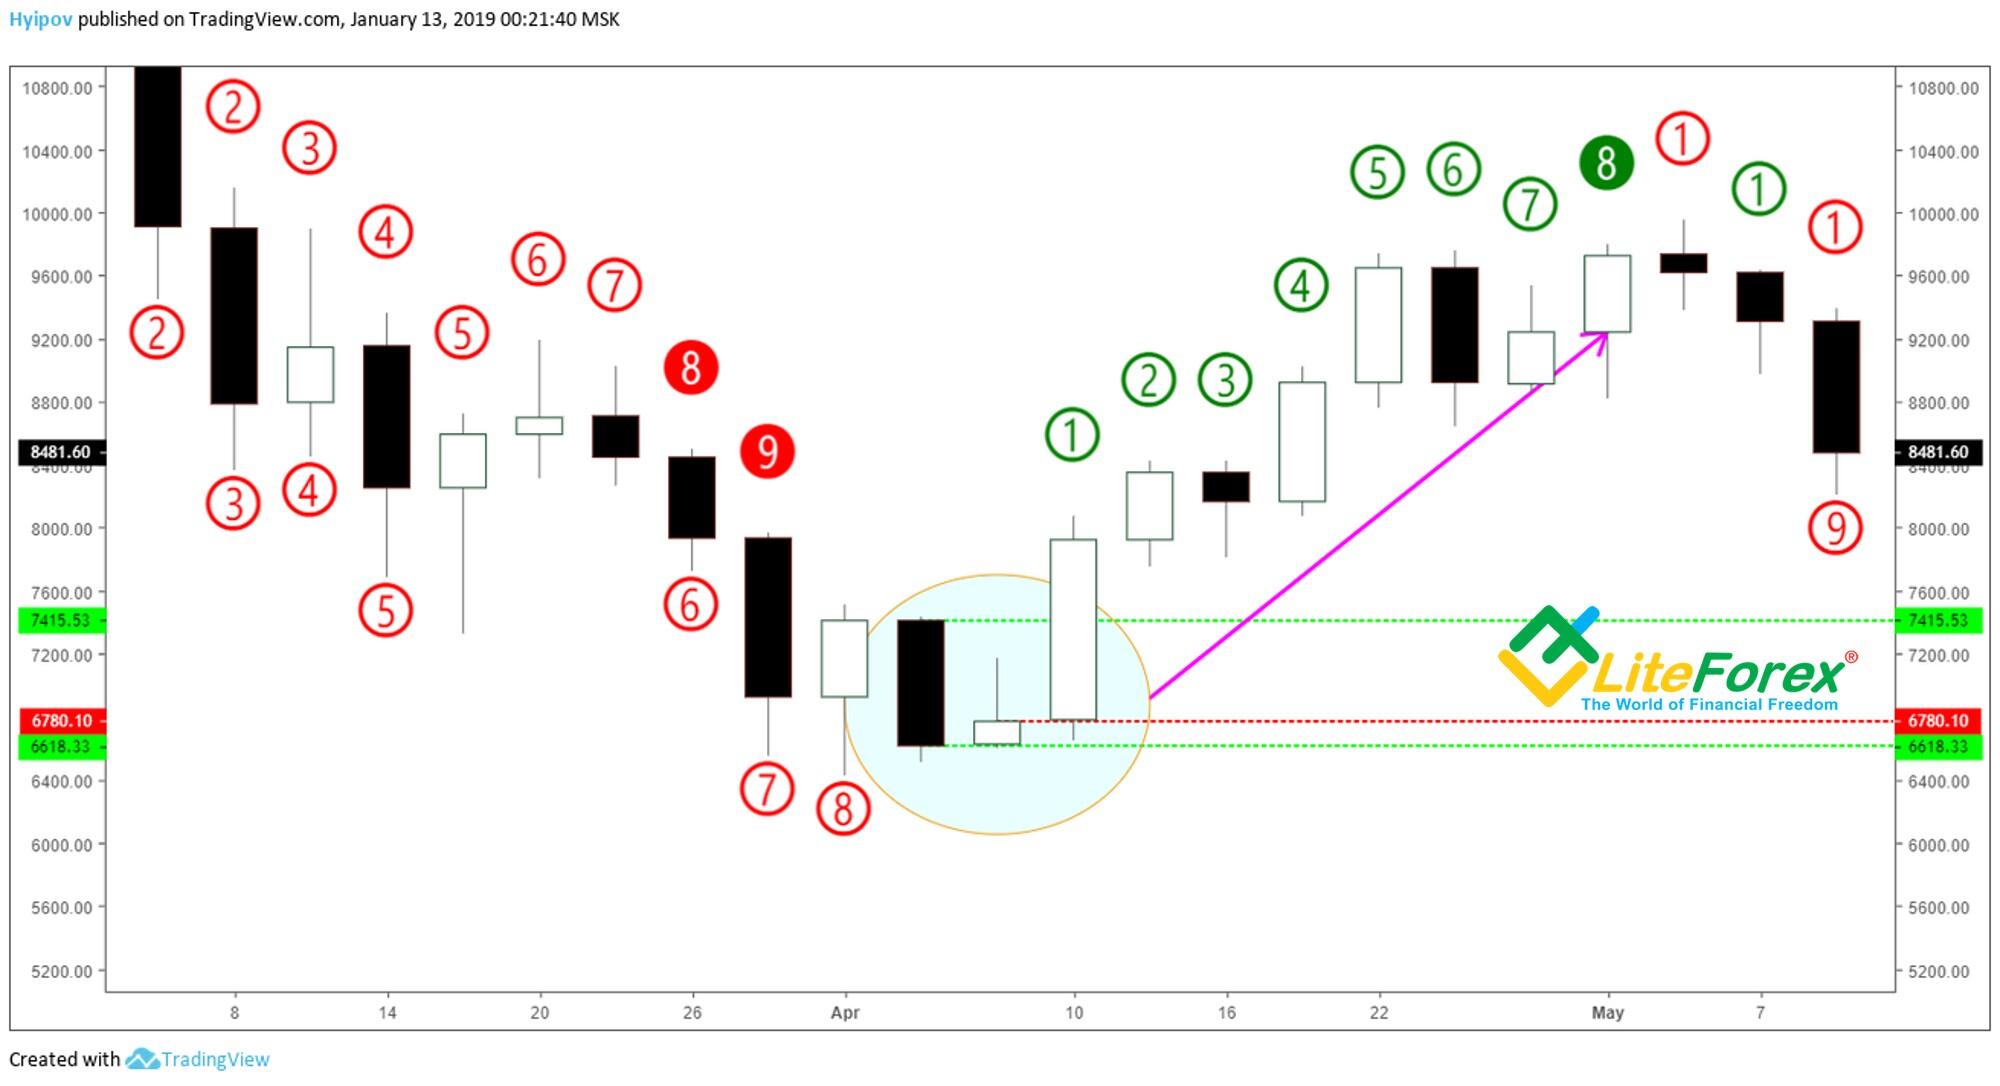
In the daily BTCUSD price chart, there is an excellent situation to demonstrate the difference between the approaches of TD Sequential and TD Combo.
The first big circle highlights the competition of TD Buy Setup. As I’ve already said, it is the same for both models. Next Countdown starts.
To make it clearer, I marked TD Sequential Buy Countdown with a green circle. As you see it starts the countdown after TD Buy Setup, once the requirement for the bar close to be lower or equal to the low of the candlestick two bars ago is met. TD Sequential Buy Countdown in the chart above is marked by circles under the spikes of price bars.
TD Combo Buy Countdown starts including the candlesticks that were in TD Buy Setup. The rules to construct the pattern I have described above; I marked it with a big blue circle in the chart above. The countdown itself is marked with plain red numbers in the chart.
As you see from the chart above, although the approaches to the final countdown in TD Sequential and TD Combo are a little different, these two indicators sent the signal at almost the same point. It much strengthened the entry signal and allowed the trader to safely enter a purchase.
Therefore, the entry point, like in TD Sequential, will be a successful close of candlestick 13.
As you see, just after candlestick 13 in TD Combo closed, the price decline stopped, and following two candlesticks, the BTC price started growing.
To be fair, I must note that there is a less conservative version of TD Combo. Like the conservative version, it also applies the four above rules, but they cover only 10 candlesticks. For bars 11, 12 and 13 in TD Combo Buy Countdown, the rule of countdown, the same as for TD Sequential Buy Countdown, is applied. It means that the candlestick must close at lower or an equal level of the low that was two bars ago.
Just in case, I’ll note that for TD Combo Sell, that spots the bullish market exhaustion, you apply all the rules described above, but you count the highs instead of lows, and the values must be higher, not lower.
Now, as I started discussing the entry point, I need to describe the risk management rules, suggested by DeMark.
DeMark risk management rules
1. Not necessary but very important rule for a safe entry is that the level of the buy signal should be different from TDST Resistance level by 1.5 times.
Remember thatTDST Resistance is the resistance levels that is at the high of the first candlestick in TD Sell Setup and at the low of the first candlestick in TD Buy Setup
2. If you enter a long, you need to set a Stop Loss lower than the TD Risk level.
TD Risk level for a long is defined as the lowest low of TD Combo Buy Countdown (including even the bars that haven’t been numbered) indented using the real range of this bar (i.e. the difference between the high and the low of this candlestick).
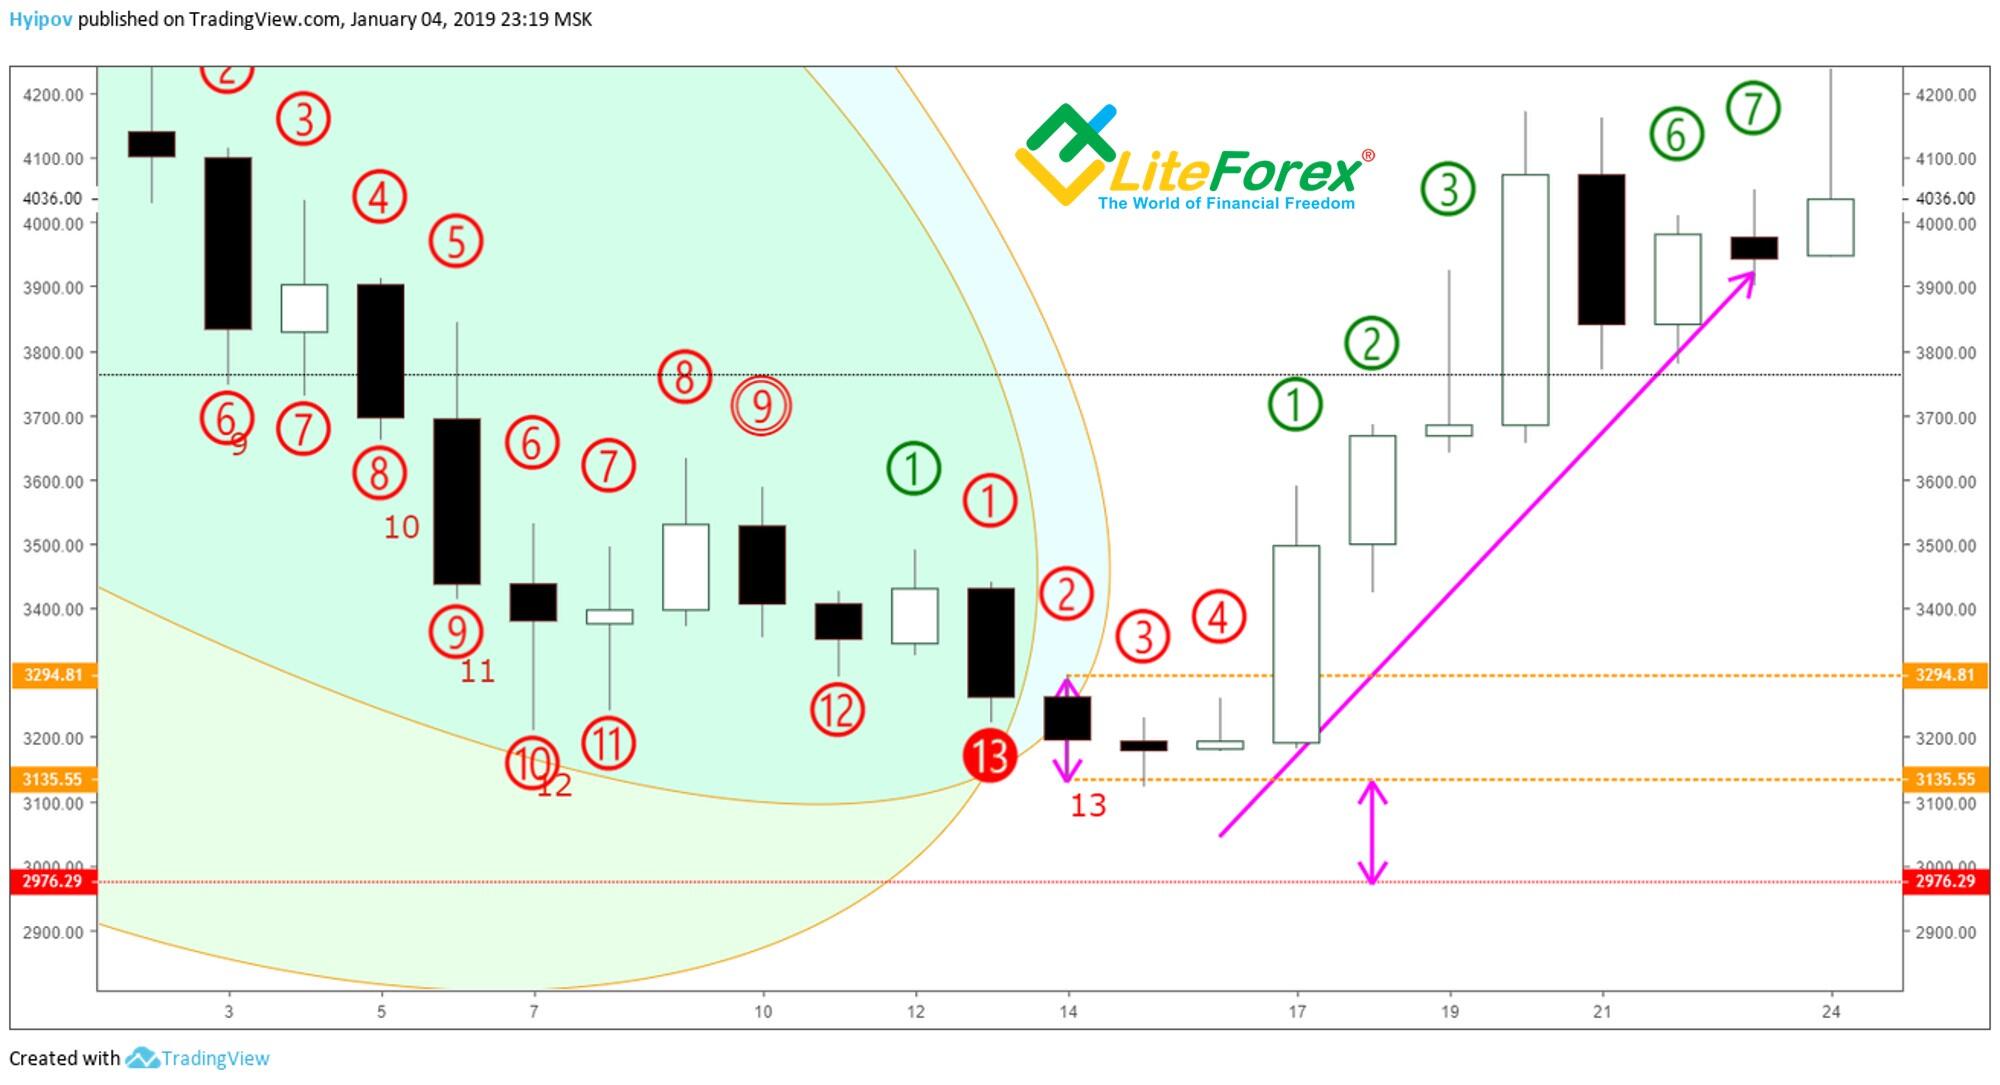
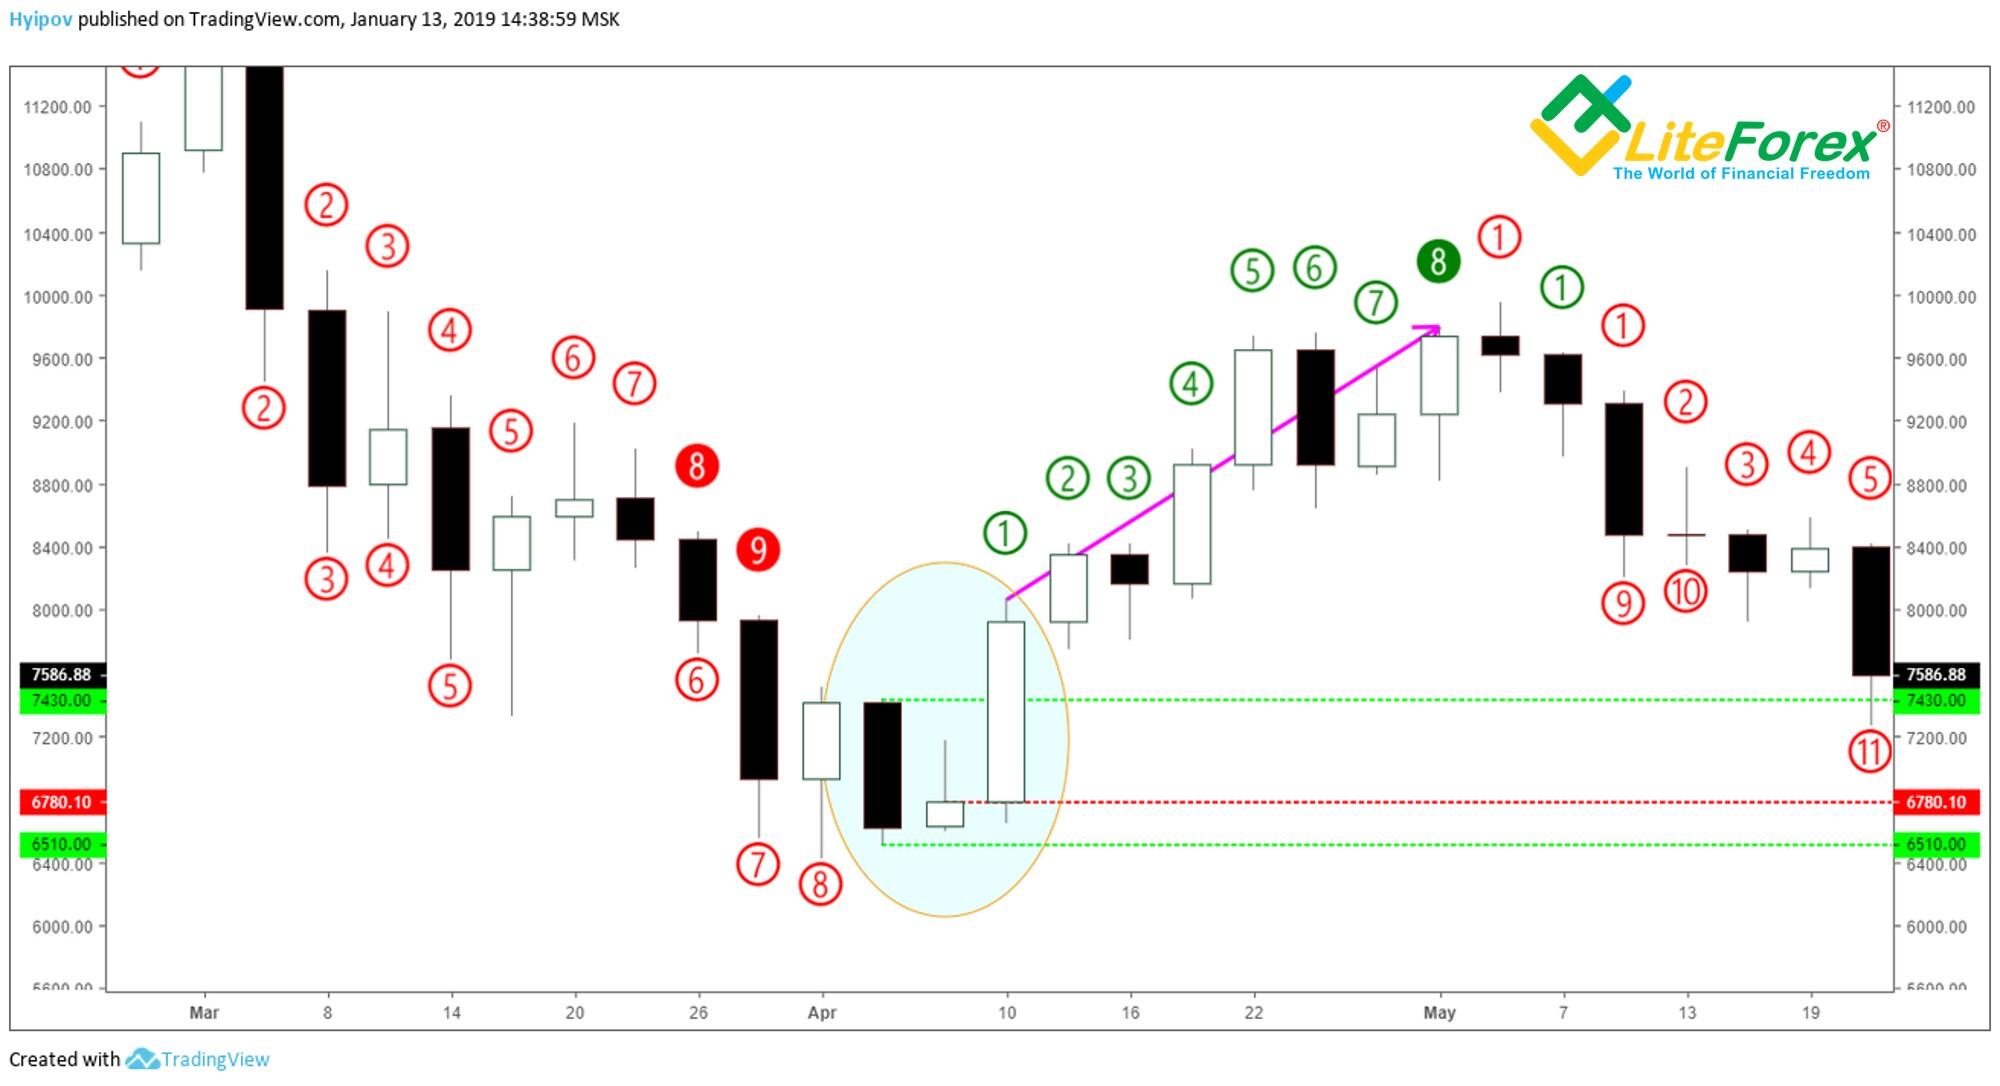
To better explain, I’d like to describe how to calculate TD Risk level on my example.
You see that the lowest value among all bars in TD Combo Buy Countdown is near candlestick 13. So, I calculated the TD Risk level based on this value.
To do it, I see the high and the low of this candlestick.
They are 3294.81 USD and 3135.55 USD -marked with orange dots in the chart.
The difference between these values is 159.26 USD.
Therefore, I subtract 159.26 USD from the low of 3135.55 USD and get 2976.29 USD. This level is the one, below which I set a stop loss, in case the market goes against my position.
Another important element of TD Combo and TD Sequential trading strategies is additional confirming signals to buy or sell.
Demark signals
Tom DeMark suggests five types of signals:
- TD Camouflage
- TD Clop
- TD Clopwin
- TD Open
- TD Trap
I will describe each of them in detail on the example of entering a long. To enter a short trade, the same rules are observed; you only change the word “higher” for “lower”, and the “high” for “low”.
Requirements for TD Camouflage:
1. Current bar must close lower than the previous price bar closed.
2. Current bar’s close must be higher than the open, i.e. the candlestick must be white (bullish).
3. Low of the current bar must be lower than the low, marked two candlesticks ago.
As you see from the description, the name of this pattern defines its structure quite well. According to the requirements, two features out of three are bearish in classical analysis.
The value of this signal is that, together with TD Combo or TD Sequential strategy, it helps identify the trend reversal at an early stage.
In fact, such a candlestick is rather rare in the cryptocurrency market, as the perfect situation for the formation is featured by a downward gap first. Only then, we can see a white candlestick, where the close will be lower than the previous close. To explain it more clearer, I have modeled this situation.
TD Clop candlestick is highlighted by a separate circle in the chart above. As you see from this example, the current candlestick’s open is lower then the opening and closing levels of the previous candlestick (orange line is below the two green ones); but the market price went up and was trading above these two green lines, which a strong bullish signal.
Features of TD Clop:
1. The current open must be lower than the previous open and close.
2. The price must be trading above the levels of the previous open and close.
Here, it is also basically about a pattern, emerging after a bearish gap. Only providing this, we can expect the situation when the candlestick opens at a level, lower than the previous candlestick’s open and close.
The second condition is dynamic, so, to safely apply the signal, you’d better expect the situation when the market in fact, within the analyzed candlestick, will reach the highs, higher than the open and the close of the previous bar.
Unfortunately, I haven’t managed to find a good example quickly, so I will also show a modeled situation here.
TD Clop candlestick is highlighted by a separate circle in the chart above. As you see from this example, the current candlestick’s open is lower than the opening and closing levels of the previous candlestick (orange line is below the two green ones); but the market price went up and was trading above these two green lines, which a strong bullish signal.
As it is clear, the TD Clop features don’t contradict the conditions for TD Camouflage, and so, there may be a situation when the same candlestick combines a few signals, according to DeMark.
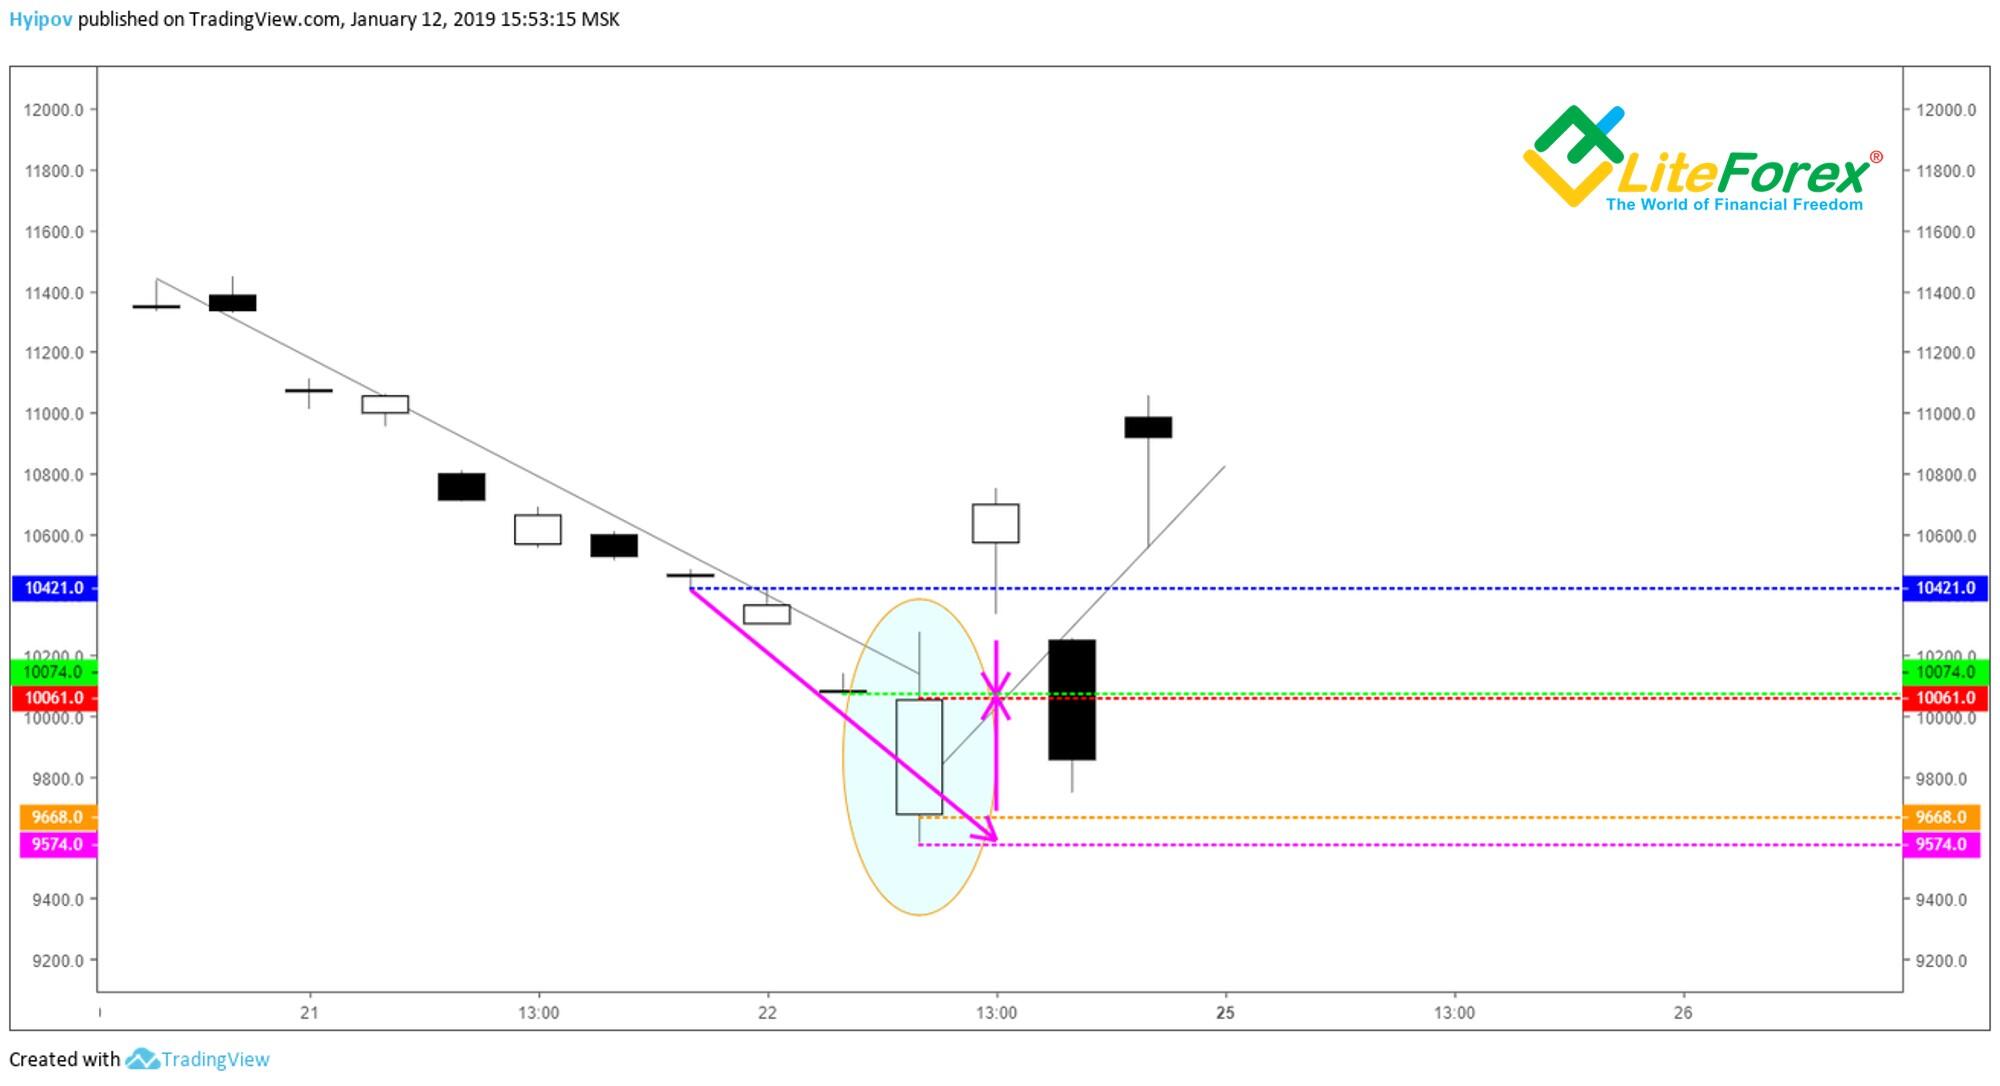
The next signal is TD Clopwin. As in the previous case, to identify the pattern, you need to compare the closing and opening levels of the current bar with the previous ones.
TD Clopwin features:
1. Opening and closing levels of the current price bar must be within the range of open and close of the previous bar.
2. The current bar’s close must be higher than the closing level of the previous price bar.
Therefore, one of frequent cases for such situation may be when the previous candlestick was bearish (black) and the recent one is either bullish or a doji.
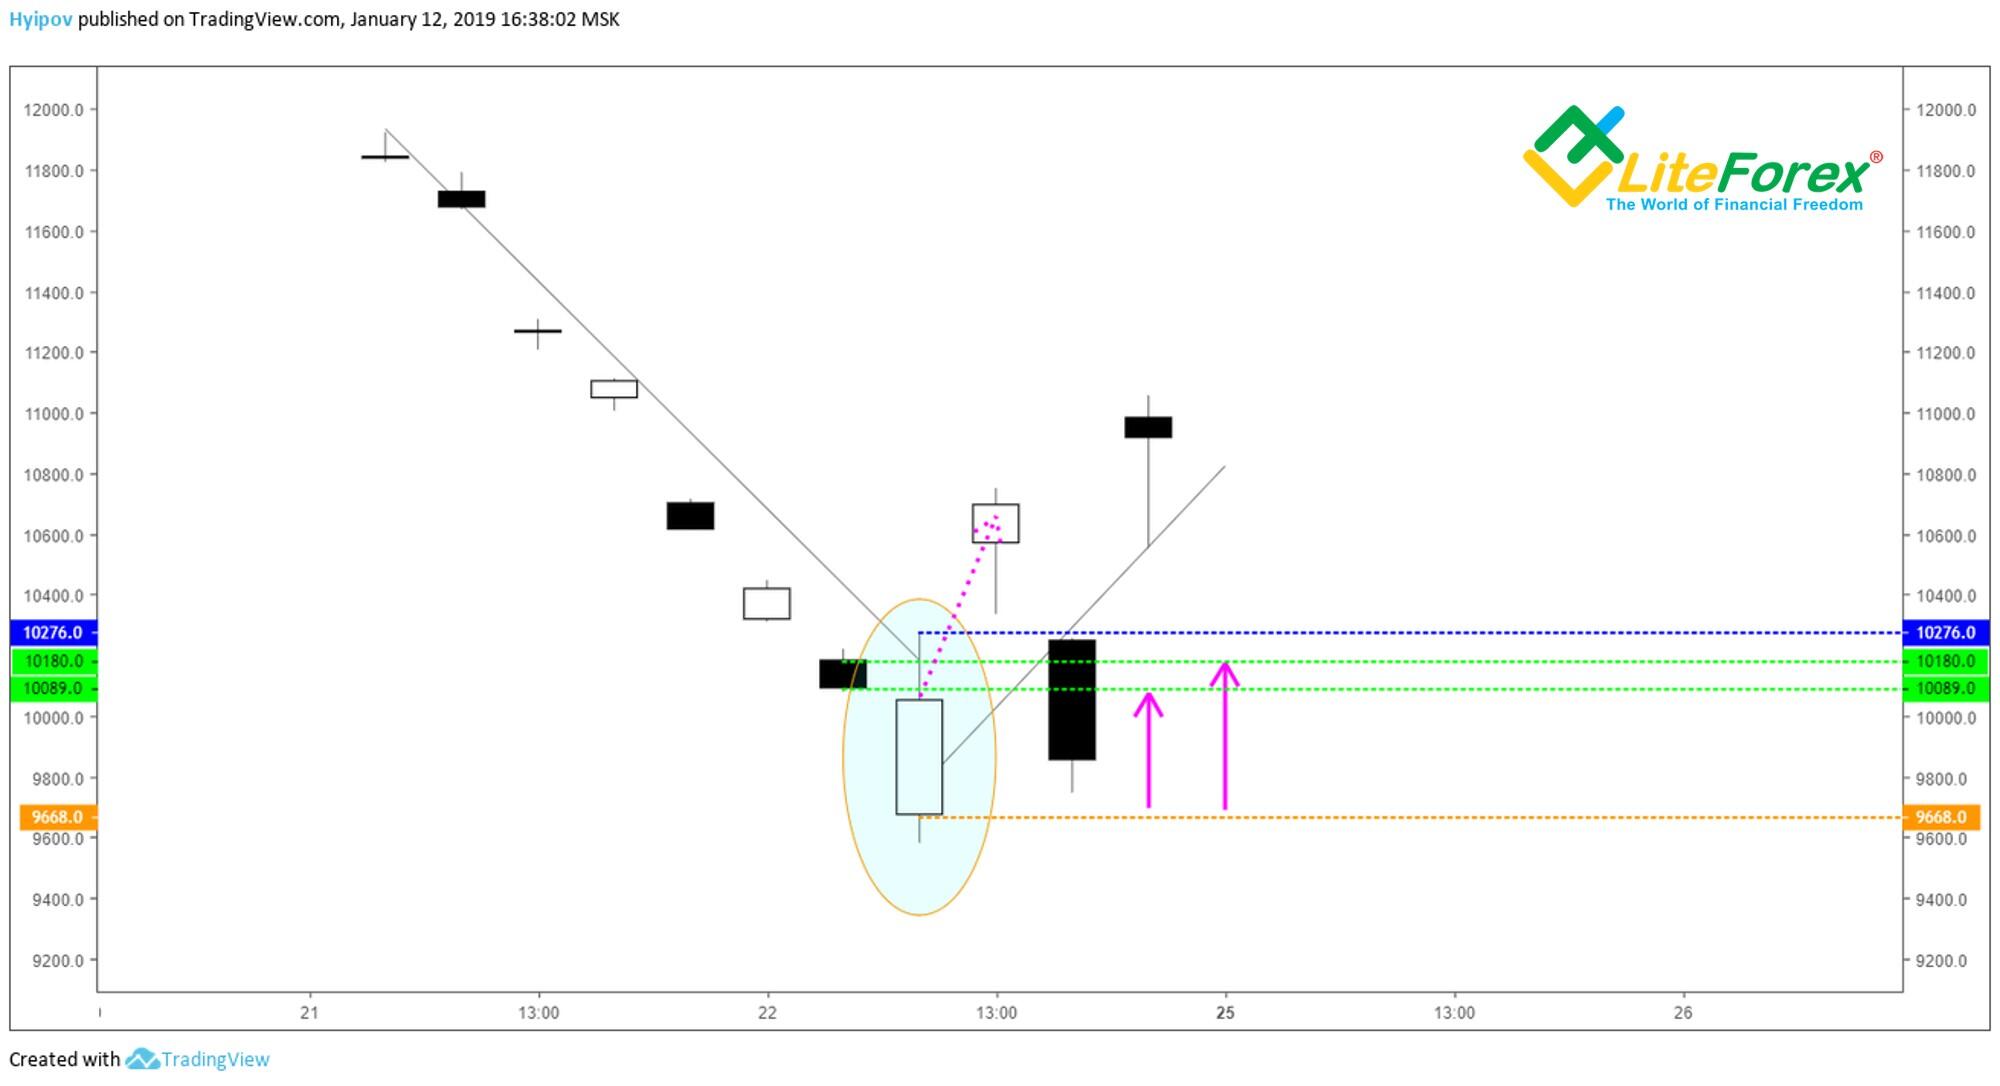
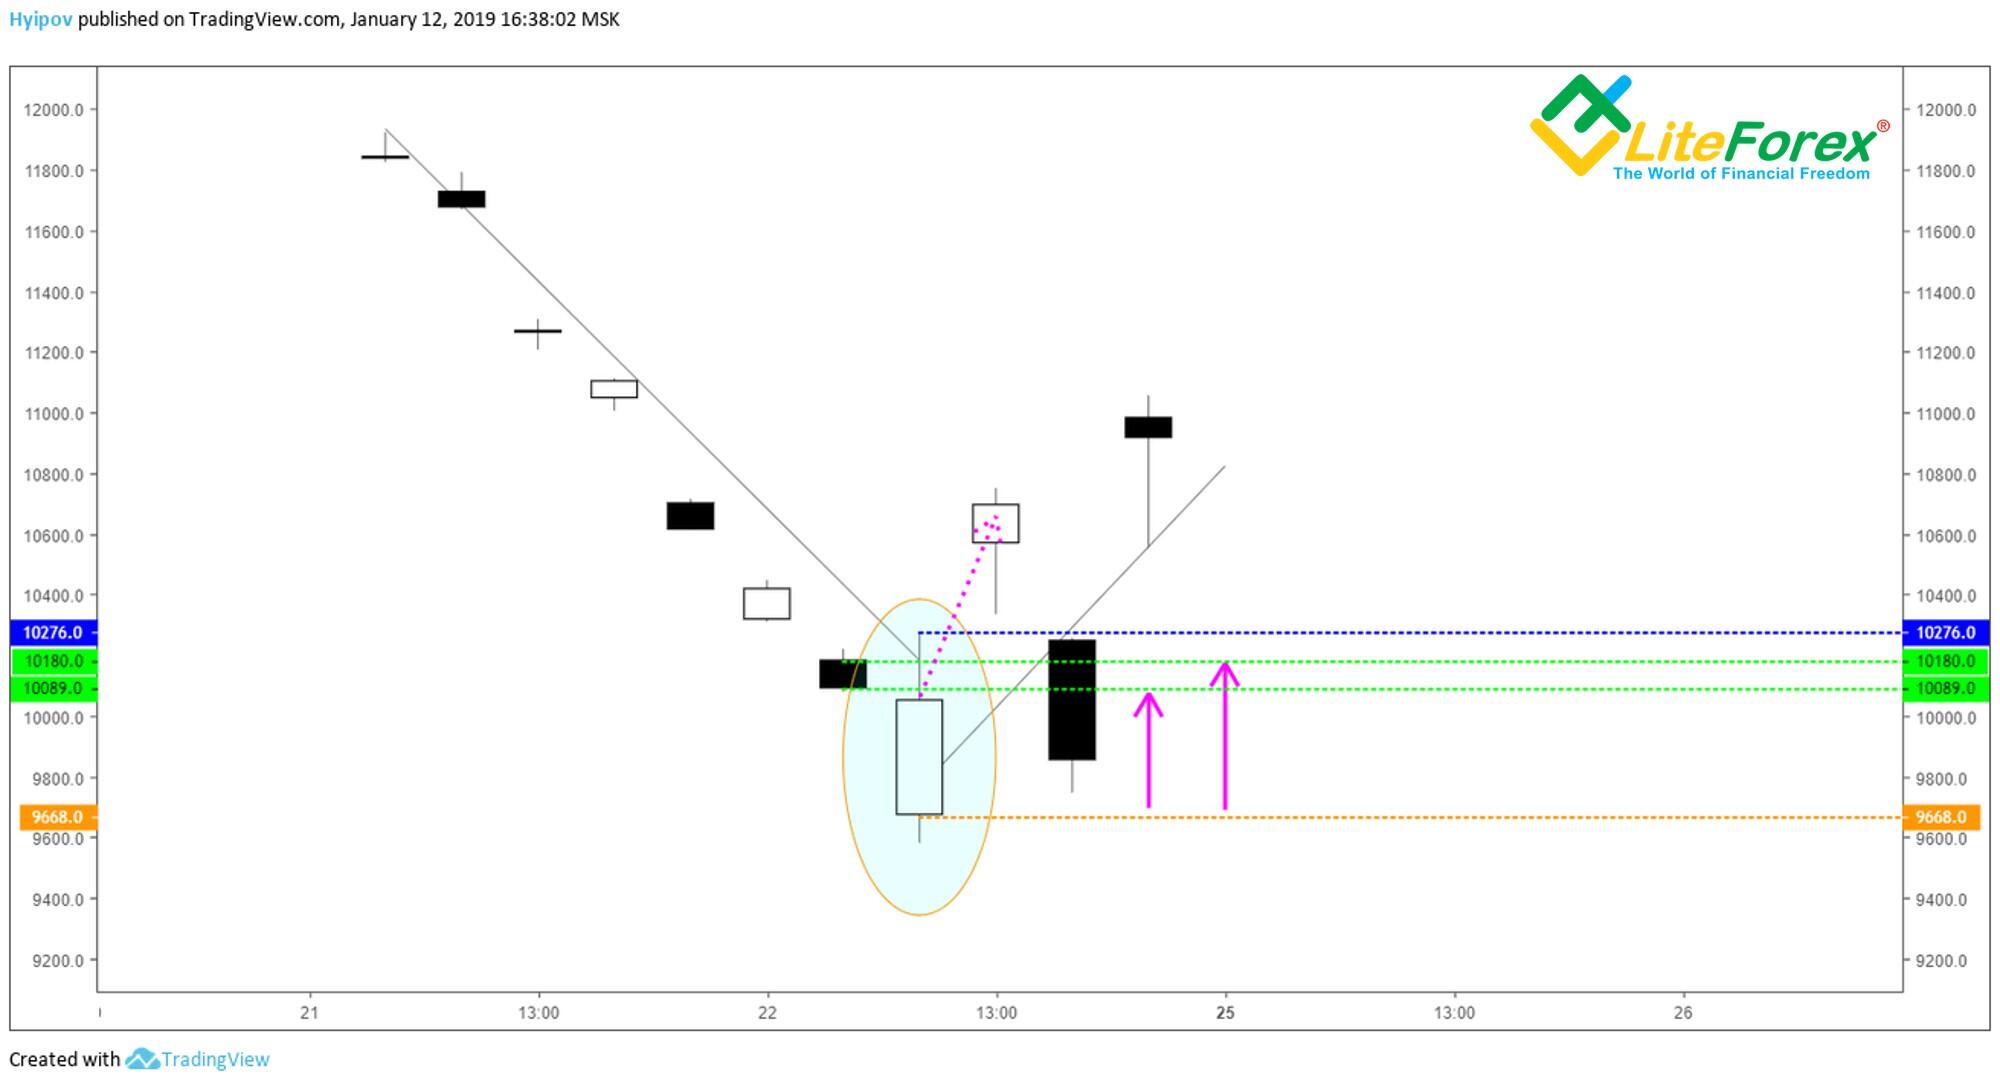
Fortunately, this situation is not that seldom. It is clear from the chart above that there was a perfect TD Buy Setup complete, followed by a TD Clopwin. I highlighted it with a circle.
This white candlestick meets two requirements:
1. Its close and open are within the range of the previous candlestick (the range of its closing and opening levels).
2. Closing level of this candlestick is higher than the previous close. You see from the chart above that TD Clopwin closing level (marked with red line) is at 6780.10 USD, and the previous close is at 6618.33 USD
In case with a sell signal, as you understand, everything must be vice versa. The previous candlestick should be white, and the closing level of the current candlestick must be lower than the previous close.
The result was soon and the BTCUSD ticker has featured a sharp rise on the next candlestick already (see the figure above).
Requirements for TD Open:
1. The current candlestick’s open must be lower than the previous one.
2. The current candlestick must be trading higher than the previous candlestick’s low.
This pattern is basically similar to TD Clop, and the example given for that pattern is relevant for this case as well.
As you see from the chart above, the TD Open candlestick opened at level, lower than the low of the previous candlestick (the second green line), beside, the price went up and was trading higher than this level.
Like in case with TD Clop, TD Open is pattern, following a gap, i.e. there must be a price gap. In case with a buy signal of TD Open, the gap must be downward.
Requirements for TD Trap:
1. The current candlestick must be within the range of the previous price bar.
2. The next candlestick must exceed the range, set by the bar of one of the previous candlesticks.
This pattern looks like TD Clopwin; the only difference is that here you compare highs and lows, rather than closing levels, like in the previous pattern.
To sum up this part, I’ll repeat the key points. I described TD Combo trading strategy and compared it with TD Sequential. I also described DeMark’s patterns: TD Camouflage, TD Clop, TD Clopwin, TD Open, TD Trap.
You can use the indicators on the BTC/USD chart, just as I've shown.
To increase the efficiency, I suggest using TD Combo together with TD Sequential with the combined application of the describe patterns. Unfortunately, I haven’t managed to provide real examples for all the cases described. However, I am sure that this tool will be most convenient in the equity and futures market.
I haven’t yet finished writing about DeMark’s indicators.
I am going to devote my next educational post to the tools, developed by Tom DeMark, which will be especially interesting for traders, familiar with Elliot Wave Theory. Tom DeMark quite successfully combined his indicators with the wave theory and developed his own original wave model, known as TD D-Wave. Subscribe and you will not miss the continuation!
Here, I am about to finish another part of my training block, devoted to describing Tom DeMark’s tools, applied to the BTCUSD pair. I do really hope that this material is helpful and interesting for you!
I wish you good luck and good profits!
PS. If you agree with my ideas, write “+” in the comments; if you don’t agree, put “-”. Would you feel that this bottom is a good level to invest in bitcoin today for the long term prospects? Let me know your opinion in comments also.
If you liked the post, just write thank you, and don’t forget to share the post. It is easy for you and I will be very pleased :)
Stay informed on the latest cryptocurrency and forex market news, follow my posts on the blog.
Useful links:
- I recommend trying to trade with a reliable broker here. The system allows you to trade by yourself or copy successful traders from all across the globe.
- Telegram channel with high-quality analytics, Forex reviews, training articles, and other useful things for traders http://t.me/litefinance.
P.S. Did you like my article? Share it in social networks: it will be the best "thank you" :)
Useful links:
- I recommend trying to trade with a reliable broker here. The system allows you to trade by yourself or copy successful traders from all across the globe.
- Use my promo code BLOG to get a 50% deposit bonus on the LiteFinance platform. Simply enter this code in the appropriate field when funding your trading account.
- Telegram chat for traders: https://t.me/litefinancebrokerchat. We are sharing the signals and trading experience.
- Telegram channel with high-quality analytics, Forex reviews, training articles, and other useful things for traders https://t.me/litefinance
Price chart of BTCUSD in real time mode
The content of this article reflects the author’s opinion and does not necessarily reflect the official position of LiteFinance broker. The material published on this page is provided for informational purposes only and should not be considered as the provision of investment advice for the purposes of Directive 2014/65/EU.
According to copyright law, this article is considered intellectual property, which includes a prohibition on copying and distributing it without consent.